Every data element collected by the OM survey component (e.g., cohort counts, outcomes by time after entry) can be broken down into eight subcohorts based on entering, attendance, and Pell Grant recipient statuses. In addition to these student characteristics, data users can also segment these data by key institutional characteristics such as sector, Carnegie Classification, special mission (e.g., Historically Black College or University), and region, among others.4 Figure 3 displays the status of degree/certificate-seeking undergraduates 8 years after entry by each student subcohort within the broader 2012–13 degree/certificate-seeking cohort.
Figure 3. Number and percentage distribution of degree/certificate-seeking undergraduate students 8 years after entry, by Pell Grant Recipient status, entering and attendance status, and award and enrollment status: 2012–13 adjusted cohort
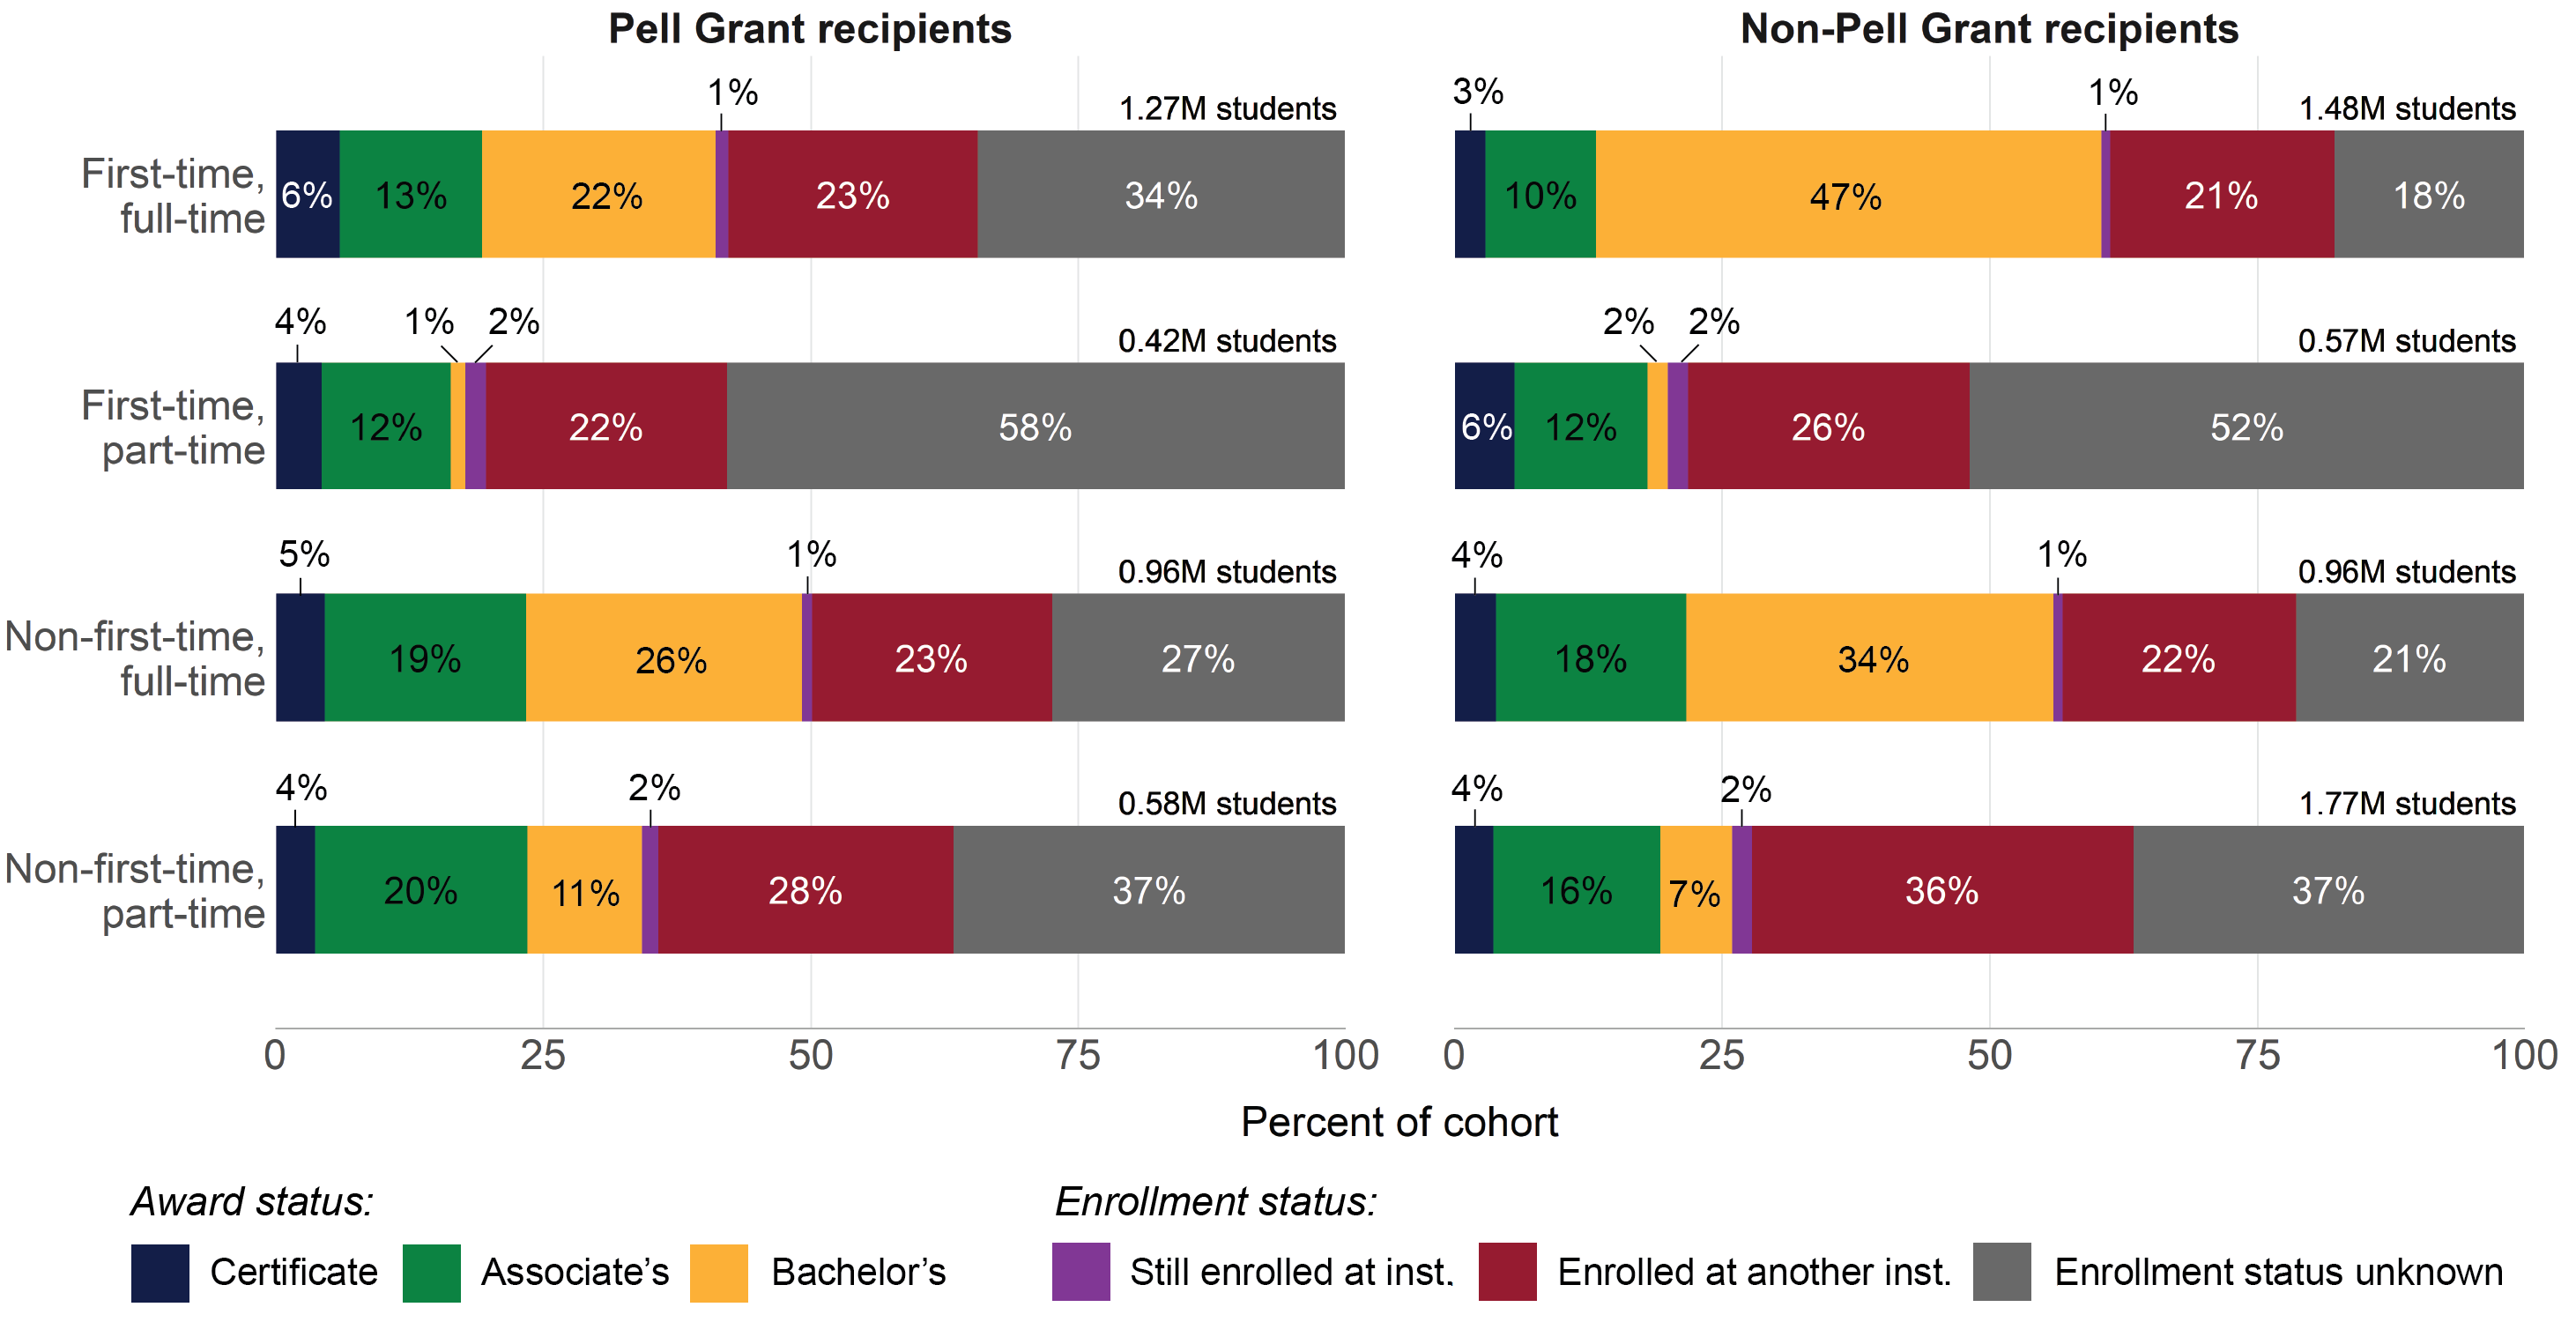
NOTE: This figure presents data collected from Title IV degree-granting institutions in the United States. Percentages may not sum to 100 due to rounding.
SOURCE: U.S. Department of Education, National Center for Education Statistics, Integrated Postsecondary Education Data System (IPEDS) Outcome Measures component provisional data (2020).
How do Outcome Measures outcomes vary over time?
OM data are comparable across 4 cohort years.5 Figure 4 shows outcomes of degree/certificate-seeking undergraduates 8 years after entry from the 2009–10 cohort through the 2012–13 cohort for so-called “traditional” (i.e., FTFT) and “non-traditional” (i.e., non-FTFT) students.
Key takeaways:
- For both traditional and non-traditional students, the percentage of students earning an award was higher for the 2012–13 cohort than for the 2009–10 cohort, climbing from 47 percent to 51 percent for traditional students and from 32 percent to 35 percent for non-traditional students.
- The growth in award attainment for traditional students was driven by the share of students earning bachelor’s degrees (30 percent for the 2009–10 cohort vs. 35 percent for the 2012–13 cohort).
- The growth in award attainment for non-traditional students was driven by the share of students earning both associate’s degrees (15 percent for the 2009–10 cohort vs. 16 percent for the 2012–13 cohort) and bachelor’s degrees (13 percent for the 2009–10 cohort vs. 15 percent for the 2012–13 cohort).
Figure 4. Number and percentage distribution of degree/certificate-seeking undergraduate students 8 years after entry, by first-time, full-time (FTFT) status and award and enrollment status: 2009–10 to 2012–13 adjusted cohorts
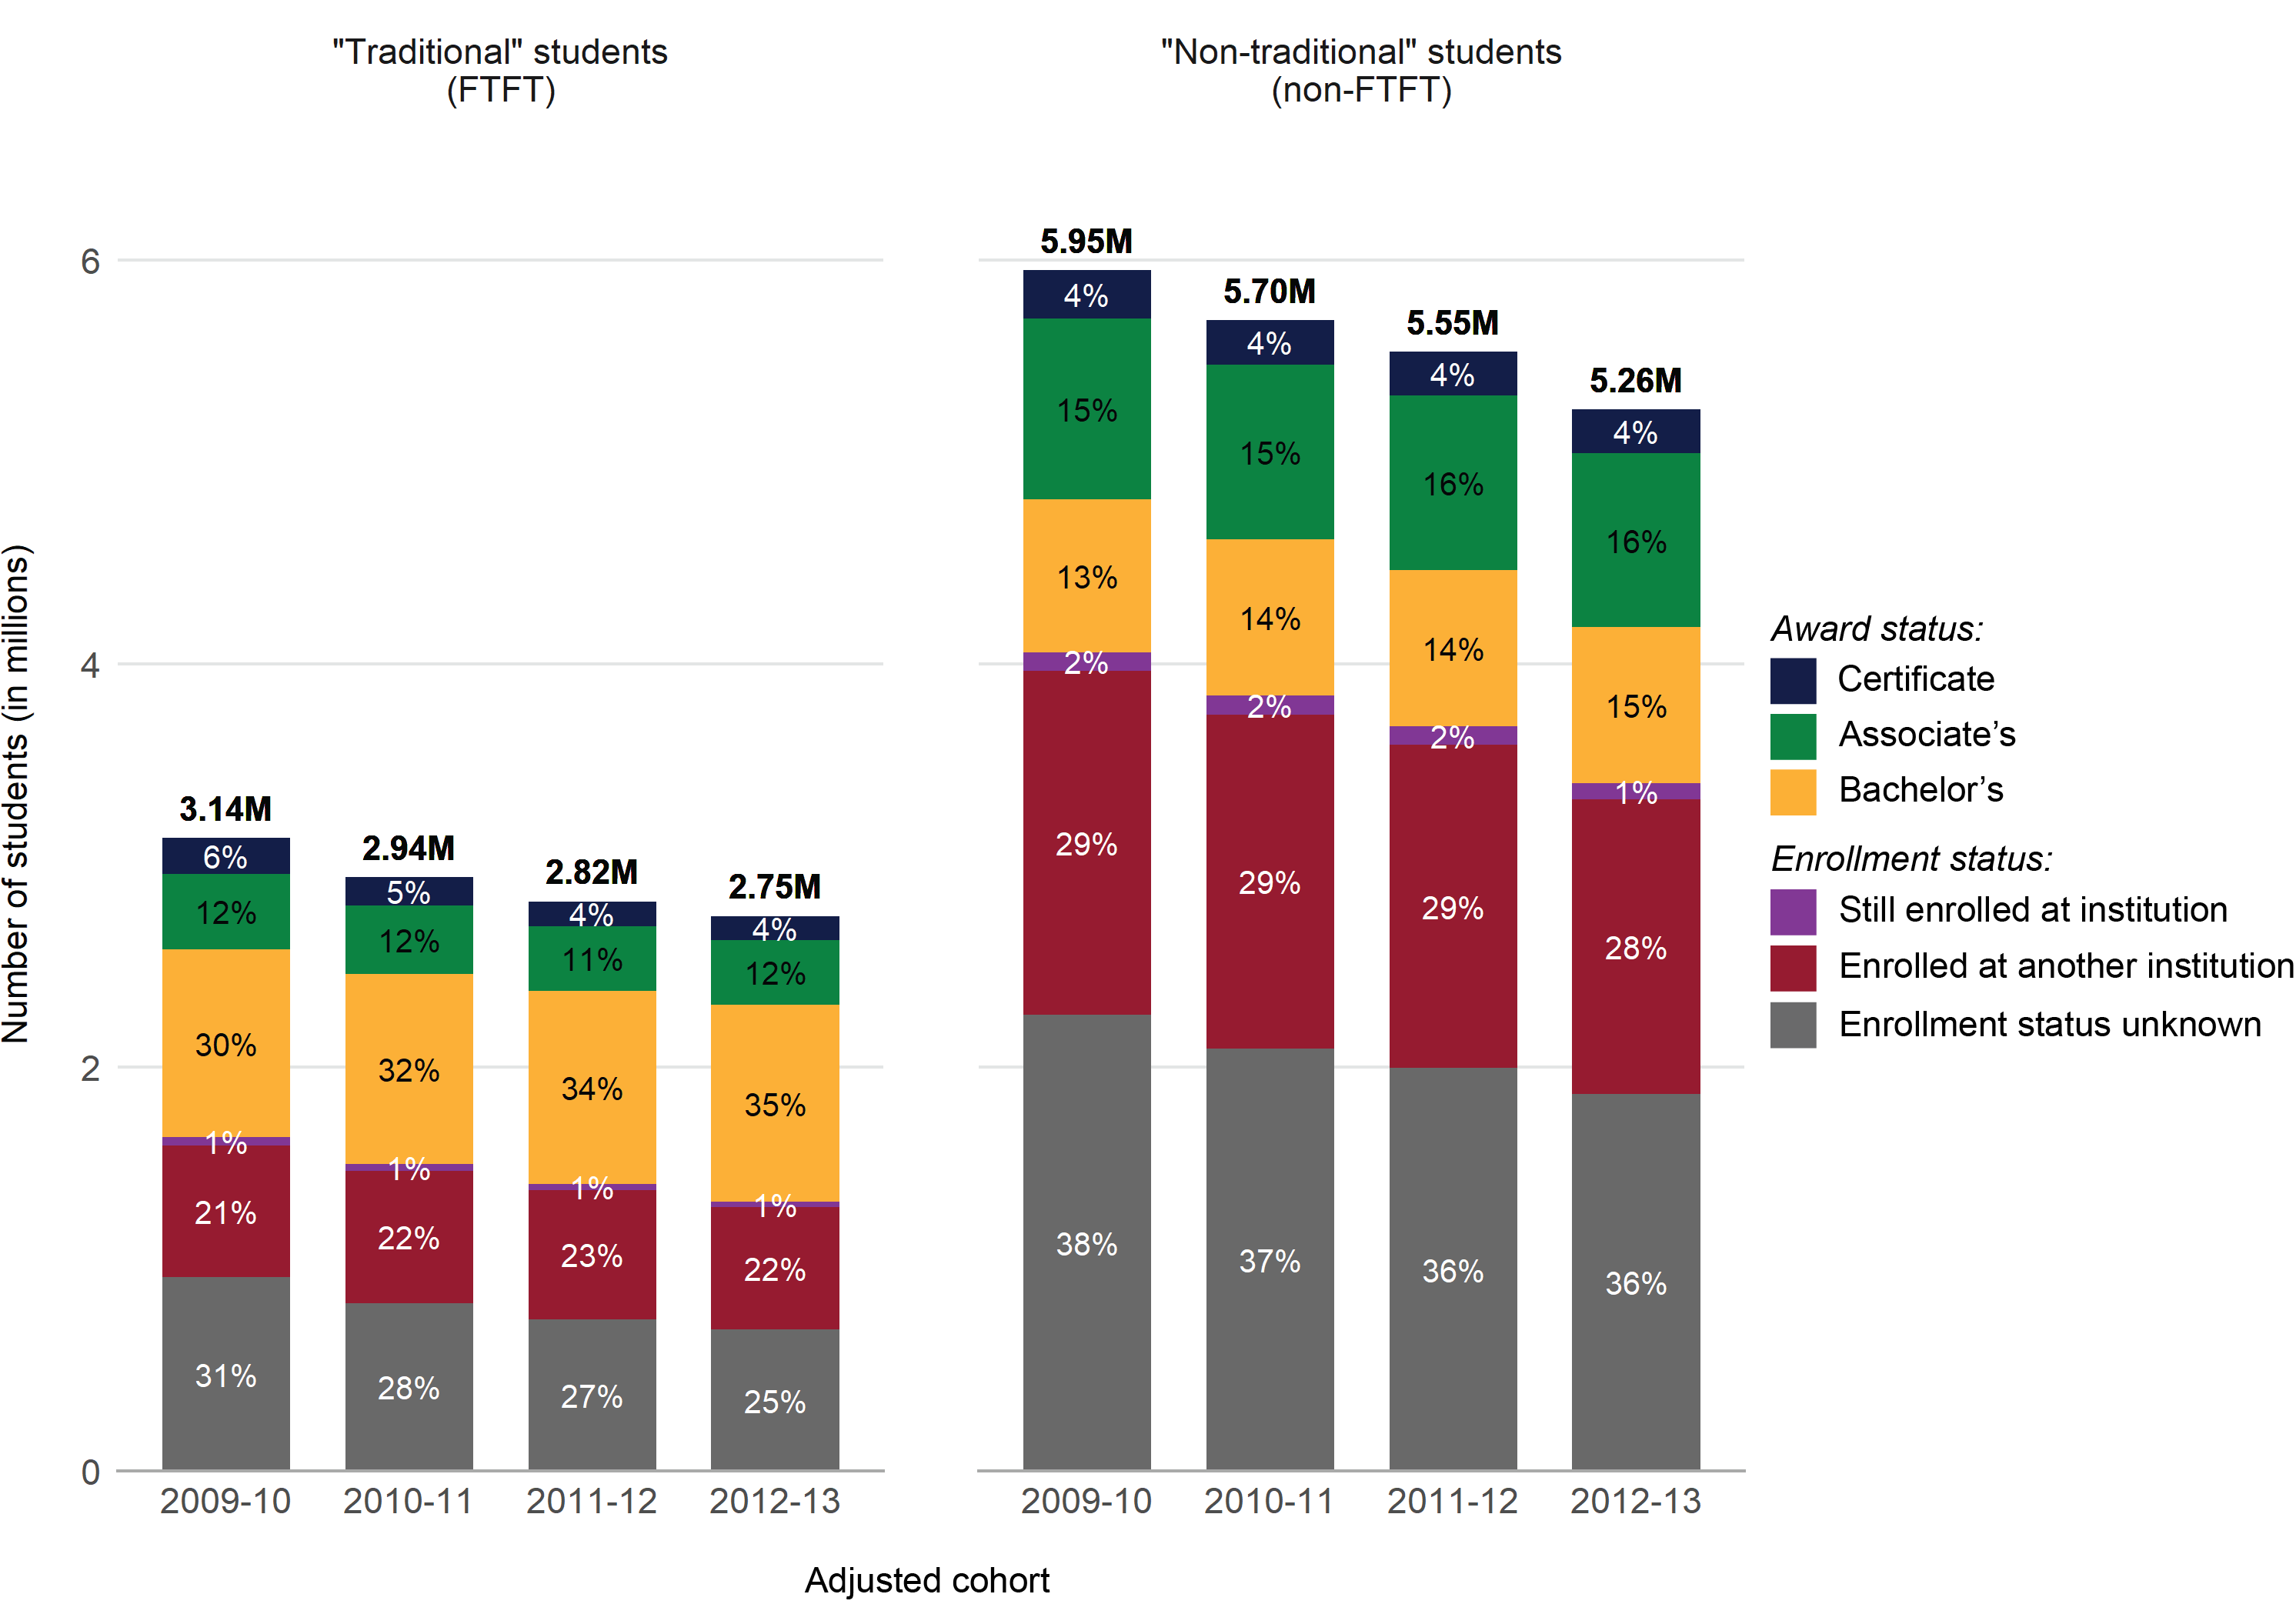
NOTE: This figure presents data collected from Title IV degree-granting institutions in the United States. “Non-traditional” (i.e., non-first-time, full-time) students include first-time, part-time, non-first-time, full-time, and non-first-time, part-time subcohorts. Percentages may not sum to 100 due to rounding.
SOURCE: U.S. Department of Education, National Center for Education Statistics, Integrated Postsecondary Education Data System (IPEDS) Outcome Measures component final data (2017–2019) and provisional data (2020).
To learn more about the IPEDS OM survey component, visit the Measuring Student Success in IPEDS: Graduation Rates (GR), Graduation Rates 200% (GR200), and Outcome Measures (OM) resource page and the OM survey component webpage. Go to the IPEDS Use the Data page to explore IPEDS data through easy-to-use web tools, access data files to conduct your own analyses like those presented in this blog post, or view OM web tables.
By McCall Pitcher, AIR
[1] The Federal Pell Grant Program (Higher Education Act of 1965, Title IV, Part A, Subpart I, as amended) provides grant assistance to eligible undergraduate postsecondary students with demonstrated financial need to help meet education expenses.
[2] Due to the 8-year measurement lag between initial cohort enrollment and student outcome reporting for the Outcome Measures survey component, the most recent cohort for which data are publicly available is 2012–13. Prior to the 2009–10 cohort, OM did not collect cohort subgroups by Pell Grant recipient status. Therefore, this analysis includes data only for the four most recent cohorts.
[3] The 4-year status point was added in the 2017–18 collection.
[4] Data users can explore available institutional variables on the IPEDS Use the Data webpage.
[5] For comparability purposes, this analysis relies on data from the 2017–18 collection (reflecting the 2009–10 adjusted cohort) through the 2020–21 collection (reflecting the 2012–13 adjusted cohort). Prior to the 2017–18 collection, OM cohorts were based on a fall term for academic reporters and a full year for program reporters.