Each year, NCES contributes data and insights to America’s Children: Key National Indicators of Well-Being, an annual report produced by the Federal Interagency Forum on Child and Family Statistics. The Forum assembles 23 federal agencies to collaboratively present the public with policy-relevant statistics related to America’s children and their families.
The 2020 edition of America’s Children in Brief examines indicators of children’s well-being in the following domains: demographic background, family and social environment, economic circumstances, health care, physical environment and safety, behavior, education, and health. This year’s report has a special focus on differences by metropolitan status,[1] giving readers a closer look at how measures of well-being vary based on the type of community in which children and their families live.
For example, the report includes information and federal data about birth rates among adolescent mothers, adolescent alcohol use, and adolescent depression and how these data vary by geographic area. Some key highlights of these topics are below:
- The birth rate among females ages 15–19 was 17 per 1,000 in 2018.
- The birth rate was highest for adolescents living in rural counties (26 per 1,000), followed by those living in micropolitan counties (24 per 1,000) and metropolitan counties (16 per 1,000).
- In 2019, 4 percent of 8th-, 9 percent of 10th-, and 14 percent of 12th-grade students reported binge drinking.
- Binge drinking was reported by 18 percent of 12th-grade students living in nonmetropolitan areas compared with 14 percent of 12th-grade students living in metropolitan areas.
- In 2018, 14 percent of the population ages 12–17 had at least one major depressive episode during the past year.
- This percentage did not differ by metropolitan status (14 percent in metropolitan areas, 15 percent in micropolitan areas, and 13 percent in rural areas).
The 2020 edition also presents new NCES data on differences in high school completion rates by metropolitan status. Many entry-level jobs and colleges/universities require applicants to produce a high school diploma or its equivalent. Thus, measuring how high school completion rates vary across time and for different groups of students is important since they are strongly related to future income.[2]
In 2018, among young adults ages 18–24 who lived in metropolitan areas, 94 percent had completed high school with a diploma or an alternative credential, such as a GED certificate (figure 1). This rate was higher than the 89 percent completion rate for young adults living in nonmetropolitan areas. Furthermore, the high school completion rate for young adults who lived in metropolitan areas increased from 91 percent in 2010 to 94 percent in 2018. The completion rate for young adults who lived in nonmetropolitan areas was not measurably different between these two years (88 percent in 2010 and 89 percent in 2018).
Figure 1. Percentage of young adults ages 18–24 who have completed high school, by metropolitan status: 2010 and 2018
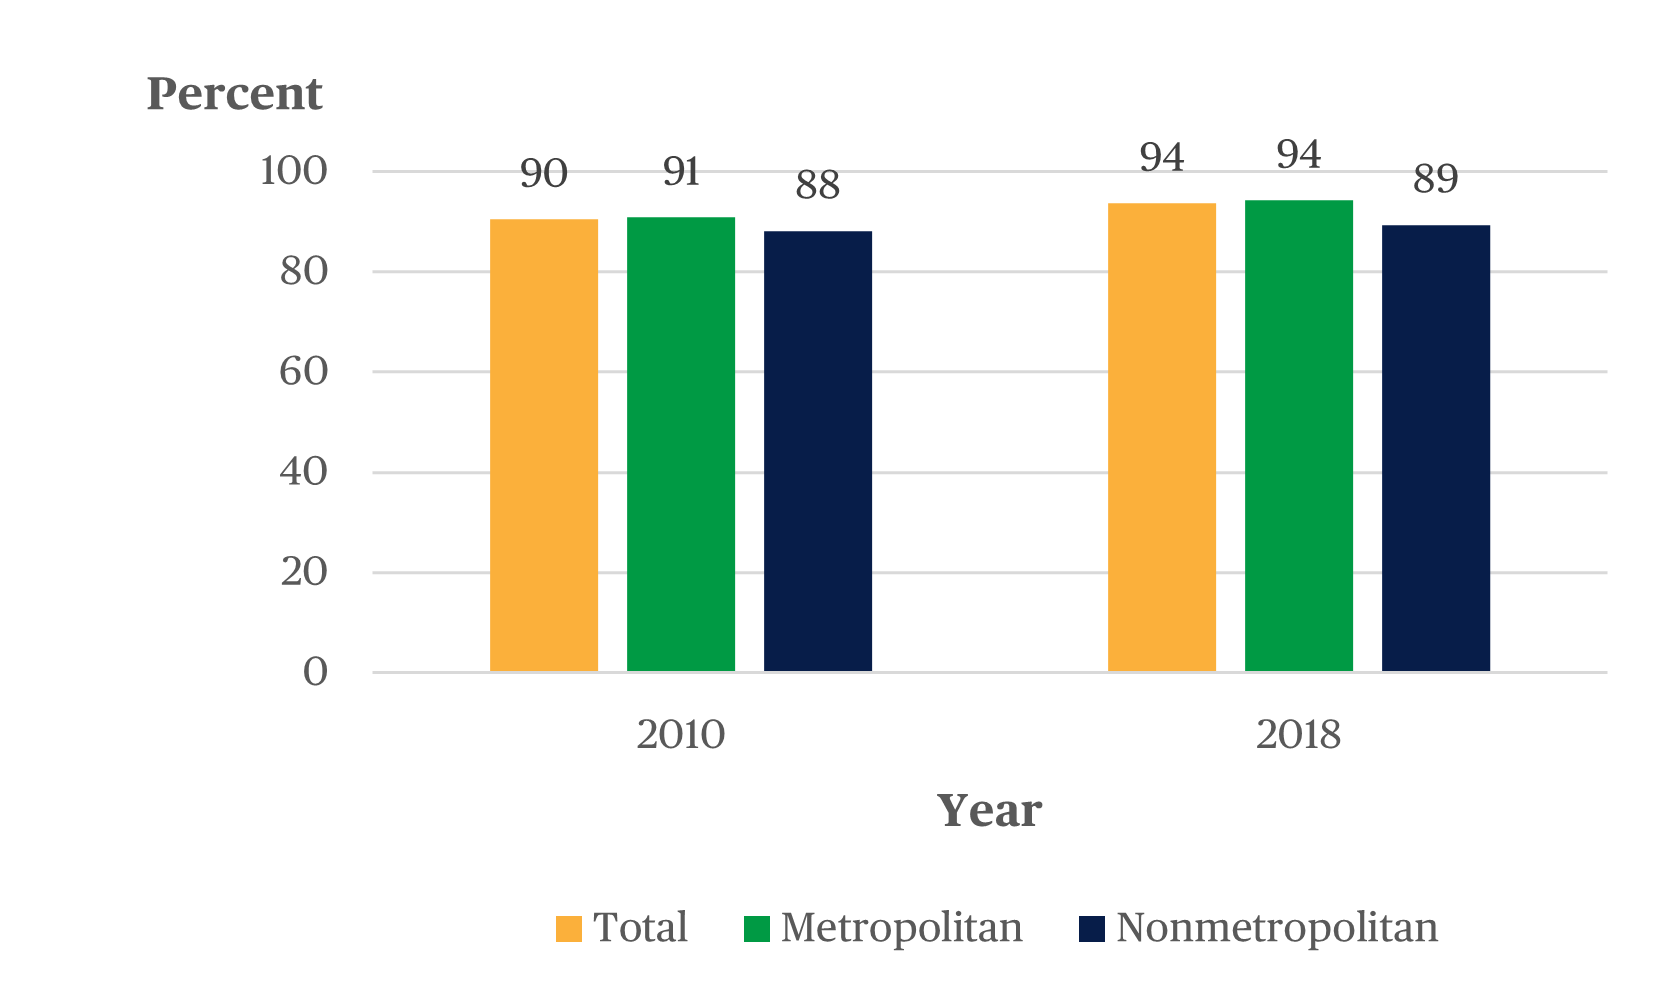
NOTE: Diploma equivalents include alternative credentials obtained by passing examinations such as the General Educational Development (GED) test. This figure excludes those still enrolled in high school or enrolled in a lower education level. The U.S. Office of Management and Budget classifies some counties as within a metropolitan statistical area. The remaining counties are considered nonmetropolitan. Nonmetropolitan counties include counties in micropolitan statistical and rural areas. Total includes those whose household metropolitan status was “not identified,” which is not separately shown.
SOURCE: U.S. Census Bureau, Current Population Survey, School Enrollment Supplement.
With the 2020 publication of America’s Children in Brief, the Forum continues two decades of collaboration among agencies across the federal government to advance readers’ understanding of children and youth throughout the country.
To access to the full report that examines these differences in more detail, visit childstats.gov. Be sure to follow the Forum on Twitter @childstats to keep up with Forum activities, and check back next year for new insights into America’s children from reliable federal statistical agencies like NCES.
By Amanda Dean, AIR
[1] For information about how metropolitan status is defined in this report, read the “Geographic Classifications” section in the introduction to the report.