NCES Blog

National Center for Education Statistics

Measuring “Traditional” and “Non-Traditional” Student Success in IPEDS: Data Insights from the IPEDS Outcome Measures (OM) Survey Component

This blog post is the second in a series highlighting the Integrated Postsecondary Education Data System (IPEDS) Outcome Measures (OM) survey component. The first post introduced a new resource page that helps data reporters and users understand OM and how it compares to the Graduation Rates (GR) and Graduation Rates 200% (GR200) survey components. Using data from the OM survey component, this post provides key findings about the demographics and college outcomes of undergraduates in the United States and is designed to spark further study of student success using OM data.

What do Outcome Measures cohorts look like?

OM collects student outcomes for all entering degree/certificate-seeking undergraduates, including non-first-time (i.e., transfer-in) and part-time students. Students are separated into eight subcohorts by entering status (i.e., first-time or non-first-time), attendance status (i.e., full-time or part-time), and Pell Grant recipient status.1 Figure 1 shows the number and percentage distribution of degree/certificate-seeking undergraduates in each OM subcohort from 2009–10 to 2012–13, by institutional level.2

Key takeaways:

  • Across all cohort years, the majority of students were not first-time, full-time (FTFT) students, a group typically referred to as “traditional” college students. At 2-year institutions, 36 percent of Pell Grant recipients and 16 percent of non-Pell Grant recipients were FTFT in 2012–13. At 4-year institutions, 43 percent of Pell Grant recipients and 44 percent of non-Pell Grant recipients were FTFT in 2012–13.
  • Pell Grant recipient cohorts have become less “traditional” over time. In 2012–13, some 36 percent of Pell Grant recipients at 2-year institutions were FTFT, down 5 percentage points from 2009–10 (41 percent). At 4-year institutions, 43 percent of Pell Grant recipients were FTFT in 2012–13, down 5 percentage points from 2009–10 (48 percent).

Figure 1. Number and percentage distribution of degree/certificate-seeking undergraduate students in the adjusted cohort, by Pell Grant recipient status, institutional level, and entering and attendance status: 2009–10 to 2012–13 adjusted cohorts

Stacked bar chart showing the number and percentage distribution of degree/certificate-seeking undergraduate students by Pell Grant recipient status (recipients and non-recipients), institutional level (2-year and 4-year), and entering and attendance status (first-time/full-time, first-time/part-time, non-first-time/full-time, and non-first-time/part-time) for 2009–10 to 2012–13 adjusted cohorts

NOTE: This figure presents data collected from Title IV degree-granting institutions in the United States. Percentages may not sum to 100 due to rounding.

SOURCE: U.S. Department of Education, National Center for Education Statistics, Integrated Postsecondary Education Data System (IPEDS) Outcome Measures component final data (2017­–19) and provisional data (2020).


What outcomes does Outcome Measures collect?

The OM survey component collects students’ highest credential earned (i.e., certificate, associate’s, or bachelor’s) at 4,3 6, and 8 years after entry. Additionally, for students who did not earn a credential by the 8-year status point, the survey component collects an enrollment status outcome (i.e., still enrolled at the institution, enrolled at another institution, or enrollment status unknown). Figure 2 shows these outcomes for the 2012–13 adjusted cohort.

Key takeaways:

  • The percentage of students earning an award (i.e., certificate, associate’s, or bachelor’s) was higher at each status point, with the greatest change occurring between the 4- and 6-year status points (a 7-percentage point change, from 32 percent to 39 percent).
  • At the 8-year status point, more than a quarter of students were still enrolled in higher education: 26 percent had “transferred-out” to enroll at another institution and 1 percent were still enrolled at their original institution. This enrollment status outcome fills an important gap left by the GR200 survey component, which does not collect information on students who do not earn an award 8 years after entry.

Figure 2. Number and percentage distribution of degree/certificate-seeking undergraduate students, by award and enrollment status and entry status point: 2012–13 adjusted cohort

Waffle chart showing award status (certificate, associate’s, bachelor’s, and did not receive award) and enrollment status (still enrolled at institution, enrolled at another institution, and enrollment status unknown) of degree/certificate-seeking undergraduate students, by status point (4-year, 6-year, and 8-year) for 2012–13 adjusted cohort

NOTE: One square represents 1 percent. This figure presents data collected from Title IV degree-granting institutions in the United States.

SOURCE: U.S. Department of Education, National Center for Education Statistics, Integrated Postsecondary Education Data System (IPEDS) Outcome Measures component provisional data (2020).


How do Outcome Measures outcomes vary across student subgroups?

Every data element collected by the OM survey component (e.g., cohort counts, outcomes by time after entry) can be broken down into eight subcohorts based on entering, attendance, and Pell Grant recipient statuses. In addition to these student characteristics, data users can also segment these data by key institutional characteristics such as sector, Carnegie Classification, special mission (e.g., Historically Black College or University), and region, among others.4 Figure 3 displays the status of degree/certificate-seeking undergraduates 8 years after entry by each student subcohort within the broader 2012–13 degree/certificate-seeking cohort.

Key takeaways:

  • Of the eight OM subcohorts, FTFT non-Pell Grant recipients had the highest rate of earning an award or still being enrolled 8 years after entry. Among this subcohort, 18 percent had an unknown enrollment status 8 years after entry.
  • Among both Pell Grant recipients and non-Pell Grant recipients, full-time students had a higher rate than did part-time students of earning an award or still being enrolled 8 years after entry.
  • First-time, part-time (FTPT) students had the lowest rate of the subcohorts of earning a bachelor’s degree. One percent of FTPT Pell Grant recipients and 2 percent of FTPT non-Pell Grant recipients had earned a bachelor’s degree by the 8-year status point.

Figure 3. Number and percentage distribution of degree/certificate-seeking undergraduate students 8 years after entry, by Pell Grant Recipient status, entering and attendance status, and award and enrollment status: 2012–13 adjusted cohort

Horizontal stacked bar chart showing award (certificate, associate’s, and bachelor’s) and enrollment statuses (still enrolled at institution, enrolled at another institution, and enrollment status unknown) of degree/certificate-seeking undergraduate students by Pell Grant recipient status (recipients and non-recipients), institutional level (2-year and 4-year), and entering and attendance status (first-time/full-time, first-time/part-time, non-first-time/full-time, and non-first-time/part-time) for 2012–13 adjusted cohort


NOTE: This figure presents data collected from Title IV degree-granting institutions in the United States. Percentages may not sum to 100 due to rounding.

SOURCE: U.S. Department of Education, National Center for Education Statistics, Integrated Postsecondary Education Data System (IPEDS) Outcome Measures component provisional data (2020).


How do Outcome Measures outcomes vary over time?

OM data are comparable across 4 cohort years.5 Figure 4 shows outcomes of degree/certificate-seeking undergraduates 8 years after entry from the 2009–10 cohort through the 2012–13 cohort for so-called “traditional” (i.e., FTFT) and “non-traditional” (i.e., non-FTFT) students.

Key takeaways:

  • For both traditional and non-traditional students, the percentage of students earning an award was higher for the 2012–13 cohort than for the 2009–10 cohort, climbing from 47 percent to 51 percent for traditional students and from 32 percent to 35 percent for non-traditional students.
  • The growth in award attainment for traditional students was driven by the share of students earning bachelor’s degrees (30 percent for the 2009–10 cohort vs. 35 percent for the 2012–13 cohort).
  • The growth in award attainment for non-traditional students was driven by the share of students earning both associate’s degrees (15 percent for the 2009–10 cohort vs. 16 percent for the 2012–13 cohort) and bachelor’s degrees (13 percent for the 2009–10 cohort vs. 15 percent for the 2012–13 cohort).

Figure 4. Number and percentage distribution of degree/certificate-seeking undergraduate students 8 years after entry, by first-time, full-time (FTFT) status and award and enrollment status: 2009–10 to 2012–13 adjusted cohorts

Stacked bar chart showing award status (certificate, associate’s, and bachelor’s) and enrollment status (still enrolled at institution, enrolled at another institution, and enrollment status unknown) of degree/certificate-seeking undergraduate students 8 years after entry by first-time, full-time status (traditional or first-time, full-time students and non-traditional or non-first-time, full-time students) for 2009–10 to 2012–13 adjusted cohorts

NOTE: This figure presents data collected from Title IV degree-granting institutions in the United States. “Non-traditional” (i.e., non-first-time, full-time) students include first-time, part-time, non-first-time, full-time, and non-first-time, part-time subcohorts. Percentages may not sum to 100 due to rounding.

SOURCE: U.S. Department of Education, National Center for Education Statistics, Integrated Postsecondary Education Data System (IPEDS) Outcome Measures component final data (2017–2019) and provisional data (2020).


To learn more about the IPEDS OM survey component, visit the Measuring Student Success in IPEDS: Graduation Rates (GR), Graduation Rates 200% (GR200), and Outcome Measures (OM) resource page and the OM survey component webpage. Go to the IPEDS Use the Data page to explore IPEDS data through easy-to-use web tools, access data files to conduct your own analyses like those presented in this blog post, or view OM web tables.  

By McCall Pitcher, AIR


[1] The Federal Pell Grant Program (Higher Education Act of 1965, Title IV, Part A, Subpart I, as amended) provides grant assistance to eligible undergraduate postsecondary students with demonstrated financial need to help meet education expenses.

[2] Due to the 8-year measurement lag between initial cohort enrollment and student outcome reporting for the Outcome Measures survey component, the most recent cohort for which data are publicly available is 2012–13. Prior to the 2009–10 cohort, OM did not collect cohort subgroups by Pell Grant recipient status. Therefore, this analysis includes data only for the four most recent cohorts.

[3] The 4-year status point was added in the 2017–18 collection.

[4] Data users can explore available institutional variables on the IPEDS Use the Data webpage.

[5] For comparability purposes, this analysis relies on data from the 2017–18 collection (reflecting the 2009–10 adjusted cohort) through the 2020–21 collection (reflecting the 2012–13 adjusted cohort). Prior to the 2017–18 collection, OM cohorts were based on a fall term for academic reporters and a full year for program reporters.

Introducing a New Resource Page for the IPEDS Outcome Measures (OM) Survey Component

The National Center for Education Statistics (NCES) has introduced a new resource page for the Integrated Postsecondary Education Data System (IPEDS) Outcome Measures (OM) survey component. This blog post provides an overview of the webpage and is the first in a series of blog posts that will showcase OM data.

Measuring Student Success in IPEDS: Graduation Rates (GR), Graduation Rates 200% (GR200), and Outcome Measures (OM) is a new resource page designed to help data reporters and users better understand the value of OM data and how the OM survey component works, particularly when compared with the Graduation Rates (GR) and Graduation Rates 200% (GR200) survey components.

The OM survey component was added to IPEDS in 2015–16 in an effort to capture postsecondary outcomes for more than so-called “traditional” college students. From 1997–98 to 2015–16, IPEDS graduation rate data were collected only for first-time, full-time (FTFT) degree/certificate-seeking (DGCS) undergraduates through the GR and GR200 survey components. Unlike these survey components, OM collects student outcomes for all entering DGCS undergraduates, including non-first-time students (i.e., transfer-in students) and part-time students.

Outcome measures are useful as characteristics of students vary by the level of institution. In 2009, some 4.7 million students began at 2-year postsecondary institutions, and 25 percent were full-time students who were attending college for the first time. During the same period, some 4.5 million students began at 4-year institutions, and 44 percent were first-time, full-time students.1

The new resource page answers several important questions about OM, GR, and GR200, including the following:

  • Which institutions complete each survey component?
  • Does the survey form vary by institutional type?
  • What student success measures are included?
  • Which students are included in the cohort?
  • What is the timeframe for establishing student cohorts?
  • Which subgroups (disaggregates) are included?
  • What is the timing of data collection and release?

In answering these questions, the resource page highlights that OM provides a more comprehensive view of student success than do GR and GR200. Furthermore, it suggests that OM, GR, and GR200 are not directly comparable, as the survey components differ in terms of which institutions complete them, which students are captured, and how each measures cohorts. Here are some of the key differences:

  • Institutions with FTFT cohorts complete the GR and GR200 components, whereas degree-granting institutions complete the OM component.
  • GR and GR200 include only FTFT DGCS undergraduates, whereas OM includes all DGCS undergraduates.
  • GR and GR200 cohorts are based on a fall term for academic reports and a full year (September 1–August 31) for program reporters, whereas OM cohorts are based on a full year (July 1–June 30) for all degree-granting institutions.

Finally, the resource page outlines how OM works, including how cohorts and subcohorts are established, which outcomes are collected at various status points, and when the public have access to submitted data. Exhibit 1 presents the current 2021–22 data collection timeline, including the cohort year, outcome status points, data collection period, and public release of OM data.


Exhibit 1. 2021­–22 Outcome Measures (OM) data collection timeline (2013–14 entering degree/certificate-seeking cohort)

Infographic showing the 2020—21 OM data collection timeline, including the cohort year, outcome status points, data collection period, and public release of OM data


Data reporters and users are encouraged to utilize the new OM survey component resource page to better understand the scope of OM, how it works, and how it differs from GR and GR200. Stay tuned for a follow-up blog post featuring data from OM that further highlights the survey component’s usefulness in measuring student success for all DGCS undergraduate students.


By Tara Lawley, NCES; Roman Ruiz, AIR; Aida Ali Akreyi, AIR; and McCall Pitcher, AIR


[1] U.S. Department of Education, National Center for Education Statistics, Integrated Postsecondary Education Data System (IPEDS), Winter 2017–18, Outcome Measures component; and IPEDS Fall 2009, Institutional Characteristics component. See Digest of Education Statistics 2018, table 326.27.

The “Where” of Going to College: Residence, Migration, and Fall Enrollment

Newly released provisional data from the Integrated Postsecondary Education Data System’s (IPEDS) Fall Enrollment (EF) survey provides an updated look at whether beginning college students are attending school in their home state or heading elsewhere.  

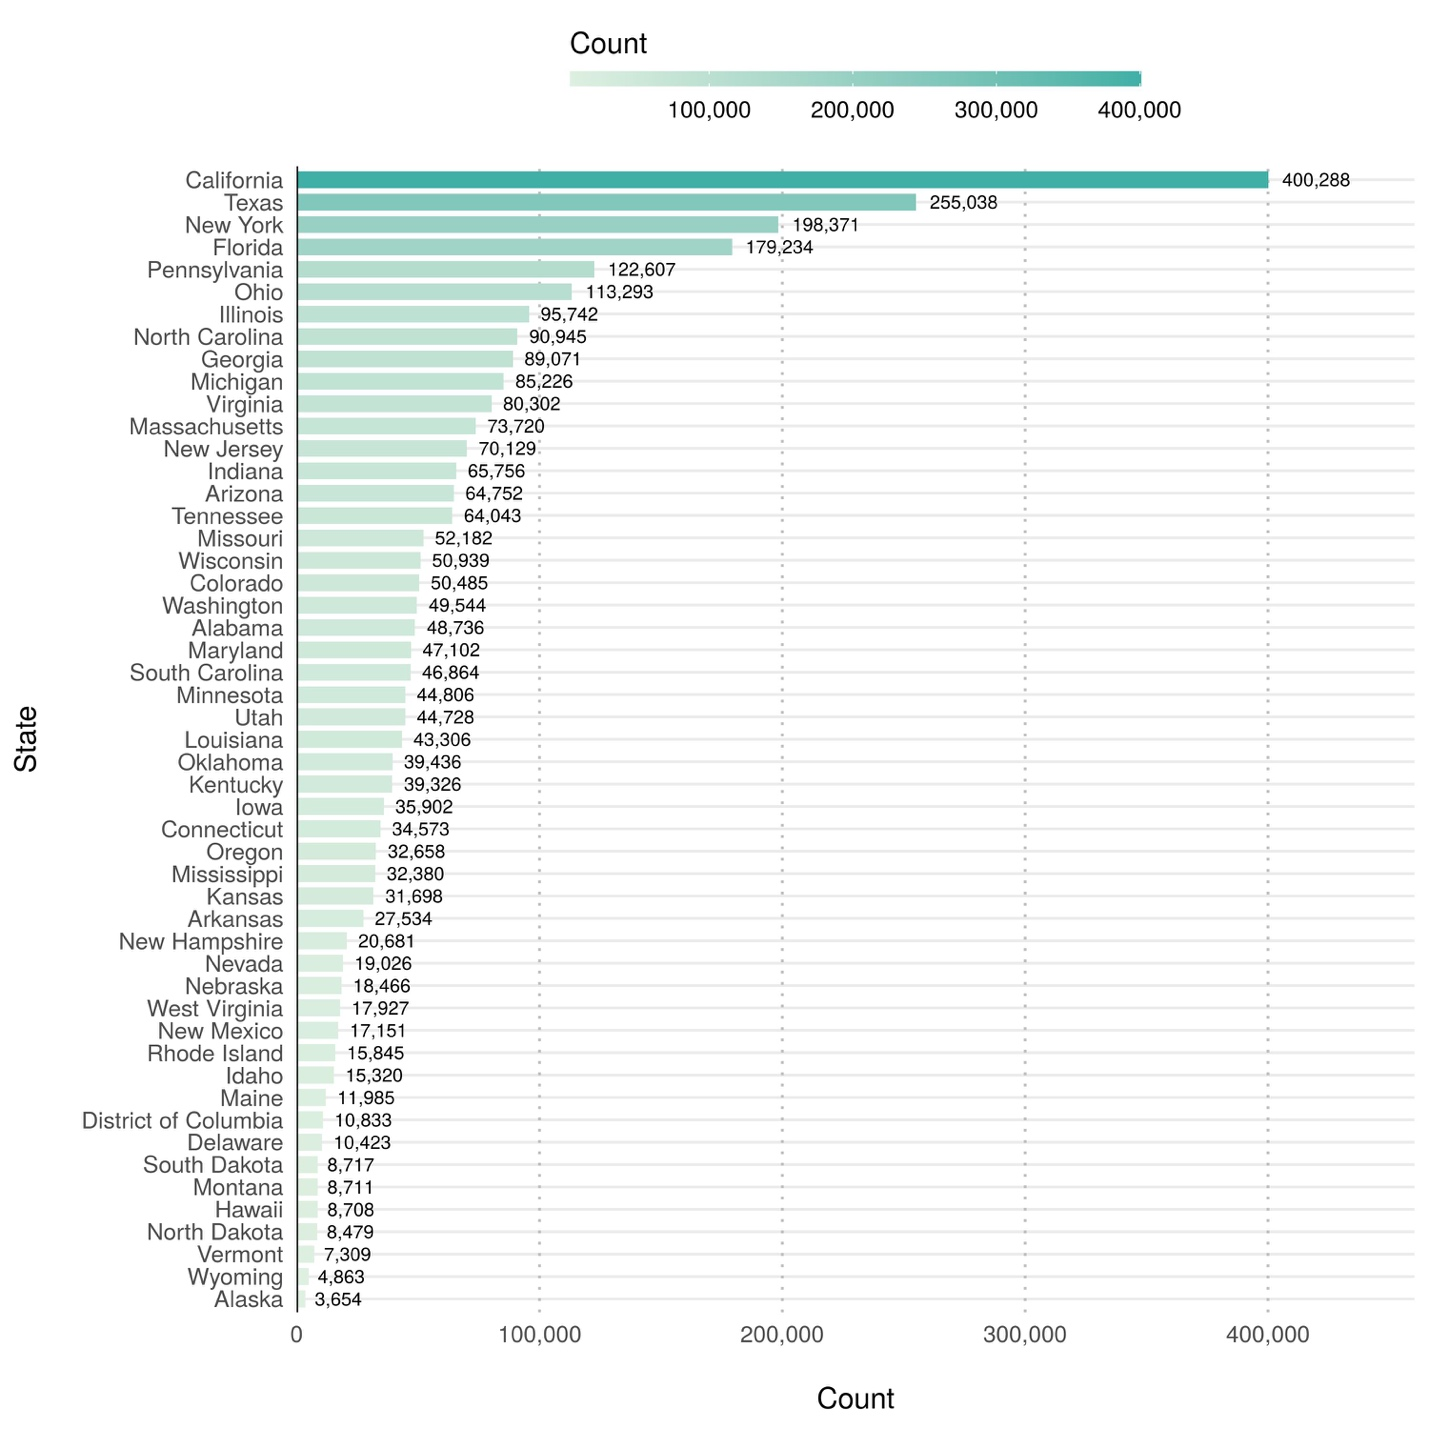
In fall 2018, the number of first-time degree/certificate-seeking students enrolled at Title IV postsecondary institutions (beginning college students) varied widely across states, ranging from 3,700 in Alaska to 400,300 in California (figure 1). College enrollment is strongly correlated with the number of postsecondary institutions within each state, as more populous and geographically large states have more institutional capacity to enroll more students. Most states (32 out of 50) and the District of Columbia enrolled fewer than 50,000 beginning college students in fall 2018 and only six states (California, Texas, New York, Florida, Pennsylvania, and Ohio) enrolled more than 100,000 beginning college students.


Figure 1. Number of first-time degree/certificate-seeking undergraduate students enrolled at Title IV institutions, by state or jurisdiction: Fall 2018SOURCE: U.S. Department of Education, National Center for Education Statistics, IPEDS, Spring 2019, Fall Enrollment component (provisional data).

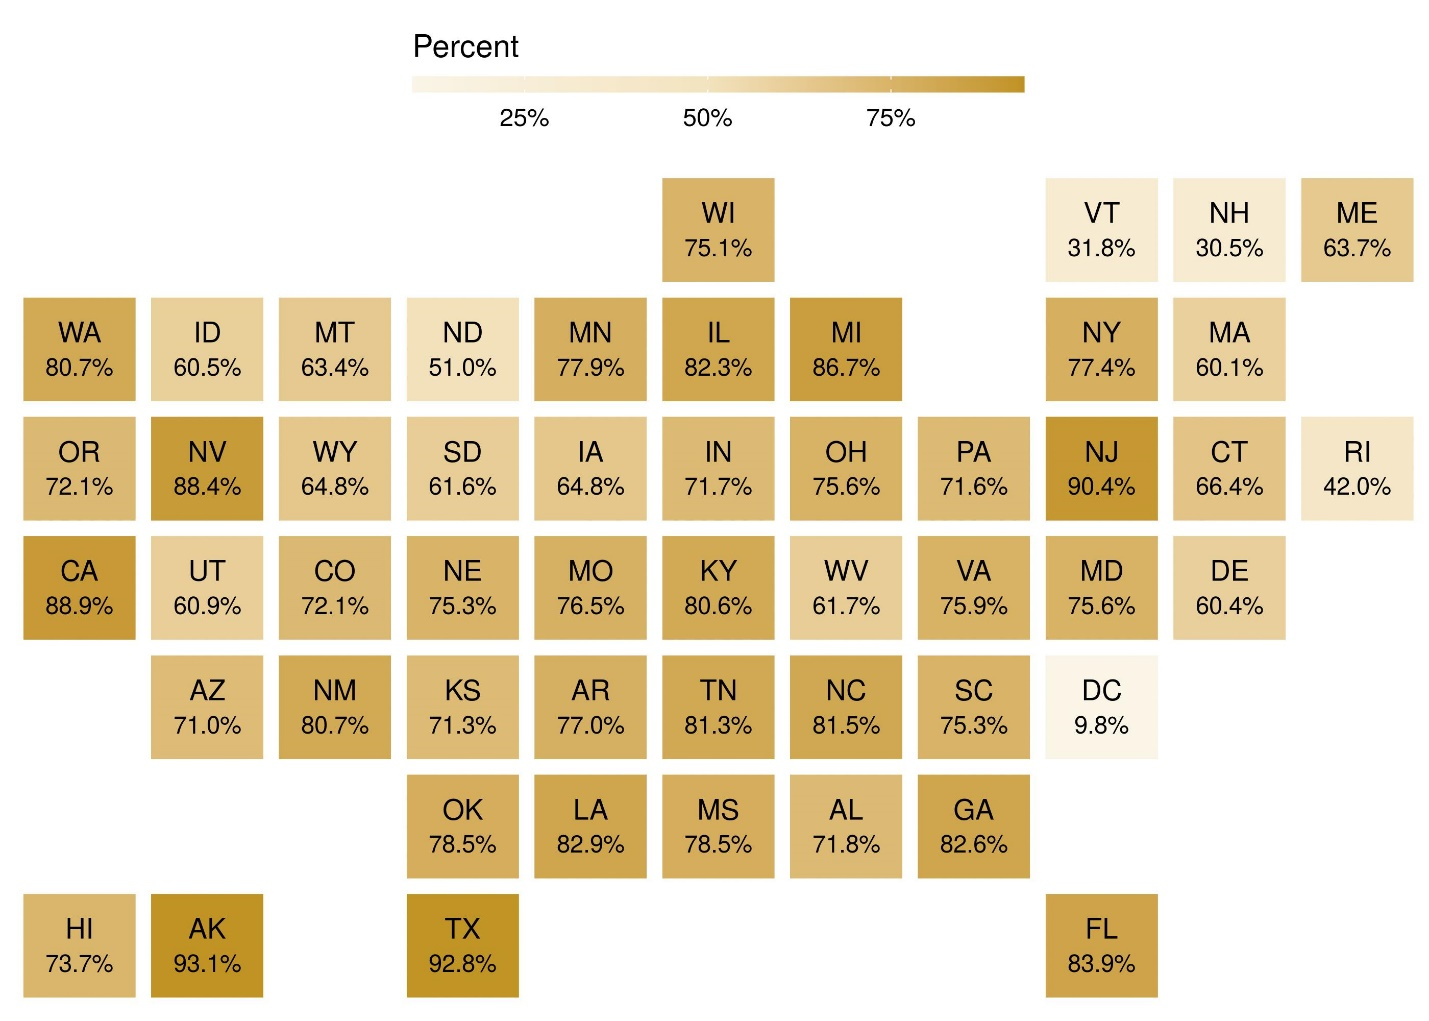
As a result of students migrating outside their home states to attend college, some postsecondary institutions enroll students who are not residents of the same state or jurisdiction in which it is located. Among beginning college students in fall 2018, the share of students who were residents of the same state varied widely, from 31 percent in New Hampshire to 93 percent in Texas and Alaska (figure 2). For a majority of states (27 out of 50), residents comprised at least 75 percent of total beginning college student enrollment. Only three states (Rhode Island, Vermont, and New Hampshire) and the District of Columbia enrolled more nonresidents than residents among their fall 2018 beginning college students.


Figure 2. Percent of first-time degree/certificate-seeking undergraduate students enrolled at Title IV institutions in the state or jurisdiction who are residents of the same state or jurisdiction: Fall 2018
SOURCE: U.S. Department of Education, National Center for Education Statistics, IPEDS, Spring 2019, Fall Enrollment component (provisional data).


States experience varying levels of out-migration (i.e., residents leaving the state to attend college) and in-migration (i.e., nonresidents coming into the state to attend college). For example, in fall 2018, California experienced the largest number of residents out-migrating to attend college in a different state (44,800) but gained 37,800 nonresidents in-migrating to attend college in the state, for an overall negative net migration of beginning college students (figure 3). In contrast, New York also experienced a large number of residents out-migrating for college (33,800) but gained 43,300 nonresidents, for an overall positive net migration of beginning college students.


Figure 3. Number of first-time degree/certificate-seeking undergraduate students at Title IV institutions who migrate into and out of the state or jurisdiction: Fall 2018
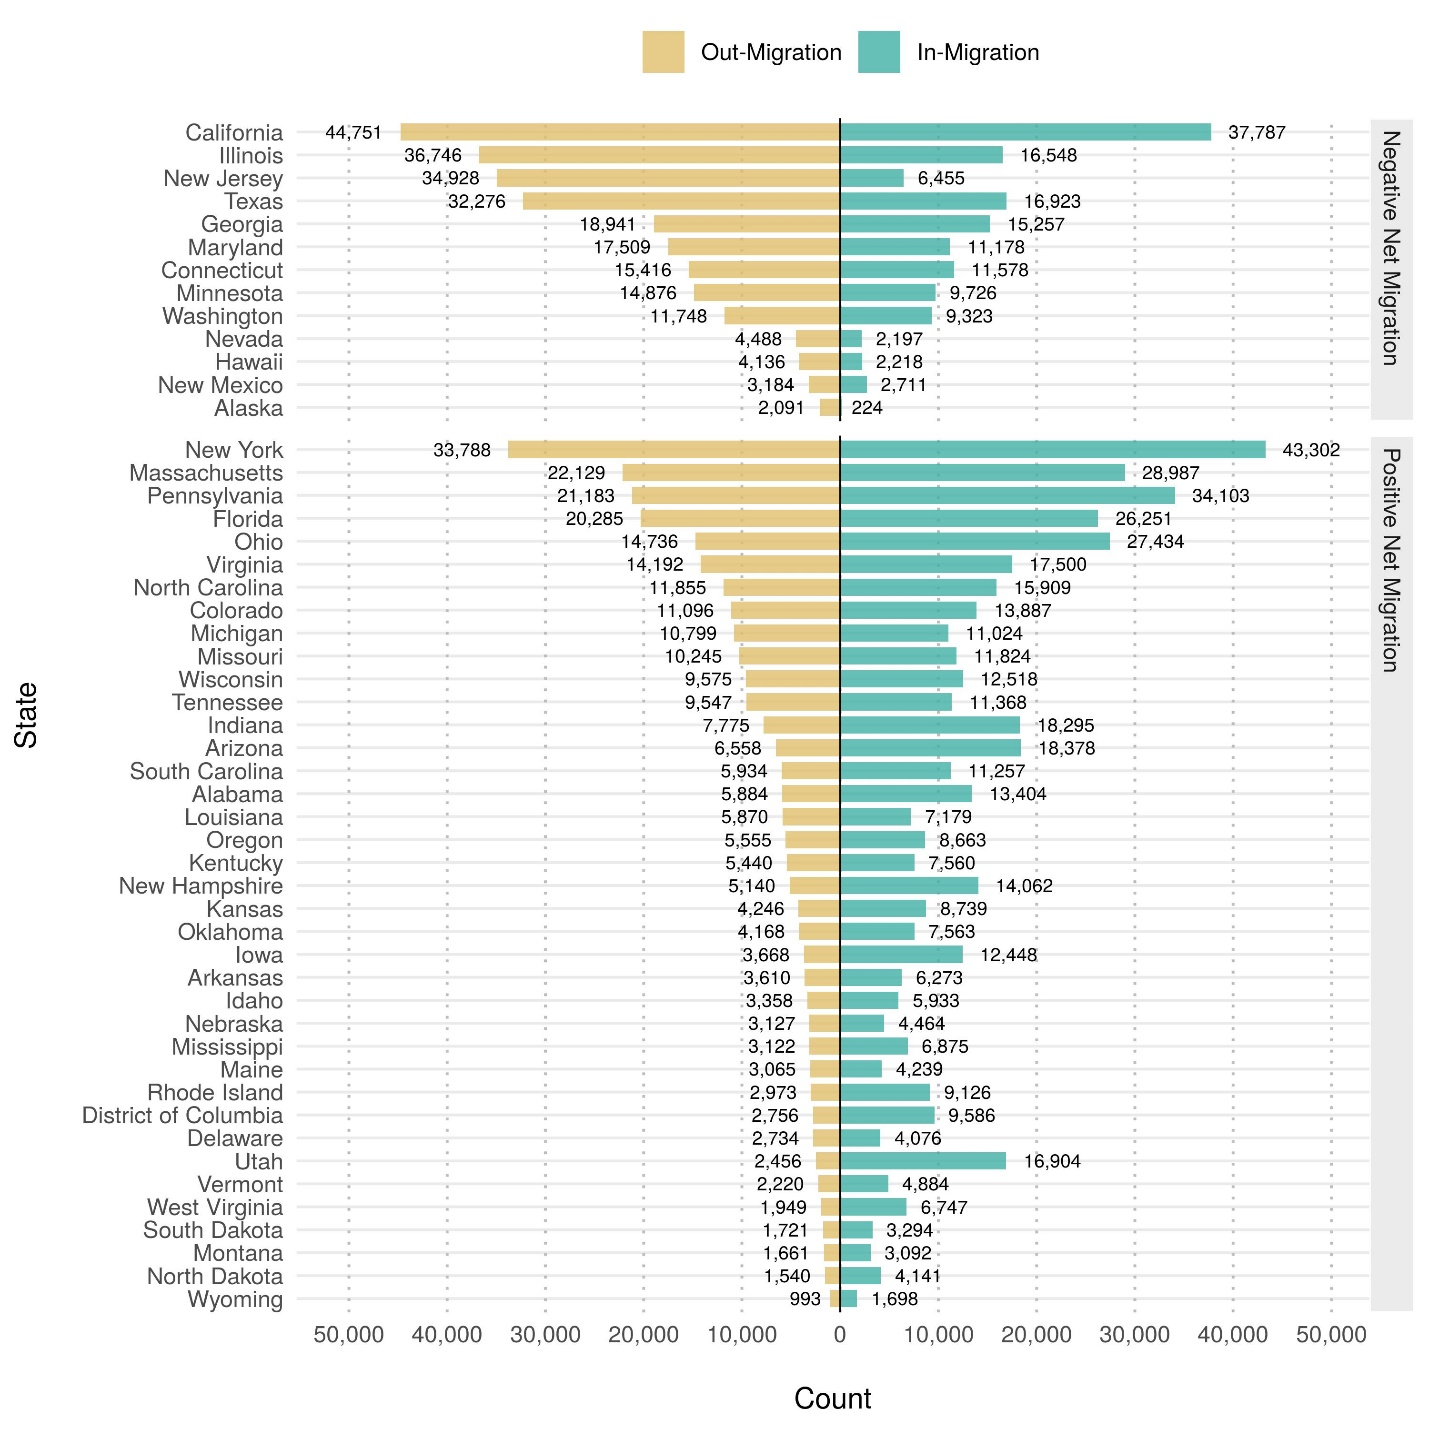
NOTE: The migration of students refers to students whose permanent address at the time of application to the institution is located in a different state or jurisdiction than the institution. Migration does not indicate a permanent change of address has occurred. Migration into the state or jurisdiction may include students who are nonresident aliens, who are from the other U.S. jurisdictions, or who reside outside the state or jurisdiction and are enrolled exclusively in online or distance education programs. Migration into the state or jurisdiction does not include individuals whose state or jurisdiction of residence is unknown.

SOURCE: U.S. Department of Education, National Center for Education Statistics, IPEDS, Spring 2019, Fall Enrollment component (provisional data).


Approximately three-quarters of states (37 out of 50) and the District of Columbia had a positive net migration of beginning college students in fall 2018 (figure 4). The remaining one-quarter of states (13 out of 50) had more residents out-migrate for college than nonresidents in-migrate for college, resulting in a negative net migration of beginning college students. Net migration varied widely by state, with New Jersey experiencing the largest negative net migration (28,500 students) and Utah experiencing the largest positive net migration (14,400 students).


Figure 4. Net migration of first-time degree/certificate-seeking undergraduate students at Title IV institutions, by state or jurisdiction: Fall 2018
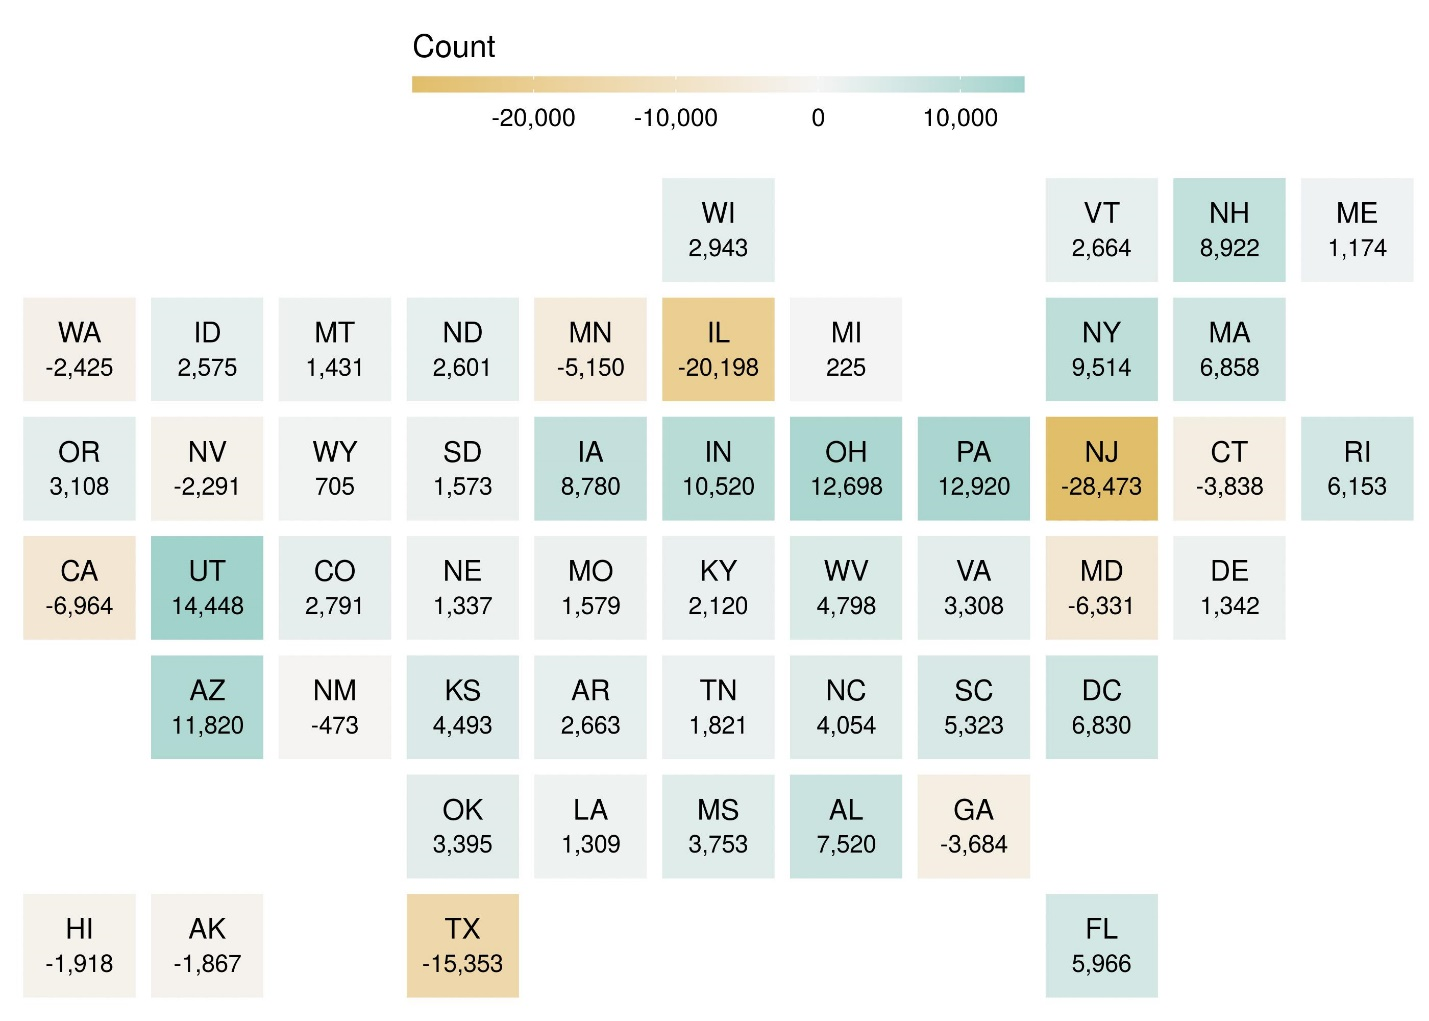
NOTE: Net migration is the difference between the number of students entering the state or jurisdiction to attend school (into) and the number of students (residents) who leave the state or jurisdiction to attend school elsewhere (out of). A positive net migration indicates more students coming into the state or jurisdiction than leaving to attend school elsewhere.

SOURCE: U.S. Department of Education, National Center for Education Statistics, IPEDS, Spring 2019, Fall Enrollment component (provisional data).


The newly released IPEDS Fall Enrollment data provide tremendous insights into the geographic mobility of beginning college students. Additional analyses on residence and migration can be conducted using the full IPEDS data files. For example, the data can identify to which states and types of institutions beginning college students out-migrate and, conversely, from which states postsecondary institutions recruit their incoming classes.


By Roman Ruiz, AIR

Announcing the Condition of Education 2019 Release

We are pleased to present The Condition of Education 2019, a congressionally mandated annual report summarizing the latest data on education in the United States. This report is designed to help policymakers and the public monitor educational progress. This year’s report includes 48 indicators on topics ranging from prekindergarten through postsecondary education, as well as labor force outcomes and international comparisons.

In addition to the regularly updated annual indicators, this year’s spotlight indicators show how recent NCES surveys have expanded our understanding of outcomes in postsecondary education.

The first spotlight examines the variation in postsecondary enrollment patterns between young adults who were raised in high- and low-socioeconomic status (SES) families. The study draws on data from the NCES High School Longitudinal Study of 2009, which collected data on a nationally representative cohort of ninth-grade students in 2009 and has continued to survey these students as they progress through postsecondary education. The indicator finds that the percentage of 2009 ninth-graders who were enrolled in postsecondary education in 2016 was 50 percentage points larger for the highest SES students (78 percent) than for the lowest SES students (28 percent). Among the highest SES 2009 ninth-graders who had enrolled in a postsecondary institution by 2016, more than three-quarters (78 percent) first pursued a bachelor’s degree and 13 percent first pursued an associate’s degree. In contrast, the percentage of students in the lowest SES category who first pursued a bachelor’s degree (32 percent) was smaller than the percentage who first pursued an associate’s degree (42 percent). In addition, the percentage who first enrolled in a highly selective 4-year institution was larger for the highest SES students (37 percent) than for the lowest SES students (7 percent).

The complete indicator, Young Adult Educational and Employment Outcomes by Family Socioeconomic Status, contains more information about how enrollment, persistence, choice of institution (public, private nonprofit, or private for-profit and 2-year or 4-year), and employment varied by the SES of the family in which young adults were raised.


Among 2009 ninth-graders who had enrolled in postsecondary education by 2016, percentage distribution of students' first credential pursued at first postsecondary institution, by socioeconomic status: 2016

1 Socioeconomic status was measured by a composite score of parental education and occupations and family income in 2009.
NOTE: Postsecondary outcomes are as of February 2016, approximately 3 years after most respondents had completed high school. Although rounded numbers are displayed, the figures are based on unrounded data. Detail may not sum to totals because of rounding.

SOURCE: U.S. Department of Education, National Center for Education Statistics, High School Longitudinal Study of 2009 (HSLS:09), Base Year and Second Follow-up. See Digest of Education Statistics 2018, table 302.44.


The second spotlight explores new data on postsecondary outcomes, including completion and transfer rates, for nontraditional undergraduate students. While the Integrated Postsecondary Education Data System formerly collected outcomes data only for first-time, full-time students, a new component of the survey includes information on students who enroll part time, transfer among institutions, or leave postsecondary education temporarily but later enroll again. These expanded data are particularly important for 2-year institutions, where higher percentages of students are nontraditional. For example, the indicator finds that, among students who started at public 2-year institutions in 2009, completion rates 8 years after entry were higher among full-time students (30 percent for first-time students and 38 percent for non-first-time students) than among part-time students (16 percent for first-time students and 21 percent for non-first-time students). Also at public 2-year institutions, transfer rates 8 years after entry were higher among non-first-time students (37 percent for part-time students and 30 percent for full-time students) than among first-time students (24 percent for both full-time and part-time students).

For more findings, including information on outcomes for nontraditional students at 4-year institutions, read the complete indicator, Postsecondary Outcomes for Nontraditional Undergraduate Students.


Percentage distribution of students' postsecondary outcomes 8 years after beginning at 2-year institutions in 2009, by initial attendance level and status: 2017

# Rounds to zero.
1 Attendance level (first-time or non-first-time student) and attendance status (full-time or part-time student) are based on the first full term (i.e., semester or quarter) after the student entered the institution. First-time students are those who had never attended a postsecondary institution prior to their 2009–10 entry into the reporting institution.
2 Includes certificates, associate’s degrees, and bachelor’s degrees. Includes only those awards that were conferred by the reporting institution (i.e., the institution the student entered in 2009–10); excludes awards conferred by institutions to which the student later transferred.
3 Refers to the percentage of students who were known transfers (i.e., those who notified their initial postsecondary institution of their transfer). The actual transfer rate (including students who transferred, but did not notify their initial institution) may be higher.
4 Includes students who dropped out of the reporting institution and students who transferred to another institution without notifying the reporting institution.
NOTE: The 2009 entry cohort includes all degree/certificate-seeking undergraduate students who entered a degree-granting institution between July 1, 2009, and June 30, 2010. Student enrollment status and completion status are determined as of August 31 of the year indicated; for example, within 8 years after the student’s 2009–10 entry into the reporting institution means by August 31, 2018. Detail may not sum to totals because of rounding. Although rounded numbers are displayed, the figures are based on unrounded data.

SOURCE: U.S. Department of Education, National Center for Education Statistics, Integrated Postsecondary Education Data System (IPEDS), Winter 2017–18, Outcome Measures component; and IPEDS Fall 2009, Institutional Characteristics component. See Digest of Education Statistics 2018, table 326.27.


The Condition of Education includes an At a Glance section, which allows readers to quickly make comparisons within and across indicators, and a Highlights section, which captures key findings from each indicator. The report also contains a Reader’s Guide, a Glossary, and a Guide to Sources that provide additional background information. Each indicator provides links to the source data tables used to produce the analyses.

As new data are released throughout the year, indicators will be updated and made available on The Condition of Education website. In addition, NCES produces a wide range of reports and datasets designed to help inform policymakers and the public. For more information on our latest activities and releases, please visit our website or follow us on TwitterFacebook, and LinkedIn.


By James L. Woodworth, NCES Commissioner

IPEDS Finance Data Reveal How Pension Benefits May Contribute to the Growth of Public Postsecondary Institutions’ Financial Liabilities

In the long-standing conversation of high college costs, ever wonder what public colleges and universities owe? For Fiscal Year (FY) 2017, the National Center for Education Statistics (NCES) using the Integrated Postsecondary Education System (IPEDS) found that 1,624[1] public institutions carried debt and total financial obligations of $451 billion in current dollars (see figure 1).

New finance data from IPEDS can now provide more insight about these obligations than was previously available.

Several common financial obligations or liabilities[2] can be found across all U.S. postsecondary institutions. A portion of an institution’s liabilities can be attributed to pension benefits and contributions (i.e., pension liabilities). Since fiscal year 2015, IPEDS collected data on these obligations as a specific part of the total debt held by public postsecondary institutions.  For example, the total amount of pension benefits and contributions that public institutions owed their employees in FY 2017 was $95 billion (see figure 1).


Before FY 2015, institutions did not have to report to NCES their pension liabilities and the total liabilities for public institutions were $304 billion in FY 2014.  However, after the change in reporting standards, the total liabilities for all public institutions jumped to $395 billion in FY 2015. This increase is greater than increases in all other fiscal years from 2012 to 2017. This finding suggests that the implementation of the new pension reporting standards may have contributed to the change in the increasing trend of total liabilities data.

Reporting Change in Context

Prior to the revised pension reporting standards, dating back to 1997, public institutions reported the difference between their annual required contribution to the pension plan(s) and the actual annual contribution (e.g., net pension obligation). The revised standards—known as Government Accounting Standards Board (GASB) Statements 67 and 68—require institutions to report the entire unfunded pension amount (e.g., net pension liability), not just the amount of deficiency in annual payments.

Including the full current pension liability of the institution instead of the annual shortfall in pension funding of the institution resulted in large shifts in the balance sheet of many public institutions. For example, if an institution had a total of $2 million in pension liabilities, prior to 2015 this institution would not report the $2 million in net pension liabilities, just the amount below the required contribution for that year that was actually paid. Now, this institution must report the full $2 million in net pension liabilities, even if the annual required contribution had been paid in full. This revision of the financial reporting standards resulted in increased transparency and accuracy of the total amount of liabilities reported by institutions.

Additional IPEDS Resources

NCES encourages educational researchers to use IPEDS data—a primary source on U.S. colleges, universities, and technical and vocational institutions. For more information about the IPEDS data, visit the IPEDS Survey Components page.

While finance data from the IPEDS collection may seem to be targeted for accountants and business officers, researchers interested in a postsecondary institution’s financial health can explore through expense and revenue metrics, resulting in possible data-driven, bellwether information. To learn more about an institution’s finance data, in particular its pension benefits, click here for the current finance survey materials; archived changes to the survey materials in 2015–16 (FY 2015)—such as the implementation of the new pension reporting standards; and links to Video Tutorials, FAQs, glossary definitions and other helpful resources.  


 By Bao Le, Aida Ali Akreyi, and Gigi Jones


[1] This total includes 735 four-year public institutions, 889 two-year public institutions, and 63 administrative public system offices (41 four-year and 22 two-year offices). Administrative system offices can report on behalf of their campuses. The four non-Title IV-eligible U.S. service academics are not included.

[2] Liabilities include long-term debts (current and noncurrent) as well as other current and noncurrent liabilities such as pensions, compensated absences, claims and judgments, etc.