In NCES’s recently released Strategic Plan, Goal 3 identifies our commitment to foster and leverage beneficial partnerships. To fulfill that goal, NCES participates in multiple conferences and meetings throughout the year. Recently, NCES participated in the National Historically Black Colleges and Universities (HBCU) Week Conference. NCES’s presentation at this conference helps us to establish a dialogue with HBCUs and develop partnerships to address critical issues in education.
NCES Commissioner Peggy G. Carr kicked off the presentation with an overview of HBCU data—such as student characteristics, enrollment, and financial aid. Then, NCES experts explored how data from various NCES surveys can help researchers, educators, and policymakers better understand the condition and progress of HBCUs. Read on to learn about these surveys.
Integrated Postsecondary Education Data System (IPEDS)
.+%e2%80%a2+In+fall+2021%2c+the+full-tim+(1).png)
The Integrated Postsecondary Education Data System (IPEDS) is an annual administrative data collection that gathers information from more than 6,000 postsecondary institutions, including 99 degree-granting, Title IV–eligible HBCUs (in the 2021–22 academic year).
The data collected in IPEDS includes information on institutional characteristics and resources; admissions and completions; student enrollment; student financial aid; and human resources (i.e., staff characteristics). These data are disaggregated, offering insights into student and employee demographics by race/ethnicity and gender, students’ age categories, first-time/non-first-time enrollment statuses, and full-time/part-time attendance intensity.
Data from IPEDS can be explored using various data tools—such as Data Explorer, Trend Generator, and College Navigator—that cater to users with varying levels of data knowledge and varying data needs.
National Postsecondary Student Aid Study (NPSAS)
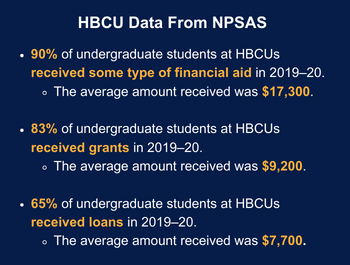
 The National Postsecondary Student Aid Study (NPSAS) is a nationally representative study that examines the characteristics of students in postsecondary institutions—including HBCUs—with a special focus on how they finance their education. NPSAS collects data on the percentage of HBCU students receiving financial aid and the average amounts received from various sources (i.e., federal, state, and institution) by gender and race/ethnicity.
Conducted every 3 or 4 years, this study combines data from student surveys, student-level school records, and other administrative sources and is designed to describe the federal government’s investment in financing students’ postsecondary education.
Data from NPSAS can be explored using DataLab and PowerStats.
National Teacher and Principal Survey (NTPS)
The National Teacher and Principal Survey (NTPS) is the U.S. Department of Education’s primary source of information on K–12 public and private schools from the perspectives of teachers and administrators. NTPS consists of coordinated surveys of schools, principals, and teachers and includes follow-up surveys to study principal and teacher attrition.

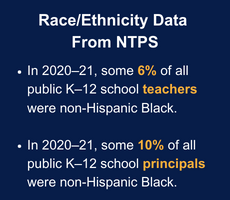
Among many other topics, NTPS collects data on the race/ethnicity of teachers and principals. These data—which show that Black teachers and principals make up a relatively small portion of the K–12 workforce—can be used to explore the demographics and experiences of teachers and principals. NTPS provides postsecondary institutions, like HBCUs, a snapshot of the preK–12 experiences of students and staff.
Data from NTPS can be explored using DataLab and PowerStats.
National Assessment of Educational Progress (NAEP)
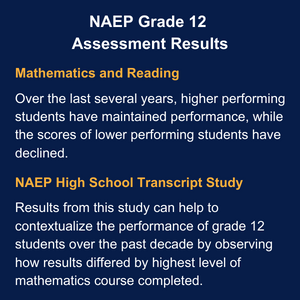
 The National Assessment of Educational Progress (NAEP)—also known as the Nation’s Report Card—is the the largest nationally representative and continuing assessment of what students in public and private schools in the United States know and are able to do in various subjects.
Main NAEP assesses students in grades 4, 8, and 12 in subjects like reading, mathematics, science, and civics, while NAEP Long-Term Trend assesses 9-, 13-, and 17-year-olds in reading and mathematics.
Among many other topics, NAEP collects data on students by race/ethnicity. These data can help to shed light on students’ experiences, academic performance, and level of preparedness before they enroll in HBCUs.
Data from NAEP can be explored using the NAEP Data Explorer.
To explore more HBCU data from these and other NCES surveys—including enrollment trends from 1976 to 2021—check out this annually updated Fast Fact. Be sure to follow NCES on X, Facebook, LinkedIn, and YouTube and subscribe to the NCES News Flash to stay up to date on the latest from NCES.
By Megan Barnett, AIR