NCES recently released results from the 2019 Trends in International Mathematics and Science Study (TIMSS). TIMSS tests students in grades 4 and 8 in mathematics and science every 4 years. The results show that
- Across both subjects and grades, the United States scored, on average, in the top quarter of the education systems that took part in TIMSS 2019.
- Among the 64 education systems that participated at grade 4, the United States ranked 15th and 8th in average mathematics and science scores, respectively.
- Among the 46 education systems that participated at grade 8, the United States ranked 11th in average scores for both subjects.
- On average, U.S. scores did not change significantly between the 2011 and 2019 rounds of TIMSS.
Average scores are one measure of achievement in national and international studies. However, they provide a very narrow perspective on student performance. One way to look more broadly is to examine differences in scores (or “score gaps”) between high-performing students and low-performing students. Score gaps between high performers and low performers can be one indication of equity within an education system. Here, high performers are those who scored in the 90th percentile (or top 10 percent) within their education system, and low performers are those who scored in the 10th percentile (or bottom 10 percent) within their education system.
In 2019, while some education systems had a higher average TIMSS score than the United States, none of these education systems had a wider score gap between their high and low performers than the United States. This was true across both subjects and grades.
Figure 1 shows an example of these findings using the grade 8 mathematics data. The figure shows that 17 education systems had average scores that were higher or not statistically different from the U.S. average score.
- Of these 17 education systems, 13 had smaller score gaps between their high and low performers than the United States. The score gaps in 4 education systems (Singapore, Chinese Taipei, the Republic of Korea, and Israel) were not statistically different from the score gap in the United States.
- The score gaps between the high and low performers in these 17 education systems ranged from 170 points in Quebec, Canada, to 259 points in Israel. The U.S. score gap was 256 points.
- If you are interested in the range in the score gaps for all 46 education systems in the TIMSS 2019 grade 8 mathematics assessment, see Figure M2b of the TIMSS 2019 U.S. Highlights Web Report, released in December 2020. This report also includes these results for grade 8 science and both subjects at the grade 4 level.
Figure 1. Average scores and 90th to 10th percentile score gaps of grade 8 students on the TIMSS mathematics scale, by education system: 2019
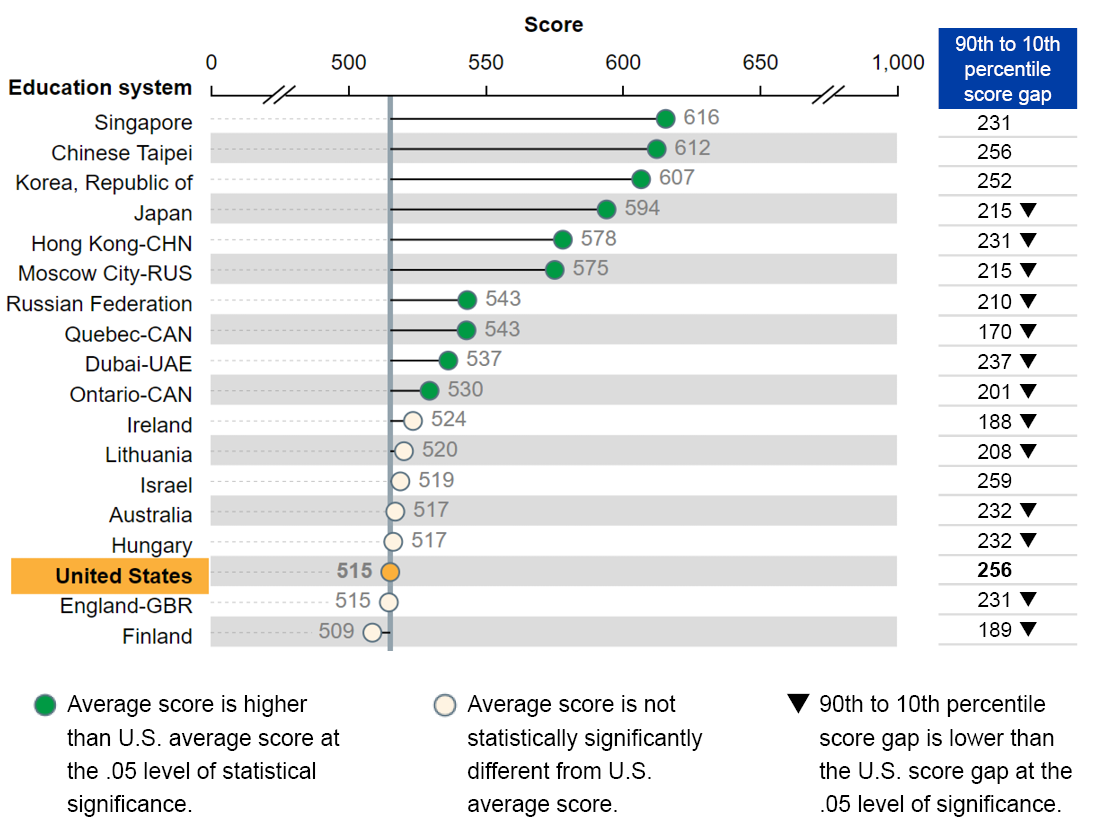
NOTE: This figure presents only those education systems whose average scores were similar to or higher than the U.S. average score. Scores are reported on a scale of 0 to 1,000 with a TIMSS centerpoint of 500 and standard deviation of 100.
SOURCE: International Association for the Evaluation of Educational Achievement (IEA), Trends in International Mathematics and Science Study (TIMSS), 2019.
From 2011 to 2019, U.S. average scores did not change significantly. However, the scores of low performers decreased, and score gaps between low and high performers grew wider in both subjects and grades. In addition, at grade 8, there was an increase in the scores of high performers in mathematics and science over the same period. These two changes contributed to the widening gaps at grade 8.
Figure 2 shows these results for the U.S. grade 8 mathematics data. Average scores in 2011 and 2019 were not significantly different. However, the score of high performers increased from 607 to 642 points between 2011 and 2019, while the score of low performers decreased from 409 to 385 points. As a result, the score gap widened from 198 to 256 points between 2011 and 2019. In addition, the 2019 score gap for grade 8 mathematics is significantly wider than the gaps for all previous administrations of TIMSS.
Figure 2. Trends in average scores and selected percentile scores of U.S. grade 8 students on the TIMSS mathematics scale: Selected years, 1995 to 2019
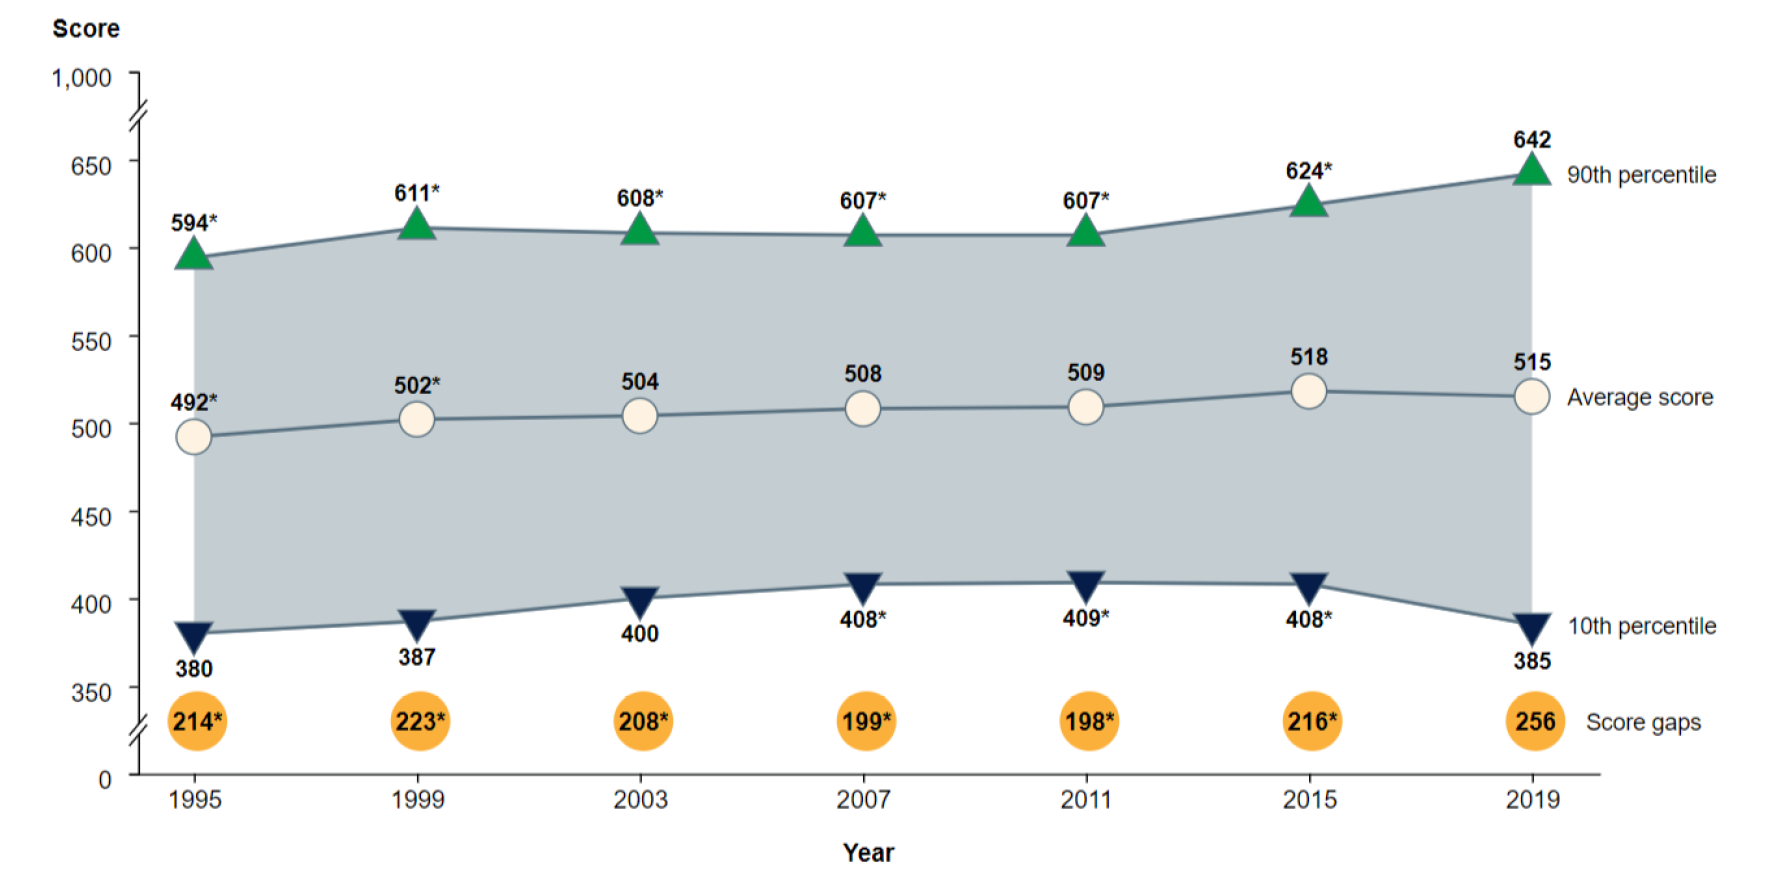
* p < .05. Significantly different from the 2019 estimate at the .05 level of statistical significance.
NOTE: Scores are reported on a scale of 0 to 1,000 with a TIMSS centerpoint of 500 and standard deviation of 100.
SOURCE: International Association for the Evaluation of Educational Achievement (IEA), Trends in International Mathematics and Science Study (TIMSS), 1995, 1999, 2003, 2007, 2011, 2015, 2019.
These TIMSS findings provide insights regarding equity within the U.S. and other education systems. Similar results from the National Assessment of Educational Progress (NAEP) show that mathematics scores at both grades 4 and 8 decreased or did not change significantly between 2009 and 2019 for lower performing students, while scores increased for higher performing students. More national and international research on the gap between high- and low-performing students could help inform important education policy decisions that aim to address these growing performance gaps.
To learn more about TIMSS and the 2019 U.S. and international results, check out the TIMSS 2019 U.S. Highlights Web Report and the TIMSS 2019 International Results in Mathematics and Science. A recording is also available for a RISE Webinar from February 24, 2021 (What Do TIMSS and NAEP Tell Us About Gaps Between High- and Low-Performing 4th and 8th Graders?) that explores these topics further.
By Katie Herz, AIR; Marissa Hall, AIR; and Lydia Malley, NCES