NCES Blog

National Center for Education Statistics

Highlights From the FY 21 Revenues and Expenditures for Public Elementary and Secondary Education Report

NCES recently released a finance tables report, Revenues and Expenditures for Public Elementary and Secondary Education: FY 21 (NCES 2023-301), which draws from data in the National Public Education Financial Survey (NPEFS). To accompany the report, NCES has updated the interactive data visualization tool to highlight the per pupil revenues and expenditures (adjusted for inflation) and average daily attendance (ADA) trends from the fiscal year 2021 (FY 21) NPEFS.

This tool allows users to see national or state-specific per pupil amounts and year-to-year percentage changes for both total revenue and current expenditures by using a slider to toggle between the two variables. Total revenues are shown by source, and total current expenditures are shown by function and subfunction. Clicking on a state in the map will display data for the selected state in the bar charts.

The tool also allows users to see the ADA for each state. It is sortable by state, ADA amount, and percentage change. It may also be filtered to easily compare selected states. Hovering over the ADA of a state will display another bar graph with the last 3 years of ADA data.

Overall, the results show that spending1 on elementary and secondary education increased in school year 2020–21 (FY 21). This is the eighth consecutive year that year-over-year education spending increased (since FY 13), after adjusting for inflation. This increase follows declines in year-over-year spending for the prior 4 years (FY 10 through FY 13).


Revenues

The 50 states and the District of Columbia reported $837.3 billion in revenues collected for public elementary and secondary education in FY 21. State and local governments provided $748.9 billion, or 89.4 percent of all revenues. The federal government contributed $88.4 billion, or 10.6 percent of all revenues. Total revenues increased by 3.0 percent after adjusting for inflation2 (from $812.8 to $837.3 billion) from FY 20 to FY 21; local revenues remained relatively unchanged (from $365.1 to $365.1 billion); state revenues decreased by 0.6 percent (from $385.9 to $383.8 billion); and federal revenues increased by 43.2 percent (from $61.8 to $88.4 billion).

Total revenues per pupil averaged $17,015 on a national basis in FY 21. This reflects an increase of 5.9 percent between FY 20 and FY 21 and follows an increase of 1.5 percent from FY 19 to FY 20. The percentage change in revenues per pupil from FY 20 to FY 21 ranged from an increase of 15.3 percent in Maine to a decrease of 4.2 percent in Hawaii.


Image of NPEFS data visualization site showing revenues per pupil for public elementary and secondary schools in FY 20 and FY 21


Revenues from COVID-19 Federal Assistance Funds for public elementary and secondary education totaled $25.3 billion, or 28.6 percent of all federal revenues.

  • Revenues from the Federal Coronavirus Relief Fund accounted for $8.9 billion, or 35.2 percent of total revenues from COVID-19 Federal Assistance Funds.
     
  • Revenues from the Elementary and Secondary School Emergency Relief (ESSER I) Fund accounted for $8.5 billion, or 33.7 percent of total revenues from COVID-19 Federal Assistance Funds.
     
  • Revenues from the Elementary and Secondary School Emergency Relief (ESSER II) Fund accounted for $6.5 billion, or 25.8 percent of total revenues from COVID-19 Federal Assistance Funds.


Expenditures

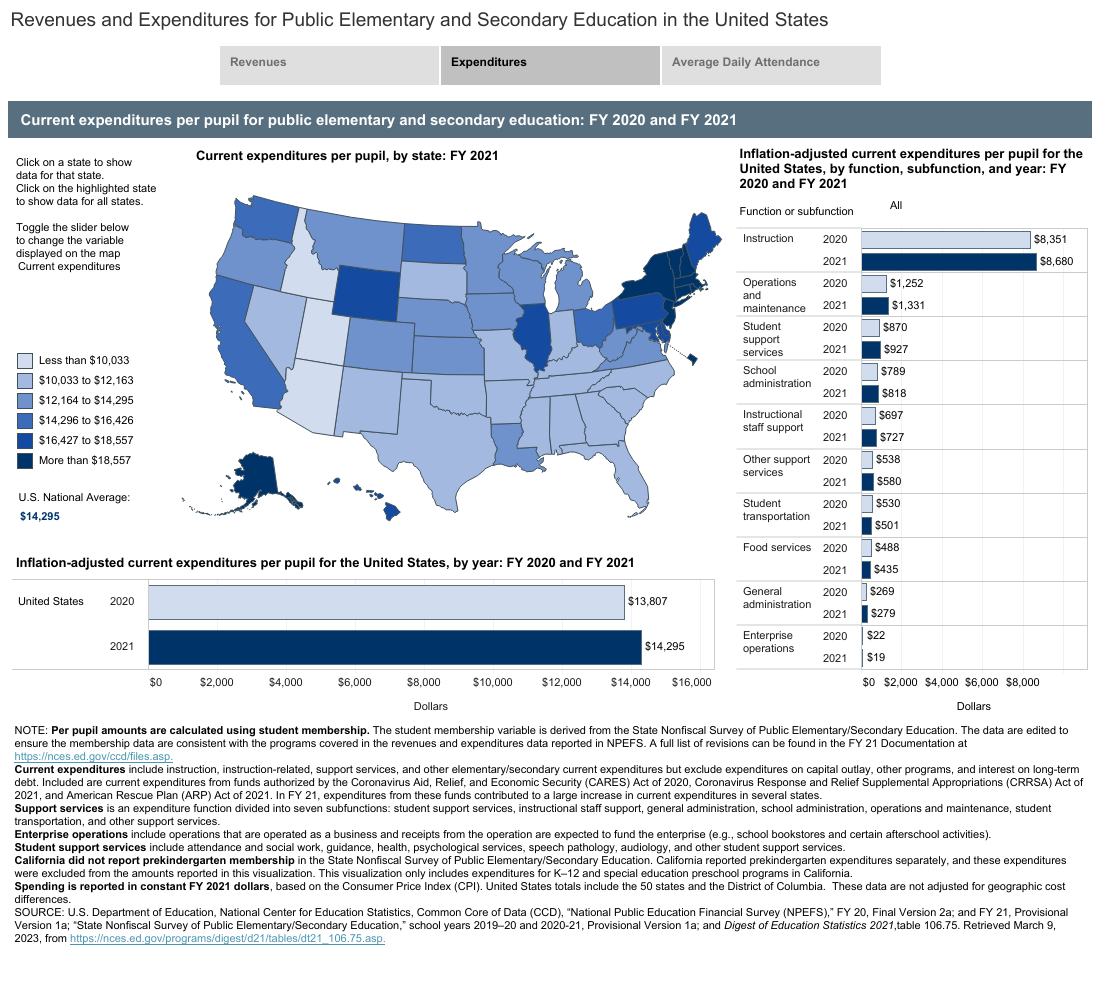
Current expenditures for public elementary and secondary education across the nation increased by 0.7 percent between FY 20 and FY 21 (from $698.3 to $703.5 billion). Within that increase, expenditures for instruction increased by 1.1 percent between FY 20 and FY 21 (from $422.4 to $427.1 billion), and student support expenditures increased by 3.6 percent between FY 20 and FY 21 (from $44.0 to $45.6 billion).

Current expenditures per pupil for the day-to-day operation of public elementary and secondary schools was $14,295 in FY 21, an increase of 3.5 percent from FY 20.3 In FY 21, education spending was 16.7 percent higher than at the lowest point of the Great Recession in FY 13.


Figure 1. National inflation-adjusted current expenditures per public for public elementary and secondary education: Fiscal years 2012 through 2021


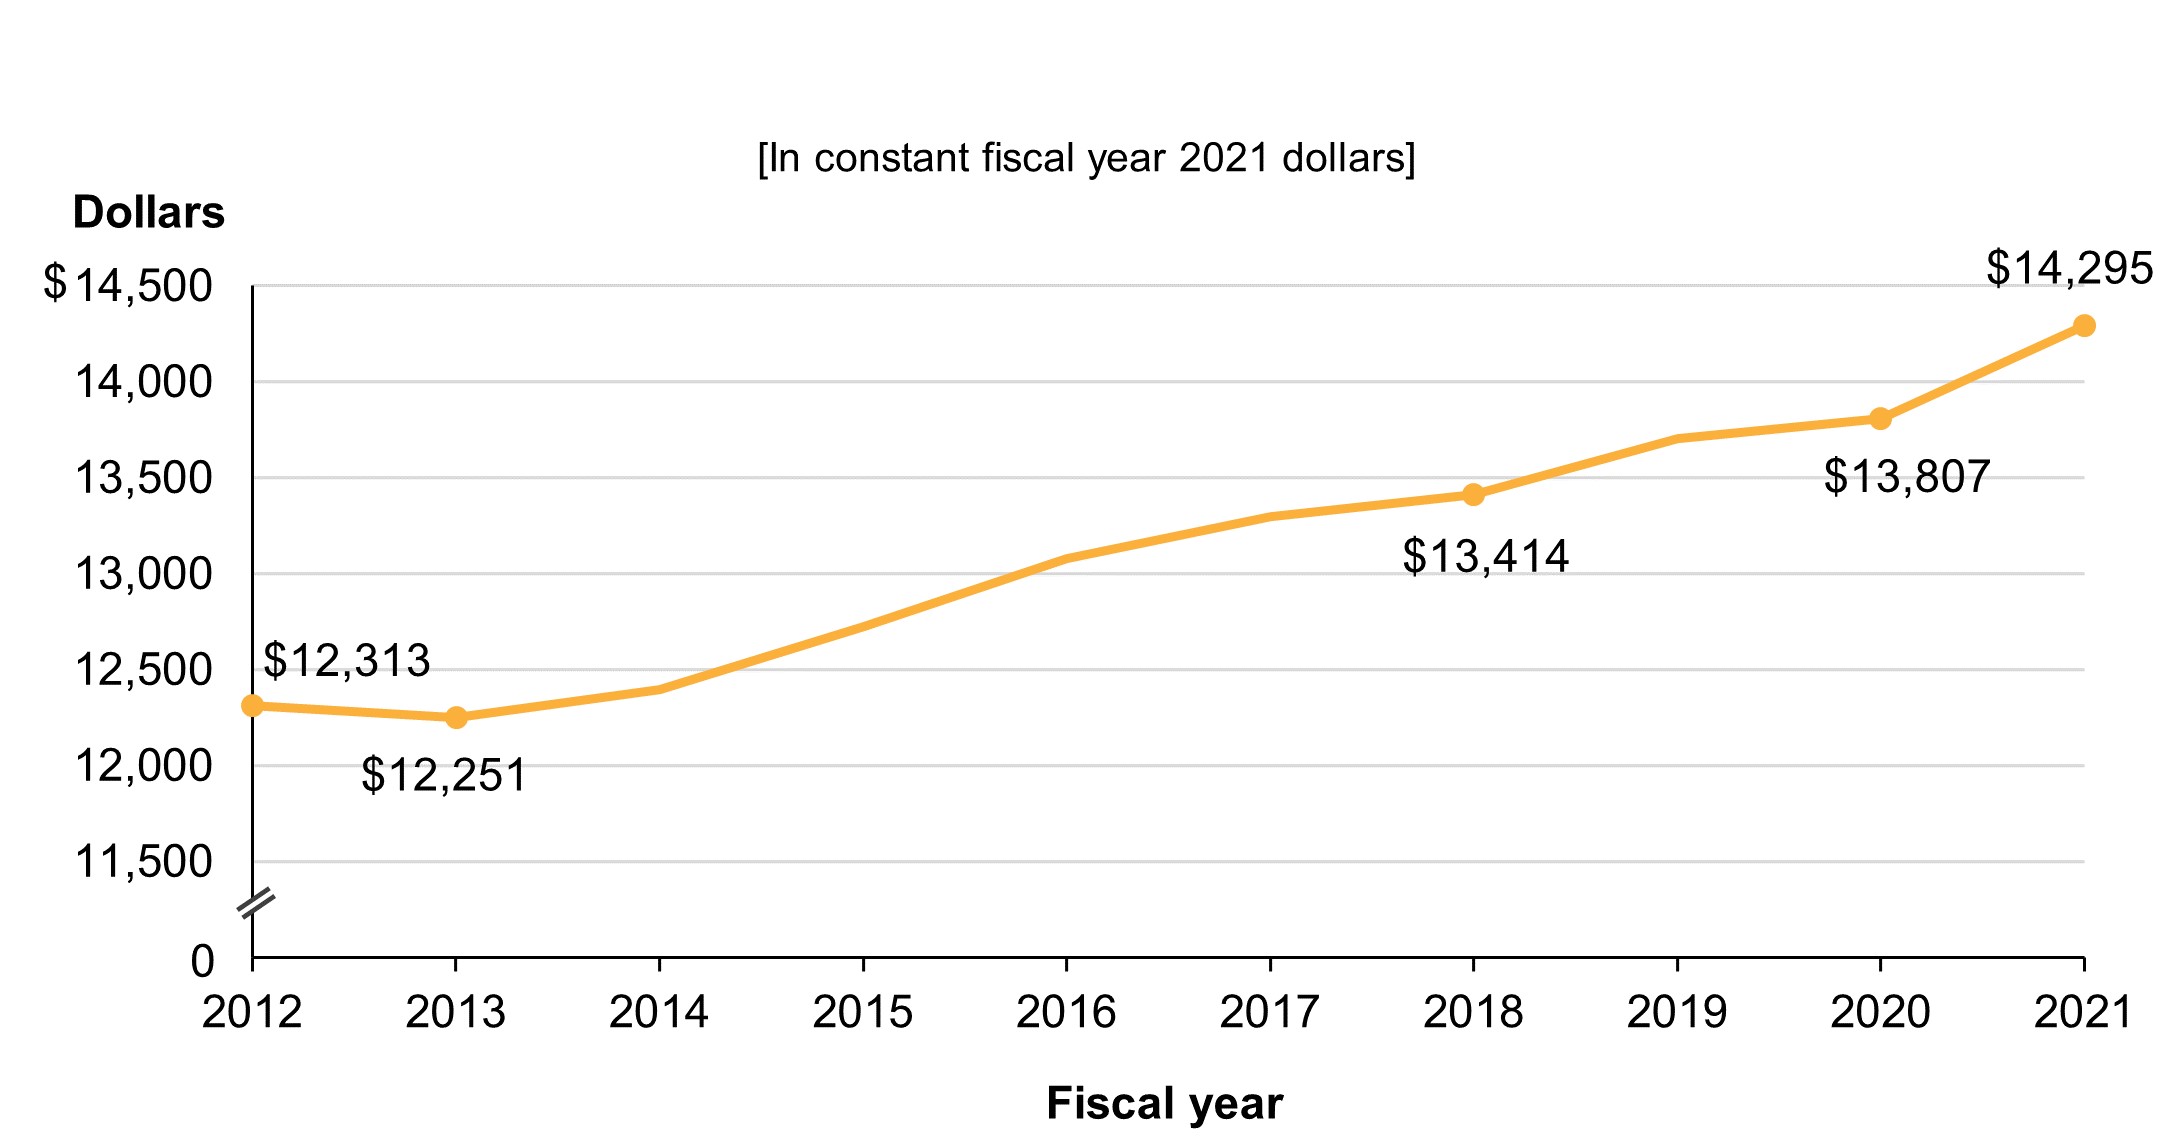
NOTE: Spending is reported in constant FY 21 dollars, based on the Consumer Price Index (CPI). National totals include the 50 states and the District of Columbia. California did not report prekindergarten membership in the State Nonfiscal Survey of Public Elementary/Secondary Education. California reported prekindergarten expenditures separately, and these expenditures were excluded from the amounts reported in this figure.
SOURCE: U.S. Department of Education, National Center for Education Statistics, Common Core of Data (CCD), “National Public Education Financial Survey,” fiscal years 2012 through 2020, Final Version 2a; and fiscal year 2021, Provisional Version 1a; and Digest of Education Statistics 2021, table 106.75. Retrieved March 9, 2023, from nces.ed.gov/programs/digest/d21/tables/dt21_106.75.asp.


Without making adjustments for geographic cost differences, current expenditures per pupil ranged from $9,014 in Utah to $26,097 in New York. In addition to New York, current expenditures per pupil were highest in the District of Columbia ($25,113), Vermont ($24,050), New Jersey ($22,784), and Connecticut ($22,216). In addition to Utah, current expenditures per pupil were lowest in Idaho ($9,054), Arizona ($9,571), Mississippi ($10,060), and Nevada ($10,073). The states with the largest increases in current expenditures per pupil from FY 20 to FY 21 were Maine (11.9 percent), Arizona (7.6 percent), Montana (7.4 percent), Louisiana (7.3 percent), and Massachusetts (6.6 percent).


Image of NPEFS data visualization site showing current expenditures per pupil for public elementary and secondary schools in FY 20 and FY 21


In FY 21, salaries and wages ($389.2 billion) in conjunction with employee benefits ($169.7 billion) accounted for 79.4 percent ($558.8 billion) of current expenditures for public elementary and secondary education. Expenditures for instruction and instructional staff support services comprised 65.8 percent ($462.9 billion) of total current expenditures.

Between FY 20 and FY 21, total expenditures increased by 0.2 percent (from $812.3 to $813.6 billion). Of the $813.6 billion in total expenditures in FY 21, 86.5 percent were current expenditures, 9.8 percent were capital outlay expenditures, 2.7 percent were interest on debt, and 1.1 percent were expenditures for other programs.

Current expenditures from federal Title I grants for economically disadvantaged students (including carryover expenditures) accounted for $16.3 billion, or 2.3 percent of current expenditures for public elementary and secondary education at the national level in FY 21. Nationally, Title I expenditures per pupil averaged $331 and ranged from $123 in Utah to $874 in New York.

Current expenditures paid from COVID-19 Federal Assistance Funds for public elementary and secondary education totaled $24.2 billion for the 50 states and the District of Columbia. Of these, instructional expenditures accounted for $13.7 billion, or 56.5 percent of current expenditures paid from COVID-19 Federal Assistance Funds, and support services expenditures accounted for $9.1 billion, or 37.6 percent of current expenditures paid from COVID-19 Federal Assistance Funds.

To explore data on public elementary and secondary revenues, expenditures, and ADA, check out our new data visualization tool.

Be sure to follow NCES on TwitterFacebookLinkedIn, and YouTube and subscribe to the NCES News Flash to stay up-to-date on the latest from the National Public Education Financial Survey.


By Stephen Q. Cornman, NCES, and Malia Howell and Jeremy Phillips, U.S. Census Bureau


[1] Spending refers to current expenditures. Current expenditures are composed of expenditures for the day-to-day operation of schools and school districts for public elementary and secondary education, including expenditures for staff salaries and benefits, supplies, and purchased services. Current expenditures include instruction, instruction-related, support services (e.g., social work, health, and psychological services), and other elementary/secondary current expenditures but exclude expenditures on capital outlay, other programs, and interest on long-term debt.

[2] Throughout this blog post, all comparisons between years are adjusted for inflation by converting the figures to constant dollars. Inflation adjustments utilize the Consumer Price Index (CPI) published by the U.S. Department of Labor, Bureau of Labor Statistics. For comparability to fiscal education data, NCES adjusts the CPI from a calendar year to a school fiscal year basis (July through June). See Digest of Education Statistics 2021, table 106.70.

[3] Per pupil expenditures are calculated using student membership derived from the State Nonfiscal Survey of Public Elementary/Secondary Education. In some states, adjustments are made to ensure consistency between membership and reported fiscal data. More information on these adjustments can be found in the data file documentation.

NCES Releases a New Interactive Data Visualization Tool on Revenues, Expenditures, and Attendance for Public Elementary and Secondary Education

To accompany the recently released Revenues and Expenditures for Public Elementary and Secondary Education FY 2020, NCES has created an interactive data visualization tool to highlight the per pupil revenues and expenditures (adjusted for inflation) and average daily attendance (ADA) trends from the fiscal year (FY) 2020 National Public Education Financial Survey.

This tool allows users to see national or state-specific per pupil amounts and year-to-year percentage changes for both total revenue and current expenditures by using a slider to toggle between the two variables. Total revenues are shown by source, and total current expenditures are shown by function and subfunction. Clicking on a state in the map will display data for the selected state in the bar charts.

The tool also allows users to see the ADA for each state. It is sortable by state, ADA amount, and percentage change. It may also be filtered to easily compare selected states. Hovering over the ADA of a state will display another bar graph with the last 3 years of ADA data.

Revenues and Expenditures

Between FY 2019 and FY 2020, inflation-adjusted total revenues per pupil increased by 1.8 percent (to $15,711). Of these total revenues for education in FY 2020, the majority were provided by state and local governments ($7,461 and $7,056, respectively).

The percentage change in revenues per pupil from FY 2019 to FY 2020 ranged from +15.4 percent in New Mexico to -2.4 percent in Kentucky. Total revenues per pupil increased in 38 states and the District of Columbia and decreased in 12 states between FY 2019 and FY 2020.


[click to enlarge image]Image of revenues tab of the Finance Visualization Tool showing revenues per pupil for public elementary and secondary education in FY 2019 and FY 2020


In FY 2020, current expenditures per pupil for the United States were $13,489, up 0.5 percent from FY 2019, after adjusting for inflation. Current expenditures per pupil ranged from $8,287 in Utah to $25,273 in New York. After New York, current expenditures per pupil were highest in the District of Columbia ($23,754), Vermont ($22,124), New Jersey ($21,385), and Connecticut ($20,889). After Utah, current expenditures per pupil were lowest in Idaho ($8,337), Arizona ($8,694), Oklahoma ($9,395), and Nevada ($9,548).

The states with the largest increases in current expenditures per pupil from FY 2019 to FY 2020, after adjusting for inflation, were New Mexico (+9.3 percent), Illinois (+5.7 percent), Kansas (+4.0 percent), Texas (+3.7 percent), and Indiana (+3.7 percent). The states with the largest decreases were Delaware1 (-12.8 percent), Connecticut (-2.7 percent), Arizona (-2.4 percent), Alaska (-2.0 percent), and Arkansas (-1.9 percent).

Average Daily Attendance (ADA)

During FY 2020, many school districts across the country closed their school buildings for in-person learning and began providing virtual instruction in an effort to prevent the spread of COVID-19. In order to collect the most consistent and measurable data possible, the U.S. Department of Education provided flexibility for states to report average daily attendance data for the 2019–20 school year.

Between FY 2019 and FY 2020, ADA decreased in 14 states, with the largest decrease at 2.4 percent in New Mexico. ADA increased in the remaining 36 states and the District of Columbia, with the largest increase at 4.1 percent in South Dakota. In 43 states, the ADA in FY 2020 was within 2 percent of the previous year’s ADA.


[click to enlarge image]

Image of Average Daily Attendance tab of the Finance Visualization Tool showing average daily attendance for public elementary and secondary education by state in FY 2020


To explore these and other data on public elementary and secondary revenues, expenditures, and ADA, check out our new data visualization tool.

Be sure to follow NCES on TwitterFacebookLinkedIn, and YouTube and subscribe to the NCES News Flash to stay up-to-date on the latest from the National Public Education Financial Survey.


By Stephen Q. Cornman, NCES, and Malia Howell and Jeremy Phillips, U.S. Census Bureau


[1] In Delaware, the decline in current expenditures per pupil is due primarily to a decrease in the amount reported for employee benefits paid by the state on behalf of local education agencies (LEAs). The state reviewed this decline and provided corrected data that will be published in the final file.