IES Blog

Institute of Education Sciences

Data Tools for College Professors and Students

Ever wonder what parts of the country produce the most English majors? Want to know which school districts have the most guidance counselors? The National Center for Education Statistics (NCES) has all the tools you need to dig into these and lots of other data!

Whether you’re a student embarking on a research project or a college professor looking for a large data set to use for an assignment, NCES has you covered. Below, check out the tools you can use to conduct searches, download datasets, and generate your own statistical tables and analyses.


Conduct Publication Searches

Two search tools help researchers identify potential data sources for their study and explore prior research conducted with NCES data. The Publications & Products Search Tool can be used to search for NCES publications and data products. The Bibliography Search Tool, which is updated continually, allows users to search for individual citations from journal articles that have been published using data from most surveys conducted by NCES.

Key reference publications include the Digest of Education Statistics, which is a comprehensive library of statistical tabulations, and The Condition of Education, which highlights up-to-date trends in education through statistical indicators.


Learn with Instructional Modules

The Distance Learning Dataset Training System (DLDT) is an interactive online tool that allows users to learn about NCES data across the education spectrum. DLDT’s computer-based training introduces users to many NCES datasets, explains their designs, and offers technical considerations to facilitate successful analyses. Please see the NCES blog Learning to Use the Data: Online Dataset Training Modules for more details about the DLDT tool.


Download and Access Raw Data Files

Users have several options for conducting statistical analyses and producing data tables. Many NCES surveys release public-use raw data files that professors and students can download and analyze using statistical software packages like SAS, STATA, and SPSS. Some data files and syntax files can also be downloaded using NCES data tools:

  • Education Data Analysis Tool (EDAT) and the Online Codebook allow users to download several survey datasets in various statistical software formats. Users can subset a dataset by selecting a survey, a population, and variables relevant to their analysis.
  • Many data files can be accessed directly from the Surveys & Programs page by clicking on the specific survey and then clicking on the “Data Products” link on the survey website.


Generate Analyses and Tables

NCES provides several online analysis tools that do not require a statistical software package:

  • DataLab is a tool for making tables and regressions that features more than 30 federal education datasets. It includes three powerful analytic tools:
    • QuickStats—for creating simple tables and charts.
    • PowerStats—for creating complex tables and logistic and linear regressions.
    • TrendStats—for creating complex tables spanning multiple data collection years. This tool also contains the Tables Library, which houses more than 5,000 published analysis tables by topic, publication, and source.


  • National Assessment of Educational Progress (NAEP) Data Explorer can be used to generate tables, charts, and maps of detailed results from national and state assessments. Users can identify the subject area, grade level, and years of interest and then select variables from the student, teacher, and school questionnaires for analysis.
  • International Data Explorer (IDE) is an interactive tool with data from international assessments and surveys, such as the Program for International Student Assessment (PISA), the Program for the International Assessment of Adult Competencies (PIAAC), and the Trends in International Mathematics and Science Study (TIMSS). The IDE can be used to explore student and adult performance on assessments, create a variety of data visualizations, and run statistical tests and regression analyses.
  • Elementary/Secondary Information System (ElSi) allows users to quickly view public and private school data and create custom tables and charts using data from the Common Core of Data (CCD) and Private School Universe Survey (PSS).
  • Integrated Postsecondary Education Data System (IPEDS) Use the Data provides researcher-focused access to IPEDS data and tools that contain comprehensive data on postsecondary institutions. Users can view video tutorials or use data through one of the many functions within the portal, including the following:
    • Data Trends—Provides trends over time for high-interest topics, including enrollment, graduation rates, and financial aid.
    • Look Up an Institution—Allows for quick access to an institution’s comprehensive profile. Shows data similar to College Navigator but contains additional IPEDS metrics.
    • Statistical Tables—Equips power users to quickly get data and statistics for specific measures, such as average graduation rates by state.


New Data Tell the Story of Public and Private Schools and Their Leaders

Which schools would you guess, on average, spend more instructional time on English, reading, and language arts—public schools or private schools? How about on mathematics?

These questions and many others are answered in recently released reports on U.S. public and private schools and principals. The data in these reports are from the 2017–18 National Teacher and Principal Survey (NTPS), which is administered by the National Center for Education Statistics (NCES). NTPS previously collected data from public schools, principals, and teachers during the 2015–16 school year, but this is the first private school collection since the 2011–12 school year. (The latest NTPS data on public and private school teachers will be released later this year.)

The NTPS collects data about principals’ educational backgrounds and goals, as well as the climate of their schools and other general information about their schools and special programs and services provided. These data serve as a resource for researchers, policymakers, and the general public who are interested in understanding the current experiences and conditions of U.S. public and private schools.

The 2017–18 NTPS featured several new topic areas, such as the following:

  • School instruction time. Overall, schools reported that third-graders spent a weekly average of 500 minutes on instruction in English, reading, and language arts; 350 minutes on instruction in arithmetic or mathematics; and 170 minutes each on instruction in science and social studies or history. Here are some data to answer the questions from the beginning of this post:
    • Public schools reported that third-graders spent a weekly average of 540 minutes on instruction in English, reading, and language arts; 370 minutes on instruction in arithmetic or mathematics; 170 minutes on instruction in science; and 160 minutes on instruction in social studies or history.
    • Private schools reported that third-graders spent a weekly average of 400 minutes on instruction in English, reading, and language arts; 280 minutes on instruction in arithmetic or mathematics; and 170 minutes each on instruction in science and social studies or history.
       

Figure 1. Average minutes reported by public and private schools that third-grade students spend on selected subjects per week: 2017–18

NOTE: Schools that reported 0 minutes per week for a subject were excluded from the calculations of average minutes per week.
SOURCE: U.S. Department of Education, National Center for Education Statistics, National Teacher and Principal Survey (NTPS), “Public School and Private School Documentation Data Files,” 2017–18. Please see Characteristics of Public and Private Elementary and Secondary Schools in the United States: Results From the 2017–18 National Teacher and Principal Survey First Look, table 7.


  • ​Principals’ professional development. Overall, 83 percent of all principals reported participating in any professional development activities in the 2016–17 school year. Specifically, 85 percent of public school principals and 77 percent of private school principals reported doing so.
  • Evaluation of principals. Among public school principals, relatively more principals in traditional public schools were evaluated during the last school year than were principals in public charter schools (79 and 69 percent, respectively). Relatively more private school principals in Catholic and nonsectarian schools (63 and 58 percent, respectively) were evaluated during the last school year than were principals in other religious schools (41 percent).

Data files for the 2017–18 school and principal questionnaires will be released later this year. In order to protect the identities of responding schools and principals, researchers must apply for a restricted-use license to access the full restricted-use data files. Data will also be available through NCES’ online data tool, DataLab, where users can create custom tables and regressions without a restricted-use license.


By Maura Spiegelman

Back to School by the Numbers: 2019–20 School Year

Across the country, hallways and classrooms are full of activity as students return for the 2019–20 school year. Each year, the National Center for Education Statistics (NCES) compiles back-to-school facts and figures that give a snapshot of our schools and colleges for the coming year. You can see the full report on the NCES website, but here are a few “by-the-numbers” highlights. You can also click on the hyperlinks throughout the blog to see additional data on these topics.

The staff of NCES and of the Institute of Education Sciences (IES) hopes our nation’s students, teachers, administrators, school staffs, and families have an outstanding school year!


56.6 million

The number of students expected to attend public and private elementary and secondary schools this year—slightly more than in the 2018–19­ school year (56.5 million).

Overall, 50.8 million students are expected to attend public schools this year. The racial and ethnic profile of public school students includes 23.7 million White students, 13.9 million Hispanic students, 7.7 million Black students, 2.7 million Asian students, 2.1 million students of Two or more races, 0.5 million American Indian/Alaska Native students, and 0.2 million Pacific Islander students.

About 5.8 million students are expected to attend private schools this year.


$13,440

The projected per student expenditure in public elementary and secondary schools in 2019–20. Total expenditures for public elementary and secondary schools are projected to be $680 billion for the 2019–20 school year.


3.7 million

The number of teachers in fall 2019. There will be 3.2 million teachers in public schools and 0.5 million teachers in private schools.


3.7 million

The number of students expected to graduate from high school this school year, including 3.3 million from public schools and nearly 0.4 million from private schools.


19.9 million

The number of students expected to attend American colleges and universities this fall—lower than the peak of 21.0 million in 2010. About 13.9 million students will attend four-year institutions and 6.0 million will attend two-year institutions.


56.7%

The projected percentage of female postsecondary students in fall 2019, for a total of 11.3 million female students, compared with 8.6 million male students.


By Sidney Wilkinson-Flicker

Collecting School-Level Finance Data: An Evaluation From the Pilot School-Level Finance Survey (SLFS)

Policymakers, researchers, and the public have long voiced concerns about the equitable distribution of school funding within and across school districts. More recently, the Every Student Succeeds Act (ESSA) requires that states and school districts add per pupil expenditures, disaggregated by source of funds, to their annual report cards for each local education agency (LEA) (e.g., school district) and school. In response to this these requirements, the National Center for Education Statistics (NCES) developed a new collection of finance data at the school level—the School-Level Finance Survey (SLFS).

The SLFS collects at the school level many of the same expenditure variables currently being collected at the district level on the School District Finance Survey. The pilot SLFS was designed to evaluate whether the survey is a viable, efficient, and cost-effective method to gather school-level finance data. Findings from the pilot survey were recently released in an NCES report titled The Feasibility of Collecting School-Level Finance Data: An Evaluation of Data From the School-Level Finance Survey (SLFS) School Year 2014–15.

Here’s some of what we learned:


Many states participating in the SLFS were able to report complete personnel and/or nonpersonnel expenditure data for a high percentage of their schools.

Of the 15 states that participated in the SLFS in school year 2014–15, 9 states were able to report school-level finance data for greater than 95 percent of their operational schools (figure 1). Other than Colorado and New Jersey,[1] all states were able to report SLFS data for at least 84 percent of their schools, ranging from 85 percent in Kentucky to nearly 100 percent in Maine. Just over one-half of reporting states (8 of 15) reported all personnel items (i.e., dollars spent on salaries and wages for teachers, aides, administrators, and support staff) for at least 95 percent of their schools. Seven of 15 states reported all nonpersonnel items (i.e., dollars spent on purchased services, supplies, and other costs not directly related to school employees) for at least 95 percent of their schools.  


Figure 1. Percentage of operational schools with fiscal data reported in the SLFS, by participating state: 2014–15

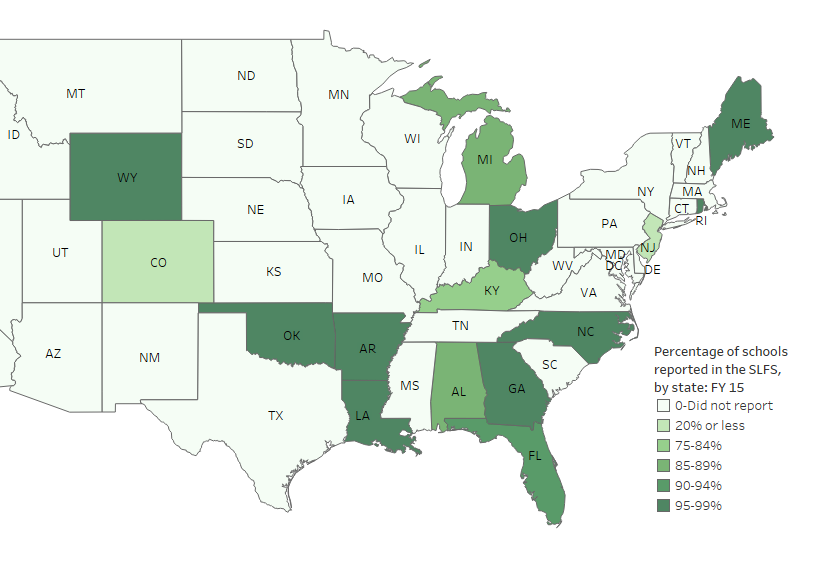
NOTE: This figure includes operational schools only (i.e., excludes closed, inactive, or future LEAs). The count of schools reported includes schools that can be matched to the Common Core of Data (CCD) School Universe files and for which at least one data item is reported in the SLFS.

SOURCE: U.S. Department of Education, National Center for Education Statistics, Common Core of Data (CCD), “School-Level Finance Survey (SLFS),” fiscal year 2015, Preliminary Version 1a; “Local Education Agency Universe Survey,” 2014–15, Provisional Version 1a.


SLFS data are generally comparable and consistent with other sources of school finance data.

A substantial majority of personnel expenditures can be reported at the school level. Personnel expenditures reported for the SLFS were reasonably comparable with the district-level and state-level data.[2] For common personnel expenditures, the absolute percentage difference between the SLFS and the district survey was less than 9 percent in 8 of 10 states (figure 2). The absolute percentage difference between the SLFS and the state-level survey for common personnel expenditures was less than 9 percent in 6 of 10 states.


Figure 2. School-Level Finance Survey (SLFS), School District Finance Survey (F-33), and National Public Education Financial Survey (NPEFS), by participating state: 2014–15

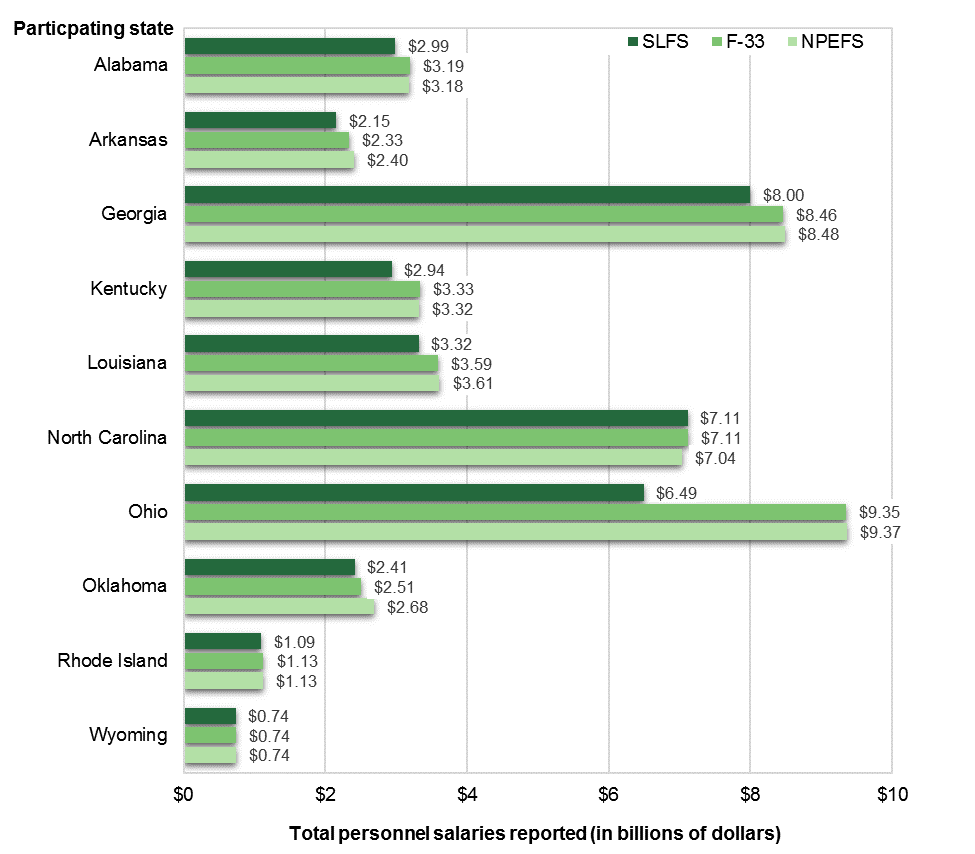
NOTE: Total personnel salaries include instructional staff salaries, student support services salaries, instructional staff support services salaries, and school administration salaries. This figure includes all schools in the SLFS and all LEAs in the F-33. Only states where reporting standards are met are included.

SOURCE: U.S. Department of Education, National Center for Education Statistics, Common Core of Data (CCD), “School-Level Finance Survey (SLFS),” fiscal year 2015, Preliminary Version 1a; “National Public Education Financial Survey (NPEFS),” fiscal year 2015, Final Version 2a; and “School District Finance Survey (F-33),” fiscal year 2015, Provisional Version 1a.


There are numerous inherent challenges in collecting school-level finance data: 

  • Communicating the vision of why reporting school-level finance data is important to school finance practitioners.
  • The pilot SLFS did not collect all types of current expenditures.
  • Some states had not fully developed standardized protocols or procedures for reporting finance data at the school level. 
  • There are varying legal requirements for the types of schools that are required to report finance data and the types of expenditures schools and districts are required to report.
  • The survey’s data item definitions were not consistent with states’ internal accounting for some items.

During the pilot survey, NCES and Census Bureau staff took action to address these challenges. 


Evidence suggests that it is feasible to collect accurate and informative school-level financial data.

States participating in the SLFS are improving internal data systems and protocols, which will allow them to report complete and comparable school-level finance data. The SLFS promotes efficiency by incorporating long-established NCES standards for school district financial accounting. The results of the pilot SLFS survey demonstrate that it is feasible to collect accurate and informative school-level finance data. The informational and analytical value will increase as response rates improve and as states improve their capabilities to collect complete, accurate, and comparable finance data at the school level.


By Stephen Q. Cornman, NCES; Malia Howell, Stephen Wheeler, and Osei Ampadu, U.S. Census Bureau; and Lei Zhou, Activate Research


[1] In 2014–15, Colorado did not require all school districts to report finance data at the school level; thus, data is reported for only 26 of Colorado’s 262 LEAs. In New Jersey, school-level finance reporting is required only for its “Abbott” districts, which make up only 31 of the state’s 702 districts.

[2] NCES’s Common Core of Data (CCD) program collects school finance data through three annual surveys: the school-level SLFS, the LEA-level School District Finance Survey (F-33), and the state-level National Public Education Financial Survey (NPEFS). Five data items are common to all three fiscal surveys (i.e., are collected at the school level for the SLFS, at the LEA level for the F-33, and at the state level for the NPEFS): instructional staff salaries, student support services salaries, instructional staff support services salaries, school administration salaries, and teacher salaries.


Career Pathways Research at HHS: Lessons and Opportunities for Education Research

Over the past few years, staff from IES and the Office of Planning, Research, and Evaluation (OPRE) in the Administration for Children and Families (ACF), U.S. Department of Health and Human Services (HHS), have been learning from and supporting one another’s work. Our offices have a shared interest in understanding and improving outcome for adults in postsecondary career pathway programs and for creating a strong evidence base.

We have even funded projects that dovetail nicely. For example, IES funded a development project focusing on Year Up, and OPRE included Year Up programs in their Pathways for Advancing Careers and Education (PACE) Study.

For IES researchers not already aware of OPRE’s research, we would like to highlight three things that may be particularly relevant to the work IES hopes to support.

A Growing Portfolio of Career Pathway Research: For over a decade, OPRE has created a robust research portfolio longitudinal, rigorous experimental career pathways program research.  These career pathway programs provide postsecondary education and training through a series of manageable steps leading to successively higher credentials and employment opportunities. In particular, OPRE has supported the Pathways for Advancing Careers and Education (PACE) Study and the rigorous evaluation of the Health Profession Opportunity Grants (HPOG) Program. You can find reports from these and other self-sufficiency, welfare, and employment activities in the OPRE Resource Library.

Available Data and Funding Opportunity: Later this summer, OPRE will be archiving data from PACE and HPOG at the University of Michigan’s Inter-University Consortium on Political and Social Research (ICPSR) at the Institute for Social Research. These data will be available as restricted-use files for secondary data analysis. To encourage research, OPRE announced a funding opportunity Career Pathways Secondary Data Analysis Grants to support secondary analysis these data. Applications are due August 16, 2019.

Understanding Programs’ Motivations for Participating in Research: Getting education programs (schools, universities, etc.) to join multi-year, randomized controlled trials is difficult. Programs are wary of random assignment or finding null or negative effects. Yet, the programs that participated in the PACE Study were overall quite supportive. A recent report “We Get a Chance to Show Impact”, Program Staff Reflect on Participating in a Rigorous, Multi-site Evaluation documents the hurdles and benefits of participation from a program’s point of view. These programs’ insights are particularly useful for any researcher hoping to form partnerships with education settings.

To learn more about the ongoing career pathways research at OPRE and their findings, please visit https://www.acf.hhs.gov/opre/research/project/career-pathways-research-portfolio.