IES Blog

Institute of Education Sciences

Partnering with Practitioners to Address Mental Health in Rural Communities

IES values and encourage collaborations between researchers and practitioners to ensure that research findings are relevant, accessible, feasible, and useful. In 2017, Dr. Wendy Reinke, University of Missouri, received IES funding to formalize the Boone County School’s Mental Health Coalition by strengthening their partnership and validating the Early Identification System (EIS) to screen for social, emotional, behavioral, and academic risk among K-12 students in rural schools. Building on these successes, Dr. Reinke now leads the National Center for Rural School Mental Health (NCRSMH), a consortium of researchers leading efforts to advance mental health screening and support in rural communities.

Bennett Lunn, a Truman-Albright Fellow at IES, asked Dr. Reinke about the work of the original partnership and how it has informed her efforts to build new partnerships with other rural schools around the country. Below are her responses.


What was the purpose of the Boone County Schools Mental Health Coalition and what inspired you to do this work?

In 2015, our county passed an ordinance in which a small percent of our sales tax is set aside to support youth mental health in our community. As a result, the schools had visits from many of the local mental health agencies to set up services in school buildings. The superintendents quickly realized that it would be wise to have a more coordinated effort across school districts. They formed a coalition and partnered with researchers at the University of Missouri to develop a comprehensive model to prevent and intervene in youth mental health problems. The enthusiasm of our school partners and their willingness to consider research evidence to inform the model was so energizing! We were able to build a multi-tiered prevention and intervention framework that uses universal screening data to inform supports. In addition, we were awarded an IES partnership grant to help validate the screener, conduct focus groups and surveys of stakeholders to understand the feasibility and social validity of the model, and determine how fidelity to the model is related to student outcomes. The EIS is now being used in 54 school buildings across six school districts as part of their daily practice. 


Were there advantages to operating in a partnership to validate the screener?  

The main benefit of working in partnership with school personnel is that you learn what works under what circumstances from those directly involved in supporting students. We meet every month with the superintendents and other school personnel to ensure that if things are not working, we can find solutions before the problems become too big. We vote on any processes or procedure that were seen as needing to change. The meeting includes school personnel sharing the types of activities they are doing in their buildings so that others can replicate those best practices, and we meet with students to get their perspectives on what is working. In addition, the university faculty bring calls for external funding of research to the group to get ideas for what types of research would be appropriate and beneficial to the group. Schools are constantly changing and encountering new challenges. Being close to those who are working in the buildings allows for us to work together in forming and implementing feasible solutions over time.


What advice do you have for researchers trying to make research useful and accessible to practitioners? 

Be collaborative and authentic. Demonstrate that you are truly there to create meaningful and important changes that will benefit students. Show that your priority is improving outcomes for schools and students and not simply collecting data for a study. These actions are vital to building trust in a partnership. By sharing the process of reviewing data, researchers can show how the research is directly impacting schools, and practitioners have an opportunity to share how their experience relates to the data. A good way to do this is by presenting with practitioners at conferences or collaboratively writing manuscripts for peer reviewed journals. For example, we wrote a manuscript (currently under review) with one of our school counselor partners describing how he used EIS data in practice. Through collaboration like this, we find that the purpose and process of research becomes less mysterious, and schools can more easily identify and use practices that are shown to work. In this way, long-term collaboration between partners can ultimately benefit students!


How does the work of the original partnership inform your current work with the National Center for Rural School Mental Health? 

We are bringing what we have learned both in how to be effective partners and to improve the model to the National Center for Rural School Mental Health. For instance, we are developing an intervention hub on our Rural Center website that will allow schools to directly link evidence-based interventions to the data. We learned that having readily available ideas for intervening using the data is an important aspect of success. We have also learned that schools with problem solving teams can implement the model with higher fidelity, so we are developing training modules for schools to learn how to use the data in problem solving teams. We will be taking the comprehensive model to prevent and intervene with youth mental health and using it in rural schools. We will continue to partner with our rural schools to continuously improve the work so that it is feasible, socially valid, and important to rural schools and youth in those schools.


Dr. Wendy Reinke is an Associate Vice Chancellor for Research at the University of Missouri College of Education. Her research focuses on school-based prevention interventions for children and youth with social emotional and behavioral challenges.

Written by Bennett Lunn (Bennett.lunn@ed.gov), Truman-Albright Fellow, National Center for Education Research and National Center for Special Education Research

Access NCES-Led Sessions From the 2021 American Educational Research Association (AERA) Annual Meeting

This past April, several NCES experts presented at the AERA 2021 Virtual Annual Meeting, a 4-day event focused on the theme of “Accepting Educational Responsibility.” Check out their session summaries below and access their presentations from the event.

National Assessment of Educational Progress (NAEP)

Peggy Carr—NCES Associate Commissioner for Assessments—led a session called “Update on NAEP 2021.” Carr explained the rationale for postponing data collection for the Nation’s Report Card during the ongoing coronavirus pandemic, introduced the 2021 Monthly School Survey that provides insight into learning opportunities offered by schools during the pandemic (including an overview of results thus far), and discussed next steps for NAEP.

Common Education Data Standards (CEDS)

Nancy Sharkey—the CEDS Program Lead at NCES—along with her colleagues from AEM and several other research organizations, provided an introduction to the CEDS program and an overview of how states can use CEDS in their policy making and research. Explore their session “Common Education Data Standards: How States Use This Common Vocabulary for Policy and Research” to learn more.

Sharkey also copresented a session called “Developing Informed Data Requests: How to Use Common Education Data Standards and Tools.” Learn about the background of CEDS and explore two of the program’s resources: CEDS Elements and the Align tool.

Statewide Longitudinal Data Systems (SLDS) Grant Program

Kristen King—the SLDS Grant Program Officer at NCES—along with her colleagues from AEM, led a session called “SLDS Capacity Survey: Prerelease Findings” that provided an overview of the SLDS program’s history, goals, and evolution over time. The session also discussed the background and methods of the SLDS State Data Capacity Survey and explored the survey’s prerelease findings.

More information on these topics can be found on the NAEP, CEDS, and SLDS pages of the NCES website. For more information about AERA’s 2021 Virtual Annual Meeting, visit the AERA website.


By Megan Barnett, AIR

Machine-Readable Tables for the Digest of Education Statistics

NCES is excited to announce the release of more than 100 Digest of Education Statistics tables in a new format that makes them easier for researchers to read and use. These tables, known as machine-readable tables (MRT), have a uniform design that allows the data to be read in a standard format.

Each MRT file contains data from one Digest table. In addition to data values, each MRT file includes metadata information pertaining to that particular table. The MRT file, which is an Excel file, includes three tabs:

  •  “MRT-README” tab: provides a brief introduction to MRT and lists all variable names and descriptions used in the table.
  •  “meta” tab: includes all table-specific metadata information, such as the Digest table number and title, general note, data source note, and URL for the corresponding Digest table.
  •  “data” tab: contains all the cell data in a format that is homogeneous across all Digest tables, such as row level headers, column level headers, data values, standard errors, data years, and special notes at the cell level.

The new MRT format facilitates access to and use of Digest table data by software programs. Those seeking to simply view the data or make a simple calculation can continue to access these data in the traditional table format on the Digest of Education Statistics webpage.

There are two ways to access the MRT files, either as a batch or as individual files. To download all available MRT files, visit the Digest MRT webpage. To download individual MRT files, click on the “Download machine readable table” link from the corresponding Digest table’s HTML page (see below).


User feedback is essential to the design of future MRTs (more MRT files will be released in the coming months). NCES welcomes any comments on or suggestions to improve the usability of these tables. For example, NCES is interested in hearing how MRT files are used for research or other applications and any changes that could improve their ease of use. Please contact us with your feedback or questions.  


By Jizhi Zhang and Paul Bailey, AIR

On Being Brief: Skills and Supports for Translating Research to Practice via Brief Reports

Have you ever found yourself at a gathering fumbling to find the words to describe your academic work to family and friends? Do you find it difficult to communicate your scholarship to, and build partnerships with, non-researcher audiences? Are you an early career or seasoned researcher interested in disseminating research to practitioners, policymakers, or community members but struggling to find the best way to do so? Or are you a senior researcher mentoring a trainee through this process?

If your answer to any of these questions is “YES!”, then read on! Writing research briefs is an instrumental part of professional development but, for many researchers, not a formal aspect of training. Drawing on our experience writing research briefs, here are some tips for the challenging, but rewarding, process of translating your research into a brief.


Why Write a Brief?

Research briefs deliver the essence of research findings in a relatable manner to a non-researcher audience. Briefs can

  • Broaden your research’s impact by disseminating findings to non-researcher audiences, including communities historically marginalized in research
  • Strengthen university-community partnerships and relationships by transparently communicating with partners
  • Facilitate future partnerships and employment through increased visibility


What Exactly IS a Research Brief?

A research brief is a concise, non-technical summary of the key takeaways from a research study. Briefs communicate research insights to the public, thereby translating research and evidence-based practices into real-world settings.  

The focus of a brief varies depending on the intended audience., Provide explicit recommendations for practice if you want to reach a practitioner audience. Explore policy and infrastructure needs when writing for a policymaker audience.

Plan to share briefs in diverse settings. Share briefs with research partners (participating districts, schools, teachers), professional networks (at conference presentations), and broader audiences (on personal websites).


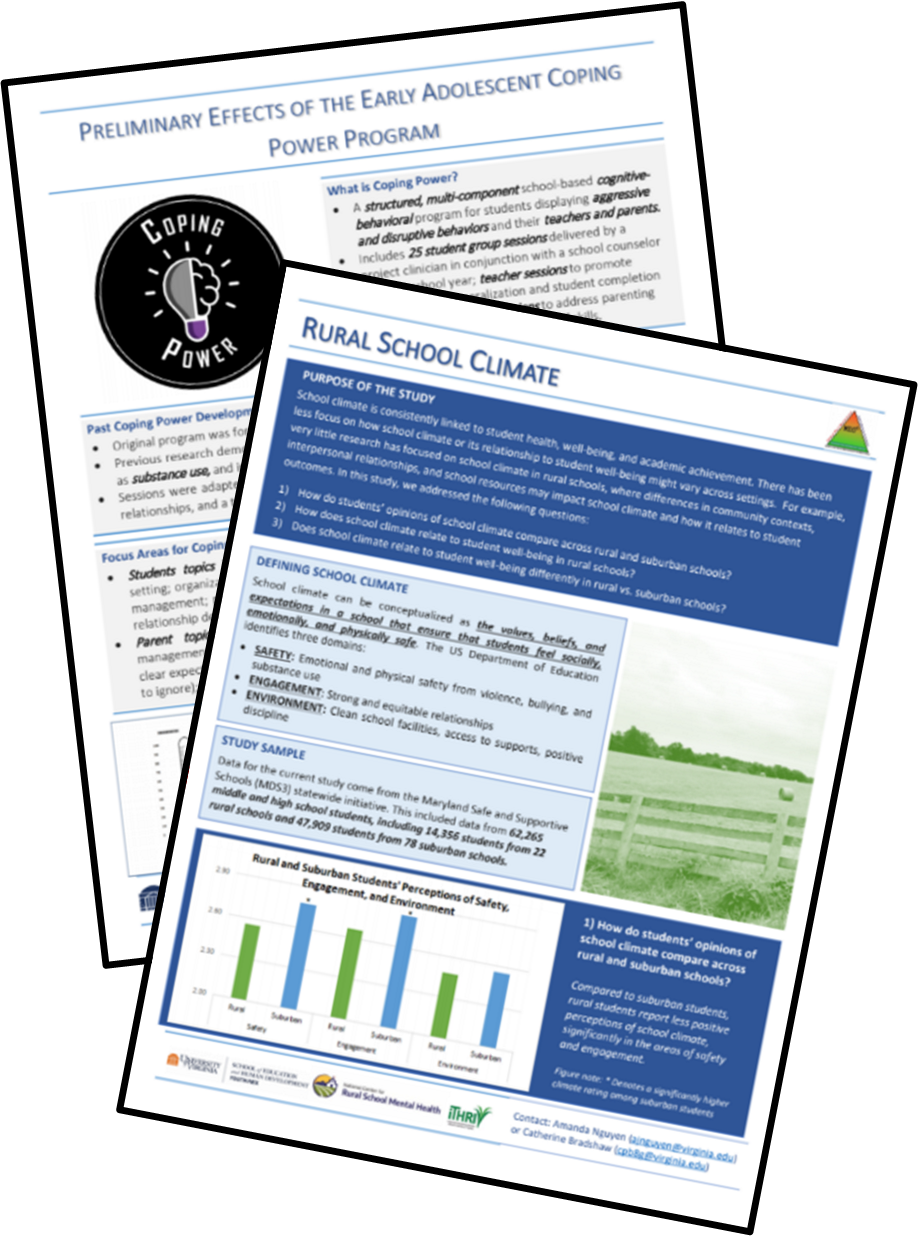
Lead researchers on our research team are part of a statewide partnership to support the dissemination of the Positive Behavioral Interventions and Supports framework. This partnership involves researchers and representatives from the Maryland Department of Education, a large behavioral health organization, and all school districts within the state. Researchers regularly write and share briefs with the statewide group, taking into account evolving needs and interests. Check out some of the briefs here.


Briefs Should Be…


  • Brief. Condensing a full-length manuscript into a two-page document is challenging. But doing so helps distill the study’s real-world implications and identify steps for future work. Two pages is optimal as it can be easily shared as a one-pager when printed.


  • Accessible. Graduate-level coursework in statistics should not be required to understand a brief. The usual audience for briefs will not have the time or energy to absorb methodological details or nuanced theory. Write as if you were presenting to a family member or your favorite high school teacher.


  • Visually appealing. A visual representation of an idea will capture attention better than text and help with brevity. Your paper likely already has some type of visual (for example, a logic model) that you can tweak. If not, pull from your visual-making skills you have already honed when creating posters and conference presentations! This process may have you re-thinking how you visually present your research, even in peer-reviewed publications.


  • A team effort. Individuals bring diverse skills and strengths to the research team. The study’s lead author may be able to articulate results, but a co-author may have the vision to creatively illustrate these findings in a figure. Make use of each member’s skills by making brief-writing an iterative, team effort.


  • Tailored to your audience. If you are developing a brief for a specific audience, ensure that key takeaways and recommendations are relevant and actionable. In some cases, you may have a more technical audience to whom you may present the data more formally. In our own experience, district partners have sometimes asked for more numbers and statistics.


Building Expertise with Brief Writing

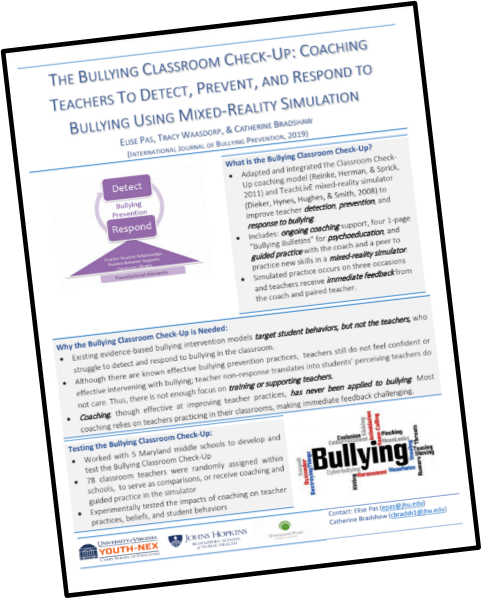
Training in doctoral programs, which often encourages lengthy, detail-oriented writing, runs counter to the skills inherent in writing research briefs. While certain programs offer training for writing for non-academic audiences, we advocate for a greater focus on this skill during graduate training. All of the post-doctoral authors of this blog got their first exposure to writing research briefs on this research team. Inspired by our own on-the-job training, we provide the following recommendations for mentors:  


  • Frame writing the brief as an opportunity. Briefs may feel tangential to the graduate student research mission and challenging to existing skillsets. Thus, the process should be framed as an opportunity to develop an integral set of skills to advance professional development. This will help with motivation as well as execution.


  • Provide a template for the brief that can be easily tweaked and tailored, so that graduate students have a model for the finished product, minimizing formatting issues. Publisher and Word have visually appealing templates for flyers that can be easily populated and organizations that publish briefs may provide templates and layouts. 


  • Know your audience and their interest in the work. The audience should be well-defined (for practitioners, policy makers, or other researchers) and their perspective and interests well-understood. Although knowledge of the audience could come from prior work experience, direct communication with the audience is desirable to gain a firm grasp on their lived experience. If direct interaction is not feasible, mentors should “think aloud” to mentees about which details, words, and images would be most effective and appealing for this audience.  


  • Early scaffolding should be followed by continued support. After being a co-author on a brief, a graduate student can transition to writing their own brief. They may still need support to complete this task autonomously, with continued feedback from mentors and co-authors.


  • Provide graduate students with targeted experiences and formal training opportunities to facilitate proficiency and efficacy in brief-writing. This might include:
    • University-based or paid workshops for students and early career faculty focused on writing for non-academic audiences
    • Opportunities to interface directly with practitioners


Concluding Thoughts

Writing research briefs is a key translational activity for educational researchers, but for many, requires skills not cultivated in formal training. Our research team has embarked on the journey of developing and sharing research briefs regularly over the past few years. This is an evolving and rewarding process for all of us. We hope this post has provided some helpful information as you continue your journey to be brief!


Summer S. Braun is a postdoctoral research associate at YouthNex at the University of Virginia’s School of Education and Human Development. She will be joining the Psychology Department at the University of Alabama as an Assistant Professor.

Daniel A. Camacho is a Licensed Clinical Psychologist and a postdoctoral research associate at the University of Virginia School of Education and Human Development.

Chelsea A.K. Duran is a postdoctoral research associate at the University of Virginia School of Education and Human Development in Youth-Nex: The UVA Center to Promote Effective Youth Development. She will be starting a position with the University of Minnesota in the summer of 2021.

Lora J. Henderson is a Licensed Clinical Psychologist and postdoctoral research associate at the University of Virginia who will soon be starting as an assistant professor in the Department of Graduate Psychology at James Madison University.

Elise T. Pas is an Associate Scientist (research faculty) at the Johns Hopkins University, Bloomberg School of Public Health.

*Note: Authors are listed alphabetically and contributed equally to the preparation of this post.


National Spending for Public Schools Increases for the Sixth Consecutive Year in School Year 2018–19

NCES just released a finance tables report, Revenues and Expenditures for Public Elementary and Secondary Education: FY19 (NCES 2021-302), which draws from data in the National Public Education Financial Survey (NPEFS). The results show that spending1 on elementary and secondary education increased in school year 2018–19 (fiscal year [FY] 2019), after adjusting for inflation. This is the sixth consecutive year that year-over-year education spending increased since 2012–13. This increase follows declines in year-over-year spending for the prior 4 years (2009–10 to 2012–13).

Current expenditures per pupil2 for the day-to-day operation of public elementary and secondary schools rose to $13,187 in FY19, an increase of 2.1 percent from FY18, after adjusting for inflation (figure 1).3 Current expenditures per pupil also increased over the previous year in FY18 (by 0.9 percent), in FY17 (by 1.7 percent), in FY16 (by 2.8 percent), in FY15 (by 2.7 percent), and in FY14 (by 1.2 percent). In FY19, education spending was 11.8 percent higher than the lowest point of the Great Recession in FY13 and 6.1 percent higher than spending prior to the Great Recession in FY10.


Figure 1. National inflation-adjusted current expenditures per pupil for public elementary and secondary school districts: FY10 through FY19

NOTE: Spending is reported in constant FY19 dollars, based on the Consumer Price Index (CPI).
SOURCE: U.S. Department of Education, National Center for Education Statistics, Common Core of Data (CCD), "National Public Education Financial Survey," fiscal years 2010 through 2018 Final Version 2a; and fiscal year 2019, Provisional Version 1a; and Digest of Education Statistics 2019, retrieved January 8, 2021, from https://nces.ed.gov/programs/digest/d19/tables/dt19_106.70.asp.


Without adjusting for geographic cost differences, current expenditures per pupil ranged from $7,950 in Utah to $24,882 in New York (figure 2). In addition to New York, current expenditures per pupil were highest in the District of Columbia ($22,831), New Jersey ($21,331), Vermont ($21,217), and Connecticut ($21,140). In addition to Utah, current expenditures per pupil were lowest in Idaho ($8,043), Arizona ($8,773), Nevada ($9,126), and Oklahoma ($9,203).


Figure 2. Current expenditures per pupil for public elementary and secondary education, by state: FY19

NOTE: These data are not adjusted for geographic cost differences.
SOURCE: U.S. Department of Education, National Center for Education Statistics, Common Core of Data (CCD), “National Public Education Financial Survey (NPEFS),” FY19, Provisional Version 1a and “State Nonfiscal Survey of Public Elementary/Secondary Education,” school year 2018–19, Provisional Version 1a.


These new NPEFS data offer researchers extensive opportunities to investigate state and national patterns of revenues and expenditures. Explore the report and learn more.


[1] Spending refers to current expenditures. Current expenditures comprise expenditures for the day-to-day operation of schools and school districts for public elementary/secondary education, including expenditures for staff salaries and benefits, supplies, and purchased services. Current expenditures include instruction, instruction-related support services (e.g., social work, health, psychological services), and other elementary/secondary current expenditures but exclude expenditures on capital outlay, other programs, and interest on long-term debt.
[2] Per pupil expenditures are calculated using student membership derived from the State Nonfiscal Survey of Public Elementary/Secondary Education. In some states, adjustments are made to ensure consistency between membership and reported fiscal data. More information on these adjustments can be found in the data file documentation at https://nces.ed.gov/ccd/files.asp.
[3] In order to compare spending from one year to the next, expenditures are converted to constant dollars, which adjusts figures for inflation. Inflation adjustments utilize the Consumer Price Index (CPI) published by the U.S. Department of Labor, Bureau of Labor Statistics. For comparability to fiscal education data, NCES adjusts the CPI from a calendar year to a school fiscal year basis (July through June). See Digest of Education Statistics 2019, table 106.70, retrieved January 8, 2021, from https://nces.ed.gov/programs/digest/d19/tables/dt19_106.70.asp.


By Stephen Q. Cornman NCES; Lei Zhou, Activate Research; and Malia Howell, U.S. Census Bureau