The National Household Education Surveys (NHES) program collects nationally representative, descriptive data on the educational activities of children and families in the United States. Specifically, NHES’s Parent and Family Involvement in Education (PFI) survey collects data about how families of K–12 students connect to their child’s school. Parents are asked questions about their involvement in and satisfaction with their child’s school as well as school choice.
This blog expands on the PFI First Look report, and more analysis of race and ethnicity in education and early childhood is available in new web tables.
The results from 2019 PFI survey—which was administered before the coronavirus pandemic—show differences across racial/ethnic groups1 in parents’ satisfaction with their child’s school. Overall, White students tended to have parents who were “very satisfied” with their child’s schools, teachers, and academic standards at the highest rates.
Satisfaction with schools
In 2019, about two-thirds (67 percent) of White students had parents who were “very satisfied” with their child’s school (figure 1). This percentage was higher than the percentages for Hispanic students (64 percent), Asian or Pacific Islander students (61 percent), Black students (59 percent), and “Other race” students2 (57 percent).
A higher percentage of Hispanic students had parents who were “very satisfied” with their child’s school (64 percent) than did Black students (59 percent) and “Other race” students (57 percent).
Figure 1. Percentage of students enrolled in kindergarten through 12th grade whose parent/guardian reported being "very satisfied" with the student’s school, by student’s race/ethnicity: 2019
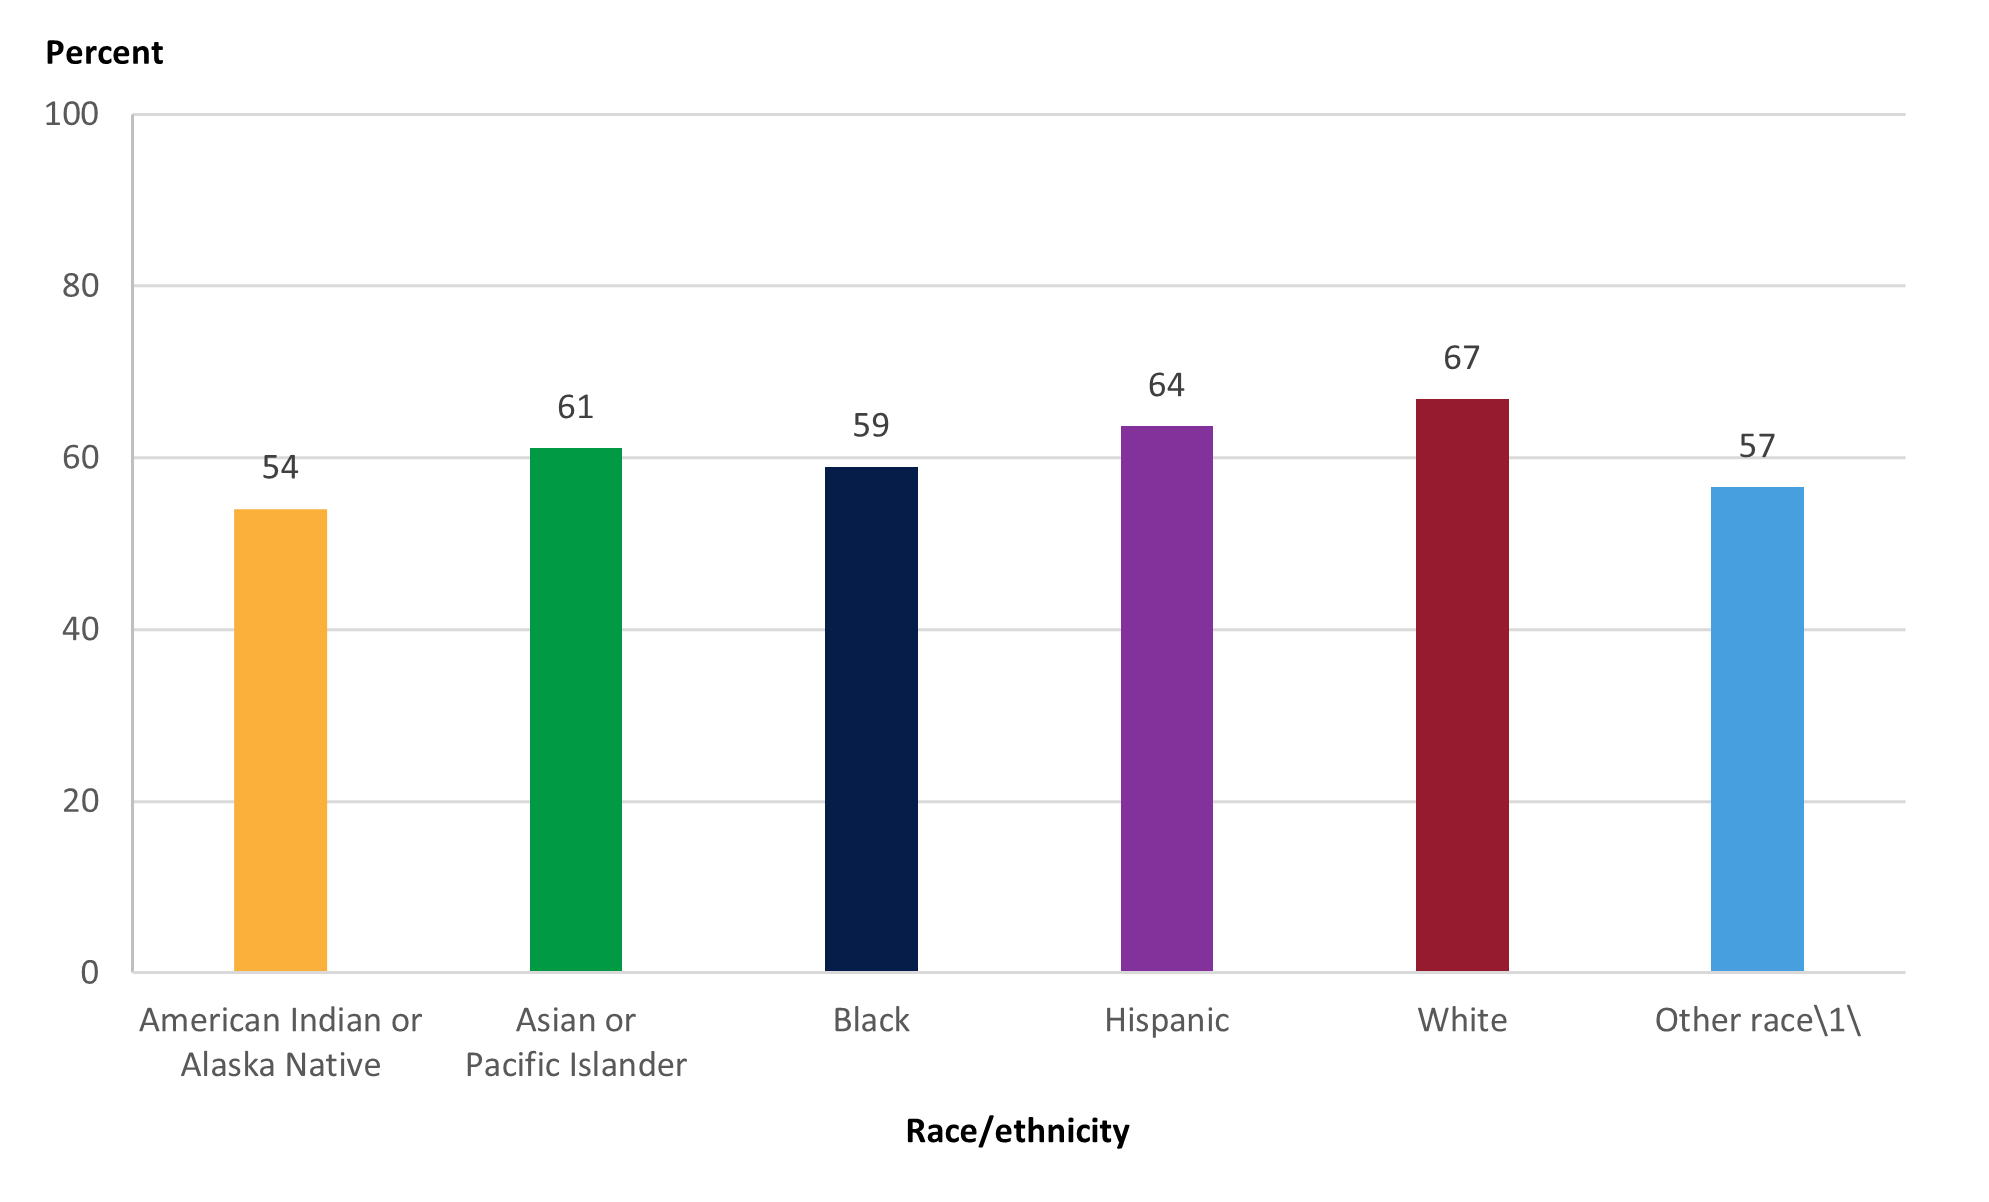
\1\"Other race" includes non-Hispanic students of Two or more races and non-Hispanic students whose parents did not choose any race from the categories provided on the race item in the questionnaire.
NOTE: Race categories exclude persons of Hispanic ethnicity.
SOURCE: U.S. Department of Education, National Center for Education Statistics, Parent and Family Involvement in Education Survey of the National Household Education Surveys Program (PFI-NHES), 2019.
Satisfaction with teachers
Sixty-six percent of White students had parents who were “very satisfied” with their child’s teachers in 2019 (figure 2). This percentage was higher than the percentages for Hispanic students (62 percent), Black students (60 percent), “Other race” students (58 percent), and American Indian or Alaska Native students (49 percent). The percentage for Asian or Pacific Islander students was not measurably different from the percentages for any other racial/ethnic group.
Figure 2. Percentage of students enrolled in kindergarten through 12th grade whose parent/guardian reported being "very satisfied" with the student’s teachers, by student’s race/ethnicity: 2019
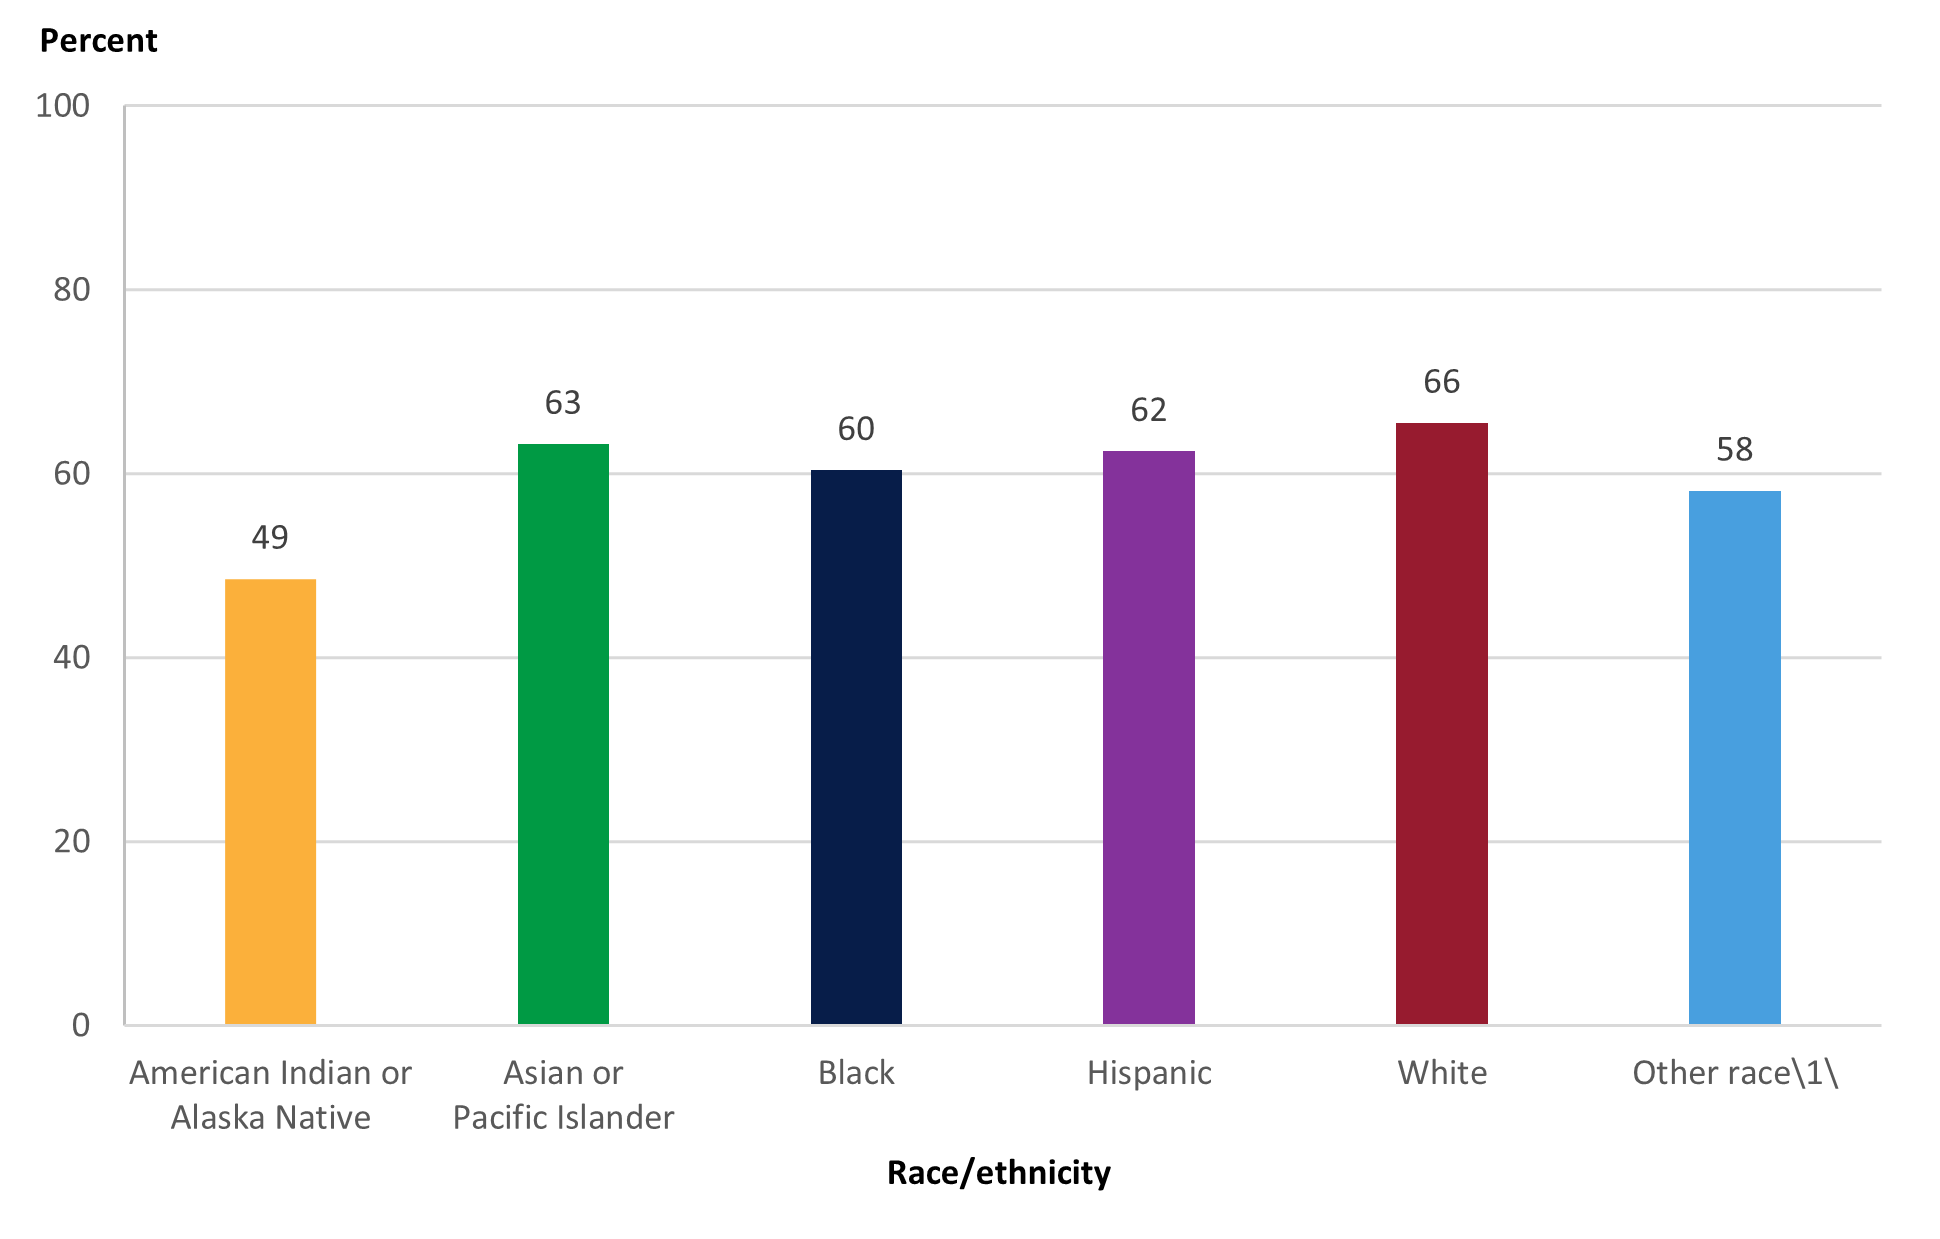
\1\"Other race" includes non-Hispanic students of Two or more races and non-Hispanic students whose parents did not choose any race from the categories provided on the race item in the questionnaire.
NOTE: Race categories exclude persons of Hispanic ethnicity.
SOURCE: U.S. Department of Education, National Center for Education Statistics, Parent and Family Involvement in Education Survey of the National Household Education Surveys Program (PFI-NHES), 2019.
Satisfaction with academic standards
In 2019, about 64 percent of White students had parents who were “very satisfied” with the academic standards of their child’s school (figure 3). This percentage was higher than the percentages for Black students and Hispanic students (60 percent each), Asian or Pacific Islander students (56 percent), and “Other race” students (55 percent). The percentage for American Indian or Alaska Native students was not measurably different from the percentages for any other racial/ethnic group.
Figure 3. Percentage of students enrolled in kindergarten through 12th grade whose parent/guardian reported being "very satisfied" with the academic standards of the student's school, by student’s race/ethnicity: 2019
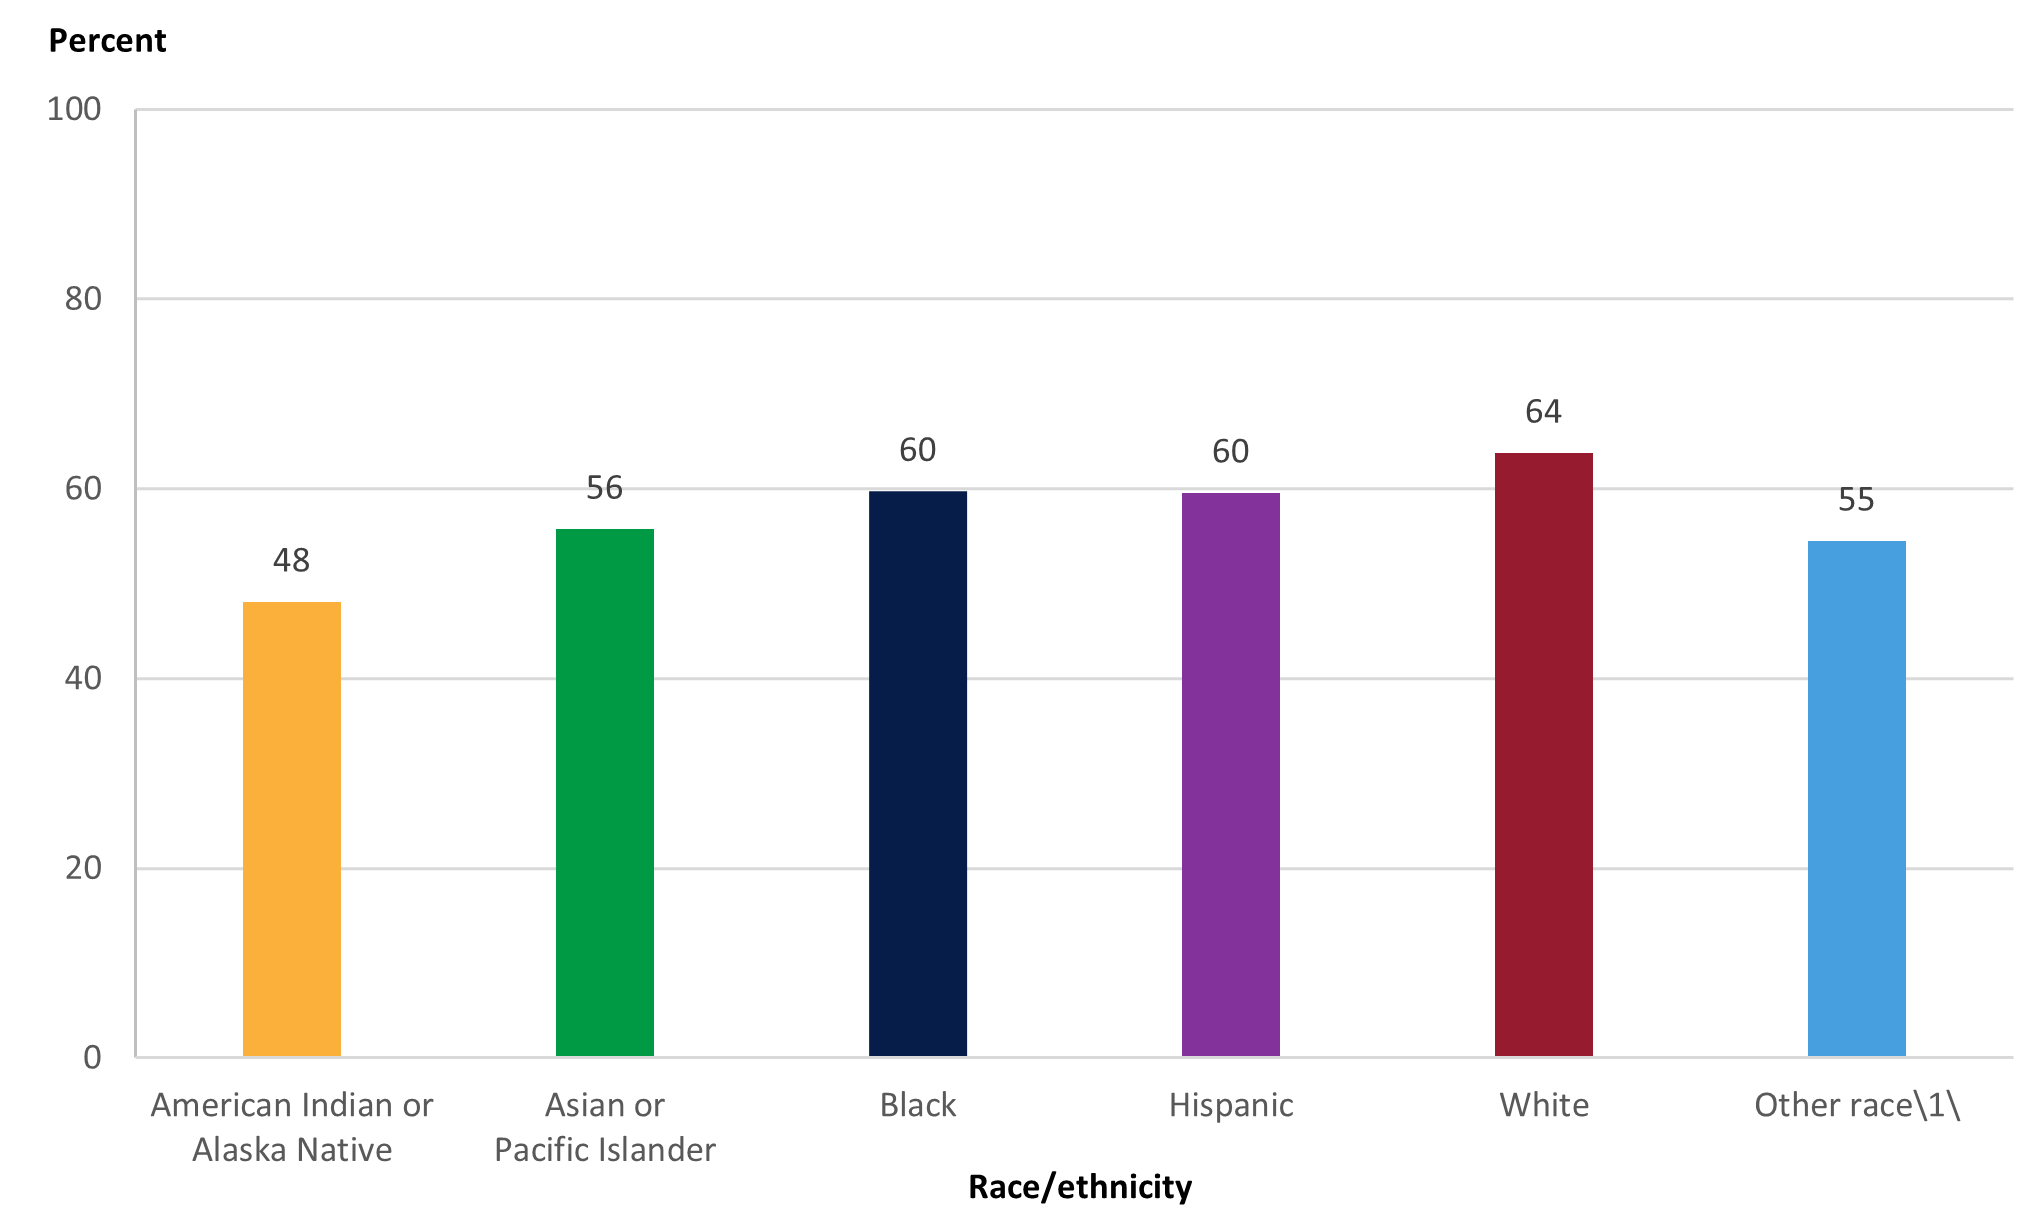
\1\"Other race includes non-Hispanic students of Two or more races and non-Hispanic students whose parents did not choose any race from the categories provided on the race item in the questionnaire.
NOTE: Race categories exclude persons of Hispanic ethnicity.
SOURCE: U.S. Department of Education, National Center for Education Statistics, Parent and Family Involvement in Education Survey of the National Household Education Surveys Program (PFI-NHES), 2019.
Explore the NHES Table Library to find more data about differences in parents’ satisfaction with their child’s school.
[1] Race categories exclude students of Hispanic ethnicity, which are all included in the Hispanic category.
[2] "Other race" includes non-Hispanic students of Two or more races, and non-Hispanic students whose parents did not choose any race from the categories provided on the race item in the questionnaire..
By Rachel Hanson and Jiashan Cui, AIR