IES Blog

Institute of Education Sciences

Data on New Topics in the School Survey on Crime and Safety Shed Light on Emerging Areas of Interest

By Rachel Hansen, NCES; and Melissa Diliberti and Jana Kemp, AIR

For more than 15 years, the National Center for Education Statistics has administered the School Survey on Crime and Safety (SSOCS) to provide timely, high-quality data on crime and safety in U.S. public schools. Information collected on SSOCS includes the frequency and nature of crime; disciplinary actions; crime prevention and the involvement of law enforcement; and challenges to reducing and preventing crime. Conducted with a nationally representative sample of public schools, the sixth, and most recent, administration of SSOCS took place during the 2015–16 school year. The first report highlighting key findings from that survey was released in 2017.

For the 2015–16 survey, we included new and expanded questions on several topics to address emerging policy issues and to identify common practices in school safety, including:

  • School law enforcement, including questions on how schools involve sworn law enforcement officers in daily activities and whether schools outline the responsibilities of these officers at school. For instance, one new item asks whether law enforcement officers routinely wear a body camera, while another item asks if the school has a formalized policy defining officers’ use of firearms while at school;
  • Preventative measures used in public schools, including new questions on more recent security practices. For example, one new item asks schools to report whether they have a threat assessment team to identity students who might be a potential risk for violent or harmful behavior;
  • Preparations for crisis situations, such as whether schools drill students on the use of evacuation, lockdown, and shelter-in-place procedures. Other new items ask whether schools have panic buttons that directly connect to law enforcement and whether they have classroom doors that can be locked from the inside;
  • Student involvement in crime prevention, such as whether schools use peer mediation, student court, restorative circles, or social emotional learning training for students as part of a formal program intended to prevent or reduce violence; and
  • Staff training in discipline policies and practices, including those related to bullying and cyberbullying or strategies for students displaying signs of mental health disorders.

While previous administrations of SSOCS have asked schools to report the number of hate crimes that occurred during a given school year, the 2015–16 questionnaire asked schools to also report the bias (e.g., national origin or ethnicity, gender identity, etc.) that may have motivated these hate crimes. For the first time, the SSOCS questionnaire also asked schools to report the number of arrests that occurred at school.

In addition to these new and expanded questions, SSOCS continues to collect detailed information on schools’ safety practices, the number and type of crime incidents (e.g., sexual assault, physical attack or fight) that occur at school, and the extent to which schools involve law enforcement, parents, and other community groups in their efforts to reduce and prevent crime. To allow for trend comparisons, many items included on SSOCS questionnaires have remained consistent between survey administrations.

Due to the sensitive nature of SSOCS data, researchers must apply for a restricted-use license to access the SSOCS:2016 restricted-use data file. A public-use data file, with some variables removed, was released in March of 2018. Public-use data files from previous SSOCS administrations are also available on the SSOCS website and in DataLab


What is the difference between the ACGR and the AFGR?

By Joel McFarland

NCES and the Department of Education have released national and state-level Average Cohort Graduation Rates for the 2015-16 school year. You can see the data on the NCES website (as well as data from 2010-11 through 2015-16).

In recent years, NCES has released two widely-used annual measures of high school completion: the Adjusted Cohort Graduation Rate (ACGR) and the Averaged Freshman Graduation Rate (AFGR). Both measure the percent of public school students who attain a regular high school diploma within 4 years of starting 9th grade. However, they also differ in important ways. This post provides an overview of how each measure is calculated and why they may result in different rates.

What is the Adjusted Cohort Graduation Rate (ACGR)?

The ACGR was first collected for 2010-11 and is a newer graduation rate measure. To calculate the ACGR, states identify the “cohort” of first-time 9th graders in a particular school year, and adjust this number by adding any students who transfer into the cohort after 9th grade and subtracting any students who transfer out, emigrate to another country, or pass away. The ACGR is the percentage of the students in this cohort who graduate within four years. States calculate the ACGR for individual schools and districts and for the state as a whole using detailed data that track each student over time. In many states, these student-level records have become available at a state level only in recent years. As an example, the ACGR formula for 2012-13 was calculated like this:

Average Cohort Graduation Rate calculation

What is the Averaged Freshman Graduation Rate (AFGR)?

The AFGR uses aggregate student enrollment data to estimate the size of an incoming freshman class, which is compared to the number of high school diplomas awarded 4 years later. The incoming freshman class size is estimated by summing 8th grade enrollment in year one, 9th grade enrollment for the next year, and 10th grade enrollment for the year after, and then dividing by three. The averaging of the enrollment counts helps to smooth out the enrollment bump typically seen in 9th grade. The AFGR estimate is less accurate than the ACGR, but it can be estimated as far back as the 1960s since it requires only aggregate annual counts of enrollment and graduate data. As an example, the AFGR formula for 2012-13 was:

Average Freshman Graduation Rate calculation

Why do they produce different rates?

There are several reasons the AFGR and ACGR do not match exactly.

  • The AFGR’s estimate of the incoming freshman class is fixed, and is not adjusted to account for students entering or exiting the cohort during high school. As a result it is very sensitive to migration trends. If there is net out-migration after the initial cohort size is estimated, the AFGR will understate the graduation rate relative to the ACGR. If there is net in-migration, the AFGR will overstate the graduation rate;
  • The diploma count used in the AFGR includes any students who graduate with a regular high school diploma in a given school year, which may include students who took more or less than four years to graduate. The ACGR includes only those students who graduate within four years of starting ninth grade. This can cause the AFGR to be inflated relative to the ACGR; and
  • The AFGR’s averaged enrollment base is sensitive to the presence of 8th and 9th grade dropouts. Students who drop out in the 8th grade in one year are not eligible to be first-time freshmen the next year, but are included in the calculation of the AFGR enrollment base. At the same time, 9th grade dropouts should be counted as first-time 9th graders, but are excluded from the 10th grade enrollment counts used in the AFGR enrollment base. Since more students typically drop out in 9th grade than in 8th grade, the overall impact is likely to underestimate the AFGR enrollment base relative to the true ACGR cohort.

At the national level, these factors largely balance out, and the AFGR closely tracks the ACGR. For instance, in 2012-13, there was less than one percentage point difference between the AFGR (81.9%) and the ACGR (81.4%). At the state level, especially for small population subgroups, there is often more variation between the two measures.

On the NCES website you can access the most recently available data for each measure, including 2016-17 adjusted cohort graduation rates and 2012-13 averaged freshman graduation rates. You can find more data on high school graduation and dropout rates in the annual report Trends in High School Dropout and Completion Rates in the United States.

This blog was originally posted on July 15, 2015 and was updated on February 2, 2016, December 4, 2017, and January 24, 2019.

Using Game-Based Technologies for Civic Education

It is clear that civic education is a priority in the United States. All U.S. states require students to take a civics or government course and many provide opportunities for students to perform community service or service learning to practice active citizenship.

Screenshot of ECO

However, reports illustrate that many young people are not being adequately prepared as citizens. For example, in the most recent National Assessment of Education Progress (NAEP) in Civics only one-quarter of students reached “proficient” in knowledge of key facts on the U.S. Constitution or the functions of government.

Amid calls to strengthen civic education, IES has funded several interventions that are leveraging technological innovation and game design to engage students. These projects are mainly funded through two IES programs—the Small Business Innovation Research (SBIR) Program and Education Research Grants in Education Technology.

Among the projects IES has funded:

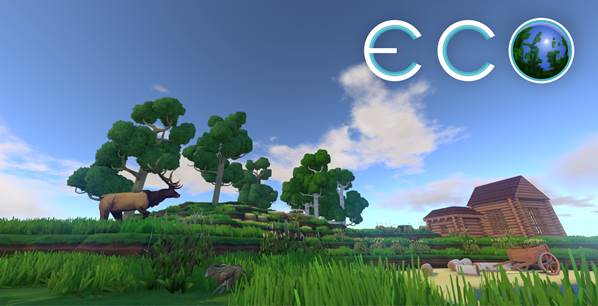
  • ECO (pictured above) is a game-based virtual environment where students collaboratively build a shared civilization and, in the process, apply democratic skills such as making rules and laws, analyzing data, and deliberation (watch video);
  • Discussion Maker is a role-playing game where students debate a civic issue, such as freedom of speech. The technology assigns each student a role, facilitates analysis and using evidence to make an argument, and organizes face-to-face debates and deliberation (watch video);
  • GlobalED2 is a role-playing game addressing a simulated global crisis (e.g., major oil spill or water scarcity) where students act as representatives of different countries governments. Students analyze the issue from the perspective of their country and negotiate with other countries to create a solution (watch video);
  • EcoMUVE is a 3D multi-user virtual pond or forest environment where students apply inquiry-based practices to understand causal patterns in ecological science (watch video); andScreenshot of Up from the Dust
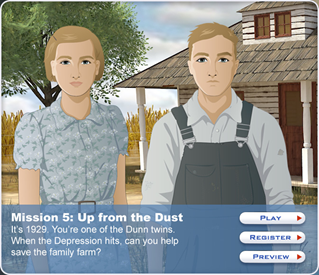
  • Mission US’s Up from the Dust (pictured right) is a historical fiction adventure style game where students take on the role wheat farmers during the Great Depression in Texas 1929, and in doing so guide decisions by learning about the interaction of agriculture, the environment, and how government policies affect the economy (watch video).

Specific design elements of these games offer new ways to stimulate young people’s civic knowledge, skills, and engagement. For example:

All of these interventions employ game-based learning to motivate and engage students in new ways. For example, ECO is an unscripted “sandbox” where students create unique and personalized worlds, while Up from the Dust follows an adventure-based historical story. GlobalED2 and Discussion Maker employ role-playing and EcoMUVE guides inquiry-based virtual and real-world exploration.

Additionally, these programs all seek to build citizenship skills with cross-disciplinary content. For example, ECO, EcoMUVE, and GlobalED2 focus building citizen-science skills such as inquiry and analysis; Discussion Maker can apply content from almost any course within democratic debate; and Up from the Dust immerses students in a storyline with history, economics, and government concepts.

At the same time, these interventions also promote collaborative civic learning by simulating democratic processes for a whole class of students, both virtually and face-to-face. In ECO, students collaborate to create their own government with which they need to maintain through rules and laws. Discussion Maker and GlobalED2 use analysis, deliberation, and debates for individuals and groups of students. In EcoMUVE, students can conduct inquiry-based learning within the virtual environment. In Up from the Dust students engage in group discussions after gameplay to assess how specific decisions influenced results.

Several of these games also allow for feasible classroom implementation of what would otherwise be complex interventions. For example, some of the interventions provide real-time cues to students as they progress through the game, allowing a teacher to focus on facilitating overall instruction rather than coordinating every step of the game for every student.

To learn more about these projects, and to learn more about upcoming funding opportunities for the research and development and evaluation of technologies that support civic learning, visit the IES website or follow IES on Facebook and Twitter @IESResearch

Ed Metz is a Research Scientist at IES, where he leads the SBIR and the Education Technology Research Grants programs. 

Improving the WWC Standards and Procedures

By Chris Weiss and Jon Jacobson

For the What Works Clearinghouse (WWC), standards and procedures are at the foundation of the WWC’s work to provide scientific evidence for what works in education. They guide how studies are selected for review, what elements of an effectiveness study are examined, and how systematic reviews are conducted. The WWC’s standards and procedures are designed to be rigorous and reflective of best practices in research and statistics, while also being aspirational to help point the field of education effectiveness research toward an ever-higher quality of study design and analysis.

To keep pace with new advances in methodological research and provide necessary clarifications for both education researchers and decision makers, the WWC regularly updates its procedures and standards and shares them with the field. We recently released Version 4.0 of the Procedures and Standards Handbooks, which describes the five steps of the WWC’s systematic review process.

For this newest version, we have divided information into two separate documents (see graphic below).  The Procedures Handbook describes how the WWC decides which studies to review and how it reports on study findings. The Standards Handbook describes how the WWC rates the evidence from studies.

The new Standards Handbook includes several improvements, including updated and overhauled standards for cluster-level assignment of students; a new approach for reviewing studies that have some missing baseline or outcome data; and revised standards for regression discontinuity designs. The new Procedures Handbook includes a revised discussion of how the WWC defines a study.  All of the changes are summarized on the WWC website (PDF).

Making the Revisions

These updates were developed in a careful, collaborative manner that included experts in the field, external peer review, and input from the public.

Staff from the Institute of Education Sciences oversaw the process with the WWC’s Statistical, Technical, and Analysis Team (STAT), a panel of highly experienced researchers who revise and develop the WWC standards. In addition, the WWC sought and received input from experts on specific research topics, including regression discontinuity designs, cluster-level assignment, missing data, and complier average causal effects. Based on this information, drafts of the standards and procedures handbooks were developed.

External peer reviewers then provided input that led to additional revisions and, in the summer, the WWC posted drafts and gathered feedback from the public. The WWC’s response to some of the comments is available on its website (PDF).   

Version 4.0 of the Handbooks was released on October 26. This update focused on a few key areas of the standards, and updated and clarified some procedures. However, the WWC strives for continuous improvement and as the field of education research continues to evolve and improve, we expect that there will be new techniques and new tools incorporated into future versions the Handbooks.

Your thoughts, ideas, and suggestions are welcome and can be submitted through the WWC help desk.

Expanding Student Success Rates to Reflect Today’s College Students

By Gigi Jones

Since the 1990s, the Integrated Postsecondary Education Data System (IPEDS) has collected and published graduation rates for colleges and universities around the country. These rates were based on traditional college students—first-time, full-time degree- or certificate-seeking undergraduate students (FTFT) who, generally, enrolled right after high school.

While these data are insightful, some have argued the FTFT graduation rate only provides a part of the picture because it doesn’t consider non-traditional students, including those who are part-time students and transfers. This is an important point because, over the past decade, the number of non-traditional students has outpaced the increase in traditional students, mostly driven by growth in those who have transferred schools.  

The new IPEDS Outcome Measures survey was designed to help answer these changes. Starting with the 2015-16 collection cycle, entering students at more than 4,000 degree-granting institutions must be reported in one of four buckets, also called cohorts (see Figure below).

The FTFT cohort is similar to what has been collected since the 1990s, but the Outcome Measures adds three new student groups to the equation: 

  • First-time, part-time students (FTPT), who attend less than a full-time credit workload each term (typically less than 12-credits) and who have no prior postsecondary attendance; 
  • Non-first-time students, also known as transfer-in students, who are enrolled at a full-time level (NFTFT); and
  • Non-first-time students, also known as transfer-in students, who are enrolled at a part-time level (NFTPT).

For these four cohorts, postsecondary institutions report the awards conferred at two points of time after the students entered the institution: 6 years and 8 years. If students did not receive an award, then institutions must report their enrollment status one of three ways: 1) Still enrolled at the same institution; 2) Transferred out of the institution; or 3) Enrollment status is unknown.

These changes help respond to those who feel that the FTFT graduation rates do not reflect the larger student population, in particular public 2-year colleges that serve a larger, non-traditional college student population. Since 2008, steps have been taken to construct and refine the data collection of non-traditional college students through a committee of higher education experts (PDF) and public Technical Review Panels (see summaries for panels 37, 40 and 45).

The 2016-17 preliminary Outcome Measures data were released on October 12, as part of a larger report on IPEDS winter data collection. The data for individual schools can be found on our College Navigator site.  The final data for 2015-16 will be released in early 2018. Sign up for the IES News Flash to be notified when the new data are released or follow IPEDS on Twitter. You can also visit the IPEDS Outcome Measures website for more information. 

While this is an important step in the process, we are continuing to improve the data collection process. Starting with the 2017-18 Outcome Measures collection, the survey includes more groups (i.e., Pell Grant v. Non-Pell Grant recipients), a third award status point (4-years after entry), and the identification of the type of award (i.e., certificates, Associate’s, and Bachelor’s). Watch for the release of these data in fall 2018. 

EDITOR'S NOTE: This post was updated on October 12 to reflect the release of Outcome Measures data.