For decades, student assessments have looked the same: multiple-choice or short-answer questions administered with pencil and paper, with all students receiving a common group of questions. Today, innovations in assessment design, greater understanding in the learning sciences, and new technology have all contributed to the way that assessments are administered and taken, and how the resulting information is shared with teachers, students, and families.
Since 2002, the Institute of Education Sciences (IES) has made more than 100 awards for the development of new assessments that are driven and delivered through technology. The awards were made to a mix of academic researchers, entrepreneurial firms, and larger education research organizations. All of the projects included a rigorous research and development process, with studies to validate that assessments are measuring what is intended and pilots to test the promise of the technologies for improving student learning outcomes.
To highlight some of the technology-delivered assessments, IES has created YouTube Playlists that feature 57 videos in seven areas:
The assessments highlighted are delivered via mobile apps or through web-based computers and administered for different purposes. Some are diagnostic assessments used to screen students at the start of a new unit or year to identify areas where students struggle or areas to target with intervention. Many serve as performance assessments to determine how well students analyze information and draw conclusions when engaging in complex scenario-based activities. Others are summative assessments used to measure student performance during and at the end of the school year. Many also include a formative assessment component that adjusts based on the level of performance, and are designed to provide feedback and cues to students to inform the learning process.
A good number of the assessments are administered as simulations, games, scenarios, and puzzles, allowing for complex challenges where students can demonstrate mastery of knowledge and skills. Several enable new opportunities for assessment through the application of technological advances, such as natural language processing and machine-learning, read-aloud stories, fast-paced tasks that require students to respond, and speech recognition programs. Many save classroom time because the assessments are self-administered, and teachers benefit from the automatic grading as students go. Most of the assessments also provide teachers information to guide practice through data dashboards or generated reports. Several of the assessments are already being used in school around the country.
Below are highlights from each of the playlists. It is important to note that none of assessments highlighted are wide enough in scope or configured to measure the full depth and breadth of State learning standards. Therefore, they are not sufficient to replace statewide summative assessments used for accountability and reporting purposes. Collectively, however, the examples highlight the promise of technology-delivered assessments to improve and expand on existing approaches for measuring student learning and social and emotional skills, and for informing teacher instruction.
Mathematics and Science
ASSISTments is web-based mathematics platform that assesses and then provides immediate feedback to students in grades 3-12, and generates teacher reports use to inform instruction.
SimScientists is a simulation platform that formatively and summatively assesses science inquiry skills and knowledge aligned to middle school Next Generation Science Standards.
Reading and Writing
RAPID is an adaptive literacy diagnostic and summative assessment system for students in Kindergarten through grade 12.
Revision Assistant provides automated sentence-level in-line feedback to students during writing tasks aligned to Common Core State Standards.
Social and Emotional Development
VESIP is a web-based simulated environment that measures the ability of students in grade 3-7 to interpret social cues which research demonstrates are needed to resolve conflicts.
Early Learning
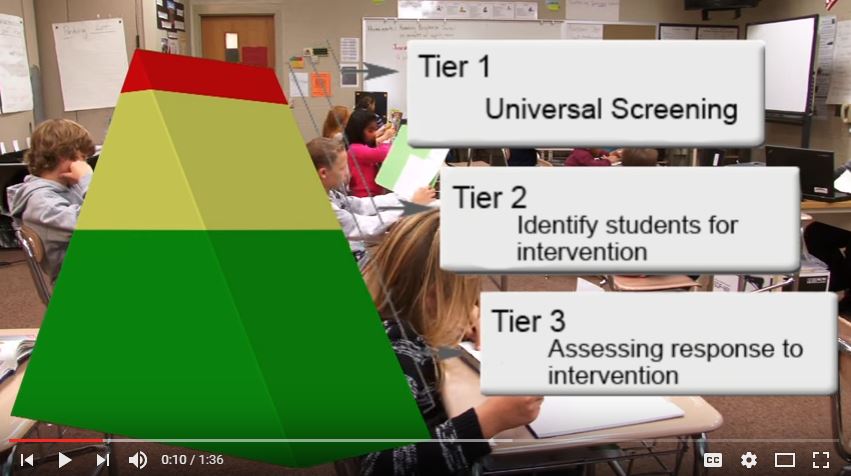
The School Readiness Curriculum Based Measurement System provides universal screening, benchmarking, and progress monitoring in language, literacy, mathematics, and science, for students in Pre-K and Kindergarten students.
English Learning
ONPAR assesses the science and mathematics content knowledge and skills of English- and Spanish- speaking students using hyperlinks and animations to make questions accessible to all students.
Tools for Teacher Practice
CLASS 5.0 automatically analyzes classroom discourse (student and teacher talking during class) and provides reliable profiles to guide and optimize how teachers lead instruction.
Students With Disabilities or At Risk for Disabilities
NumberShire is a game-based mathematics intervention for students with, or at risk for, disabilities in Kindergarten through Grade 2. The game embeds instructional supports such as providing explicit, systematic, and frequent instruction, goal setting, and allowing students to work at their own pace.
AnimalWatchVi Suite is an iPad app covering pre-algebra mathematics for middle and high school students with visual impairments. The app includes accommodation tools such as problem narration, audio hints, braille, and tactile graphics to provide accessible assessment.
Written by Edward Metz, ED/IES SBIR program manager and IES Education Technology topic program officer.