IES Blog

Institute of Education Sciences

Rescaled Data Files for Analyses of Trends in Adult Skills

In January 2022, NCES released the rescaled data files for three adult literacy assessments conducted several decades earlier: the 1992 National Adult Literacy Survey (NALS), the 1994 International Adult Literacy Survey (IALS), and the 2003 Adult Literacy and Lifeskills Survey (ALL). By connecting the rescaled data from these assessments with data from the current adult literacy assessment, the Program for the International Assessment of Adult Competencies (PIAAC), researchers can examine trends on adult skills in the United States going back to 1992. This blog post traces the history of each of these adult literacy assessments, describes the files and explains what “rescaling” means, and discusses how these files can be used in analyses in conjunction with the PIAAC files. The last section of the post offers several example analyses of the data.

A Brief History of International and National Adult Literacy Assessments Conducted in the United States

The rescaled data files highlighted in this blog post update and combine historical data from national and international adult literacy studies that have been conducted in the United States.

NALS was conducted in 1992 by NCES and assessed U.S. adults in households, as well as adults in prisons. IALS—developed by Statistics Canada and ETS in collaboration with 22 participating countries, including the United States—assessed adults in households and was administered in three waves between 1994 and 1998. ALL was administered in 11 countries, including the United States, and assessed adults in two waves between 2003 and 2008.

PIAAC seeks to ensure continuity with these previous surveys, but it also expands on their quality assurance standards, extends the definitions of literacy and numeracy, and provides more information about adults with low levels of literacy by assessing reading component skills. It also, for the first time, includes a problem-solving domain to emphasize the skills used in digital (originally called “technology-rich”) environments.

How Do the Released Data Files From the Earlier Studies of Adult Skills Relate to PIACC?

All three of the released restricted-use data files (for NALS, IALS, and ALL) relate to PIAAC, the latest adult skills assessment, in different ways.

The NALS data file contains literacy estimates and background characteristics of U.S. adults in households and in prisons in 1992. It is comparable to the PIAAC data files for 2012/14 and 2017 through rescaling of the assessment scores and matching of the background variables to those of PIAAC.

The IALS and ALL data files contain literacy (IALS and ALL) and numeracy (ALL) estimates and background characteristics of U.S. adults in 1994 (IALS) and 2003 (ALL). Similar to NALS, they are comparable to the PIAAC restricted-use data (2012/14) through rescaling of the literacy and numeracy assessment scores and matching of the background variables to those of PIAAC. These estimates are also comparable to the international estimates of skills of adults in several other countries, including in Canada, Hungary, Italy, Norway, the Netherlands, and New Zealand (see the recently released Data Point International Comparisons of Adult Literacy and Numeracy Skills Over Time). While the NCES datasets contain only the U.S. respondents, IALS and ALL are international studies, and the data from other participating countries can be requested from Statistics Canada (see the IALS Data Files/Publications and ALL Data pages for more detail). See the History of International and National Adult Literacy Assessments page for additional background on these studies. 

Table 1 provides an overview of the rescaled NALS, IALS, and ALL data files.


Table 1. Overview of the rescaled data files for the National Adult Literacy Survey (NALS), International Adult Literacy Survey (IALS), and Adult Literacy and Lifeskills Survey (ALL) 

Table showing overview of the rescaled data files for the National Adult Literacy Survey (NALS), International Adult Literacy Survey (IALS), and Adult Literacy and Lifeskills Survey


What Does “Rescaled” Mean?

“Rescaling” the literacy (NALS, IALS, ALL) and numeracy (ALL) domains from these three previous studies means that the domains were put on the same scale as the PIAAC domains through the derivation of updated estimates of proficiency created using the same statistical models used to create the PIAAC skills proficiencies. Rescaling was possible because PIAAC administered a sufficient number of the same test questions used in NALS, IALS, and ALL.1 These rescaled proficiency estimates allow for trend analysis of adult skills across the time points provided by each study.

What Can These Different Files Be Used For?

While mixing the national and international trend lines isn’t recommended, both sets of files have their own distinct advantages and purposes for analysis.

National files

The rescaled NALS 1992 files can be used for national trend analyses with the PIAAC national trend points in 2012/2014 and 2017. Some potential analytic uses of the NALS trend files are to

  • Provide a picture of the skills of adults only in the United States;
  • Examine the skills of adults in prison and compare their skills with those of adults in households over time, given that NALS and PIAAC include prison studies conducted in 1992 and 2014, respectively;
  • Conduct analyses on subgroups of the population (such as those ages 16–24 or those with less than a high school education) because the larger sample size of NALS allows for more detailed breakdowns along with the U.S. PIAAC sample;
  • Focus on the subgroup of older adults (ages 66–74), given that NALS sampled adults over the age of 65, similar to PIAAC, which sampled adult ages 16–74; and
  • Analyze U.S.-specific background questions (such as those on race/ethnicity or health-related practices).

International files

The rescaled IALS 1994 and ALL 2003 files can be used for international trend analyses among six countries with the U.S. PIAAC international trend point in 2012/2014: Canada, Hungary, Italy, Norway, the Netherlands, and New Zealand. Some potential analytic uses of the IALS and ALL trend files are to

  • Compare literacy proficiency results internationally and over time using the results from IALS, ALL, and PIAAC; and
  • Compare numeracy proficiency results internationally and over time using the results from ALL and PIAAC.

Example Analyses Using the U.S. Trend Data on Adult Literacy

Below are examples of a national trend analysis and an international trend analysis conducted using the rescaled NALS, IALS, and ALL data in conjunction with the PIAAC data.

National trend estimates

The literacy scores of U.S. adults increased from 269 in NALS 1992 to 272 in PIAAC 2012/2014. However, the PIAAC 2017 score of 270 was not significantly different from the 1992 or 2012/2014 scores.


Figure 1. Literacy scores of U.S. adults (ages 16–65) along national trend line: Selected years, 1992–2017

Line graph showing literacy scores of U.S. adults (ages 16–65) along national trend line for NALS 1992, PIAAC 2012/2014, and PIAAC 2017

* Significantly different (p < .05) from NALS 1992 estimate.
SOURCE: U.S. Department of Education, National Center for Education Statistics, National Adult Literacy Survey (NALS), NALS 1992; and Program for the International Assessment of Adult Competencies (PIAAC), PIAAC 2012–17.


International trend estimates

The literacy scores of U.S. adults decreased from 273 in IALS 1994 to 268 in ALL 2003 before increasing to 272 in PIAAC 2012/2014. However, the PIAAC 2012/2014 score was not significantly different from the IALS 1994 score.


Figure 2. Literacy scores of U.S. adults (ages 16–65) along international trend line: Selected years, 1994–2012/14

Line graph showing literacy scores of U.S. adults (ages 16–65) along international trend line for IALS 1994, ALL 2003, and PIAAC 2012/2014

* Significantly different (p < .05) from IALS 1994 estimate.
SOURCE: U.S. Department of Education, National Center for Education Statistics, Statistics Canada and Organization for Economic Cooperation and Development (OECD), International Adult Literacy Survey (IALS), 1994–98; Adult Literacy and Lifeskills Survey (ALL), 2003–08; and Program for the International Assessment of Adult Competencies (PIAAC), PIAAC 2012/14. See figure 1 in the International Comparisons of Adult Literacy and Numeracy Skills Over Time Data Point.


How to Access the Rescaled Data Files

More complex analyses can be conducted with the NALS, IALS, and ALL rescaled data files. These are restricted-use files and researchers must obtain a restricted-use license to access them. Further information about these files is available on the PIAAC Data Files page (see the “International Trend Data Files and Data Resources” and “National Trend Data Files and Data Resources” sections at the bottom of the page).

Additional resources:

By Emily Pawlowski, AIR, and Holly Xie, NCES


[1] In contrast, the 2003 National Assessment of Adult Literacy (NAAL), another assessment of adult literacy conducted in the United States, was not rescaled for trend analyses with PIAAC. For various reasons, including the lack of overlap between the NAAL and PIAAC literacy items, NAAL and PIAAC are thought to be the least comparable of the adult literacy assessments.

Becoming a Citizen: Creating a Curriculum for Adult Civics Courses

As we return from our celebration of Independence Day, we also want to celebrate the efforts and dedication of the learners and educators who participate in adult literacy’s integrated English literacy and civics education. This important, but sometimes forgotten, aspect of adult education opens opportunities for learners and creates an engaged, informed citizenry.

What is “integrated civics” in adult education?

Under Title II of the 2014 Workforce Innovation and Opportunity Act (WIOA), integrated English literacy and civics education refers to services for adult English language learners, including professionals with degrees and credentials in their native countries, to build their English language skills—foundational and more advanced—to support their roles as parents, workers, and citizens in the United States. These courses must include English literacy instruction and “instruction on the rights and responsibilities of citizenship and civic participation and may include workforce training.”

Are there specific curricula for these programs?

Although WIOA defined what had and could be included in this form of adult education, it did not specify how to include it. Nor did WIOA mandate a particular curriculum or instructional practices. Thus, programs offering these courses may leverage resources from multiple sources and design approaches to meet their communities’ needs.

Luckily, both the Office of Career, Adult, and Technical Education (OCATE, U.S. Department of Education) and the U.S. Citizen and Immigrations Services (USCIS, Department of Homeland Security) have developed resources and standards to help educators.

Though multiple guides, online education resources, and other teaching materials are available, the evidence base and promise of these is not always apparent.  

Is IES supporting research in this area?

In FY21, IES awarded a research grant, Content-Integrated Language Instruction for Adults with Technology Support (CILIA-T), to Dr. Aydin Durgunoglu (University of Minnesota). She and her team of researchers and educators are developing and pilot testing a curriculum that aims to strengthen English language proficiency, knowledge of U.S. history and civics, and digital literacy. This project, which is part of the CREATE Adult Skills Research Network, is the first field-initiated research project IES has funded for adult English learners or adult civics.

Why is integrating language and civics important?

A fundamental instructional practice in adult education is to link instruction to activities and goals highly relevant to the adult learner. For refugees, immigrants, and others new to the United States, becoming a citizen and being able to communicate with others are both highly relevant goals and both daunting tasks. By blending the two, these courses may help adults persist longer and gain knowledge in skills in multiple domains concurrently.

Dr. Durgunglu notes—

I don’t think conversational skills are enough for refugees or immigrants as they learn to navigate in their new communities. To be participatory citizens, they need “academic” English, especially about rights and responsibilities. To really belong to a community, individuals need to know their rights so that they are not exploited and know their responsibilities such as voting and participating in the community activities. Knowing how the system works help people contribute to different type of the decision-making processes, from selecting schoolbooks to selecting a president.

On a personal note, as a naturalized citizen who learned about U.S. history and civics and then took the citizenship exam, these topics really helped me understand the American psyche, such as the individualistic streak that goes back to the pioneers, why government’s role in social services is so controversial in this country, and why one state can be so different from another. Having experienced censorship and autocratic governments, I have a lot of respect for the principle of checks and balances and am aware how fragile democracy and individual rights can really be if not protected dearly.

Where can people learn more?

To learn more about CILIA-T, visit the ABE Teaching & Learning Advancement Systems article: Civics/History Curriculum: An Introduction to the CILIA-T Curriculum Project.

To learn more about the CREATE Adult Skills Research Network, please visit the network lead’s site.

For additional resources, visit the U.S. Department of Education’s LINCS website, which includes items about civics education, English language learners, and other topics relevant to adult education.

For additional information and resources about the citizenship test and courses, visit the USCIS Citizenship Resource Center.


Written by Meredith Larson (meredith.larson@ed.gov), adult education research analyst and program officer for the CREATE Adult Skills Research Network.

LGBTQ+ Education Research: Why I’m Proud to be a Part of It

This year, Inside IES Research is publishing a series of blogs showcasing a diverse group of IES-funded education researchers and fellows that are making significant contributions to education research, policy, and practice. In celebration of PRIDE month, three IES training fellows reflect on the state of education research for LGBTQ+ students and what motivates them to pursue this area.

Damon R. Carbajal (he/él) is a community scholar, educator, activist, and alumni of the University of New Mexico, Research Institute for Scholars of Equity (RISE) program, residing in Albuquerque, New Mexico, whose work focuses on recentering intersectional identities in and out of educational spaces. Souksavanh T. Keovorabouth (they/them), Diné, completed the University of Arizona Pathways to Doctoral Studies in Education-Related Fields and is currently a PhD candidate at both Oregon State University and Macquarie University (Sydney, Australia) as a Cotutelle Student, whose research focuses on the Indigenous urban experience, Two-Spirit wellbeing and Two-Spirit in urban areas, Relocation Act 1950, Native and Queer urbanization, BIPOC masculinities, and missing and murdered Indigenous women. Sarah Rosenbach (she/her) is a PhD candidate in psychology and social intervention at New York University, where she was a fellow in the NYU Predoctoral Interdisciplinary Research Training Program in Education Sciences during her first 4 years of graduate study, and is currently based in Honolulu, HI and researching evidence-based ways in which schools and other youth-serving settings can support the healthy development of LGBTQ adolescents.


What excites you about education research relevant to LGBTQ+ communities?

Damon R. Carbajal (DRC): As a gay, queer, Chicanx person, I have not had the easiest time in school and often felt I was voiceless. I see research as a powerful tool to help create safer spaces for all in education spaces. This is what keeps me going and what creates my deep connection to my research because I know that it helps to create spaces and opportunities that I did not have. Allowing folks to voice their lived experiences is critical for the growth of academia, research, and individuals. Overall, my excitement comes from the community we form when decentered voices are recentered in holistic ways that project the beauty and resilience of the queer community. This recentering is at the heart of all my work, and the impact is critical.


Souksavanh T. Keovorabouth (STK): What excites me is that I am able to bring in my own experience and experiences of other Queer Indigenous people into the light. Many Queer, Trans, and Two-Spirit Indigenous people have been erased, even by our own communities. Two-Spirit is an umbrella term used to signify the vast diverse set of genders, sexes, and sexualities within Indigenous communities pre-colonialization. We use this term to bring that history into the present. I focus on urban Indigenous LGBTQ2S+ communities because many of us have been or are displaced and removed based on our diverse gender, sex, and sexuality selves and we need to (re)establish communities of care. Through our tracing of histories and lineages, we can see that Two-Spirit people are vital to our true restoration of Indigenous sovereignty.


Sarah Rosenbach (SR): I am excited for the field to begin to translate this evidence to practice in teams of interdisciplinary researchers who are in partnership with educators and community organizations. Schools are perhaps the single most studied context for LGBTQ+ youth. Together with my collaborators, I have contributed to a growing body of research focused on the state of LGBTQ+ youth experiences in schools. I have been fortunate to work with an amazing team of LGBTQ+ folks in education, psychology, public health, and sociology. The ability to show up to this work as my true self and to work towards improving school experiences for LGBTQ+ youth in community is very meaningful to me. With a groundswell of empirical support building across disciplines, we have reached a critical turning point for action. I am excited for the field to begin to translate this evidence to practice in teams of interdisciplinary researchers who are in partnership with educators and community organizations. I believe that it is time for us to turn to creating and testing school-based prevention, intervention, and health promotion programs that specifically examine – and alter - the ways that schools socialize cisnormativity and heteronormativity in the lives of all youth.

How has being a member of or ally to the LGBTQ+ community influenced your path as researcher?

DRC: As a gay, queer, Chicanx researcher, educator, and activist, I believe that being a member of the LGBTQ+ community has influenced my research in a variety of ways including the research I focus on as well as the idea of even jumping into research. When I first started college, I wanted to be a high school teacher and had not thought about anything else. During undergrad, I had research fellowships and mentorship experiences that helped me realize that I could create more safe spaces and reach more students and educators through a research path. This realization was life altering and allowed me to grow into a researcher whose queer and BIPOC roots grant me insights that are new and authentic because of my social awareness and new perspectives. As a researcher, I can draw upon my life experiences, which include trauma, assault, and other facets of life—facets of my life that are sadly the reality of many who are in the LGBTQ+ and other marginalized communities.

Because of my identity, I feel I am more likely to pursue topics that have often been overlooked or viewed as taboo. For example, my thesis examined LGBTQIA+ Mexican/x youth experiences of mental health in and out of schooling settings. Highly intersectional research such as this is not heavily represented in the field, except by researchers who are often members of the non-dominant communities. Overall, being an LGBTQ+ researcher can be taxing as I am often the only queer and/or Chicanx person in research spaces, but always highly rewarding because I am able to make a mark in the research world for and by my community.

STK: Being Queer and Nadleeh (Two-Spirit in Navajo language) influences my research because these aspects of me grant me the ability to draw upon stories and experiences to navigate the world outside of western construction of gender, sex, and sexuality. My research journey began in 2016. I was not feeling safe as a Queer, Brown, multiracial person, and I knew that others were feeling the same way, especially as policy debates and political actions, such as those reported by the Fenway Institute, took shape. We were being marginalized and erased, and this impacts mental health. Research indicates that LGBTQ+ youth are 4 times more likely to attempt suicide than their straight peers and that Indigenous LGBTQ+ youth are 2.5 more likely than their non-Indigenous LGBTQ+ peers. The Trevor Project survey also found that Indigenous youth who were accepted by their family and communities were nearly 60 percent less likely to attempt suicide. These numbers have really fueled the work that I do because I am able to use my voice and scholarship to give back to my communities and address their needs and support them. My identities have and continue to influence my path as a researcher because this is for all my community to move from having to survive to beginning to thrive. When I am done with my PhDs, I aim to continue writing, teaching, and working with my community through my research on Queer, Trans, and Two-Spirit identity, as we are vital to Indigenous futures.

SR: We are seeing a nationwide onslaught of anti-LGBTQ+ legislation aimed at dismantling hard-earned yet tenuous civil rights and coordinated with efforts to dismantle culturally responsive pedagogy and antiracist education. It is critical for all of us, those in the LGBTQ+ community and allies, to speak out in support of all LGBTQ+ youth with our local reporters, school boards, city councils, and state legislatures. But this is just one part of the solution. We must continually ask our LGBTQ+ community, “How may I better serve you?” and let the answers drive our scholarship and our activism. We must partner with movements in antiracist and decolonizing education. Together, we can leverage our scholarship and activism to reimagine our education systems towards justice for all.


Produced by Meredith Larson (Meredith.Larson@ed.gov), a program officer for IES Postdoctoral Training grants.

Public State and Local Education Job Openings, Hires, and Separations for December 2021

The Job Openings and Labor Turnover Survey (JOLTS),1 conducted by the U.S. Bureau of Labor Statistics (BLS), provides monthly estimates of job openings, hires, and total separations (quits, layoffs and discharges, and other separations) for major industry sectors, including education. BLS JOLTS data and other survey data can be used to track the recovery of the labor market since the spring of 2020, when the coronavirus pandemic resulted in job losses on a scale not seen since the Great Depression.2

This analysis is the first in a of series of analyses of the public state and local education industry3 during the 2021–22 school year. This industry includes all persons employed by public elementary and secondary school systems and postsecondary institutions, including a variety of occupations, such as teachers and instructional aides, administrators and other professional staff, support staff, maintenance personnel, cafeteria workers, and transportation workers.4 The JOLTS data are tabulated at this sector level and do not permit separate detailed analyses at the elementary and secondary level or at the postsecondary level. To put the scope of this group in context, 48 percent of the staff employed by public elementary and secondary school systems were teachers, and 37 percent of full-time-equivalent (FTE) postsecondary staff within public degree-granting institutions were instructional faculty in 2019.5

This snapshot is focused on the December 2021 reporting period. To provide context for this period, estimates will be compared with the previous month’s estimates, as well as with December 2019 (before the pandemic) and December 2020. Subsequent analysis will review the cumulative change from July 2021 through June 2022.

Overview of December 2021 Estimates

The number of job openings in public state and local education was 320,000 on the last business day of December 2021, which was higher than in December 2019 or December 2020 (table 1). In percentage terms, 2.9 percent of jobs had openings in December 2021, which was higher than 2.0 percent in December 2019 and 1.9 percent in December 2020. This suggests a greater need for public state and local education employees in December 2021 than in December 2019 or December 2020. Additionally, the number of separations6 (126,000) in December 2021 exceeded the total number of hires (91,000), indicating a net decrease in the number of public state and local education employees from the number in the month before. The number of job openings at the end of December 2021 (320,000) was 3.5 times larger than the number of staff actually hired that month (91,000). This December 2021 ratio of openings to hires was higher than the ratio in December 2020 (2.9) and the ratio in December 2019 (2.6).

Hiring in the education sector happens on a cyclical basis with the academic calendar, meaning that patterns will differ between months.7 November 2021 data are also provided in table 1 to provide a sense of the month-to-month change in employment data. In November 2021, the number of job openings outpaced the number of hires by a margin of 167,000 positions, representing a ratio of job openings to hires of 2.3. 


Table 1. Public state and local education job openings, hires, and separations: 2019, 2020, and 2021
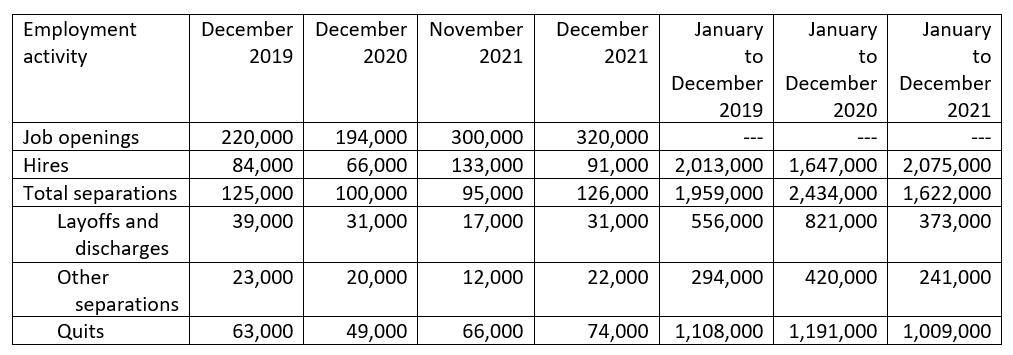
Table showing public state and local education job openings, hires, and separations (layoffs and discharges, other separations, and quits)in 2019, 2020, and 2021

---Not available.
NOTE: Data are not seasonally adjusted. Detail may not sum to totals because of rounding.
SOURCE: U.S. Department of Labor, Bureau of Labor Statistics, Job Openings and Labor Turnover Survey (JOLTS), 2019, 2020, and 2021, based on data downloaded March 15, 2022.


Net Change in Employment

JOLTS data show the relationships of hires and separations throughout business cycles. Net employment changes result from the relationship between hires and separations. When the number of hires exceeds the number of separations, employment rises—even if the number of hires is steady or declining. Conversely, when the number of hires is less than the number of separations, employment declines—even if the number of hires is steady or rising. During the 2021 calendar year, hires for state and local education totaled 2,075,000. The number of separations was estimated at 1,622,000 (including 1,009,000 quits). Taken together, the public state and local education sector in 2021 experienced a net employment gain of 453,000. In contrast, there was a net employment loss of 787,000 in 2020, resulting from 1,647,000 hires and 2,434,000 separations. These totals include workers who may have been hired and separated more than once during the year. Annual net gains and losses indicate the importance of being able to consider multiple years of data when studying the overall staffing situation in our education system. The net employment gain in 2021 does not erase the larger net loss experienced in 2020.

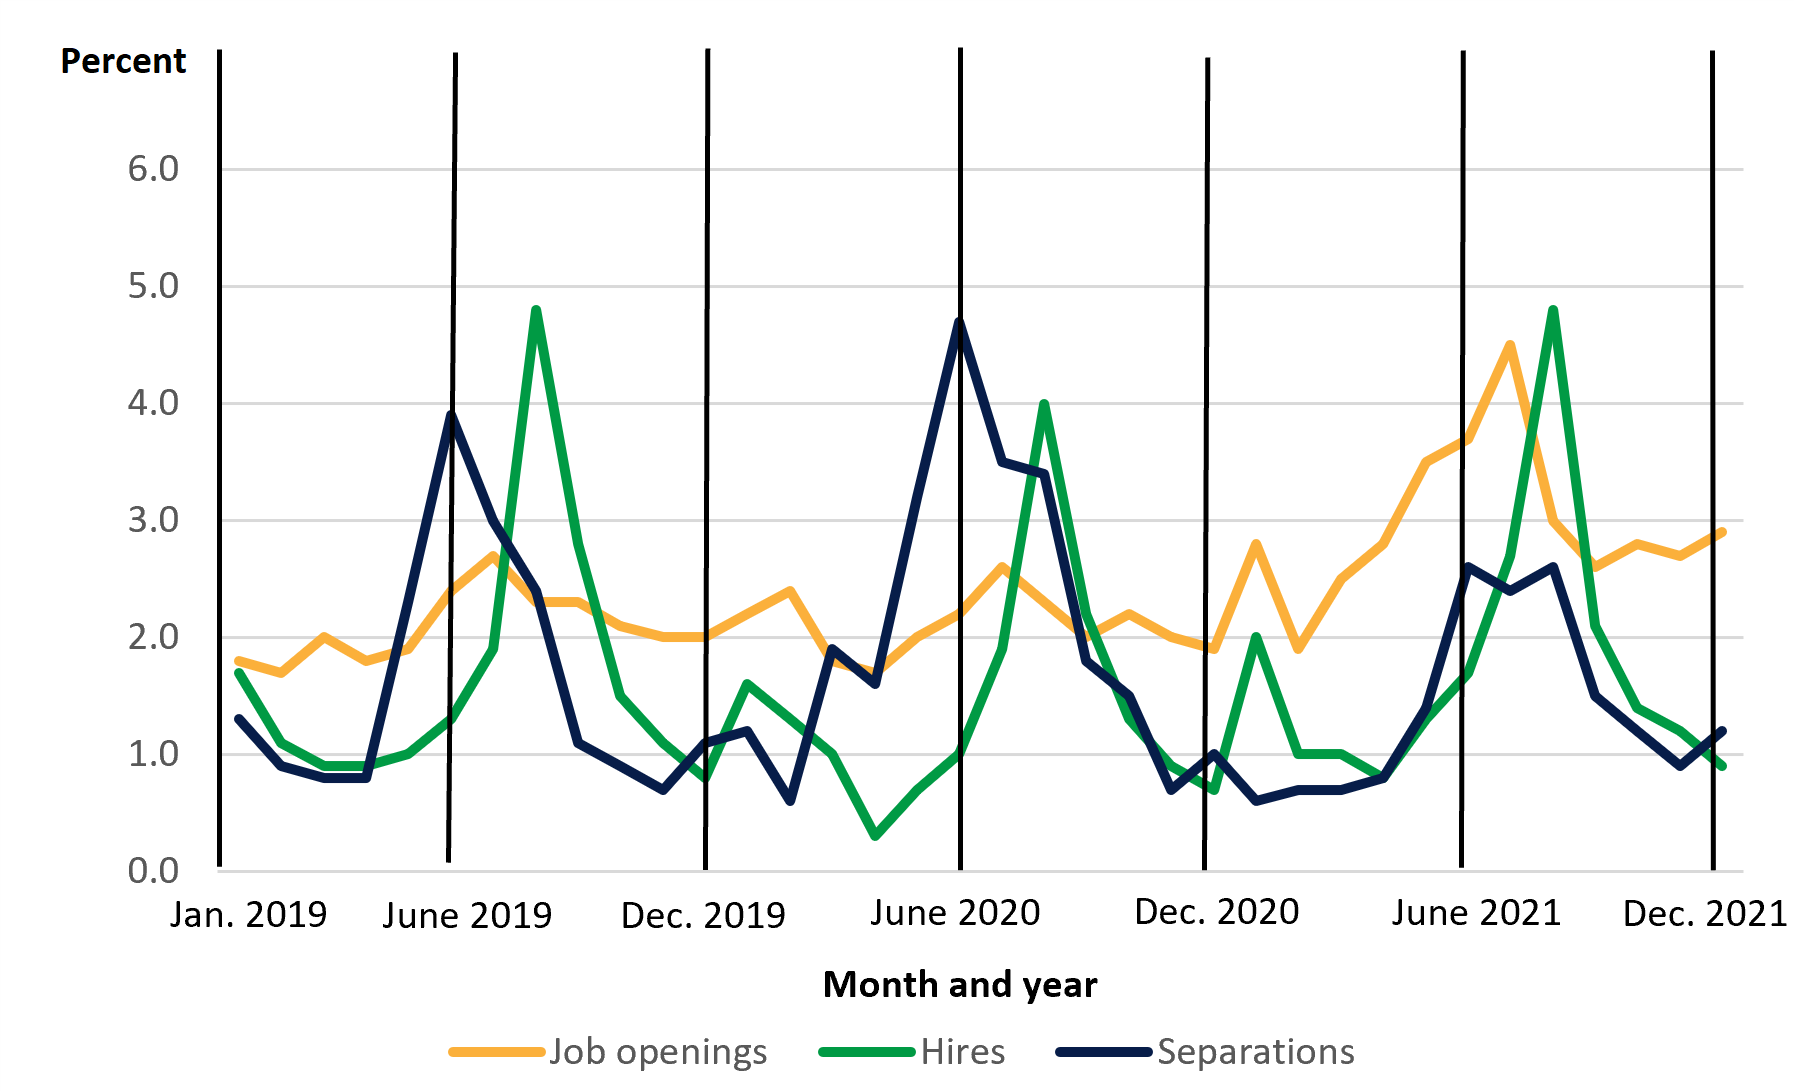
Figure 1 shows the cyclical nature of state and local government education employee job openings, hires, and separations. The percentages in the figure reflect the number of job openings, hires, and separations during the month relative to the total employment in the state and local government education industry. In general, separations and hiring are higher in the summer and lower in the winter. Both trends reflect the school fiscal year (July through June).


Figure 1. Monthly percentage of job openings, hires, and separations for the state and local government education industry: January 2019 to December 2021
Line graph showing monthly percentage of job openings, hires, and separations for the state and local government education industry in January, June, and December 2019, June and December 2020, and June and December 2021

NOTE: Data are not seasonally adjusted.
SOURCE: U.S. Department of Labor, Bureau of Labor Statistics, Job Openings and Labor Turnover Survey (JOLTS), 2019, 2020, and 2021, based on data downloaded March 15, 2022.


Public State and Local Education Job Openings

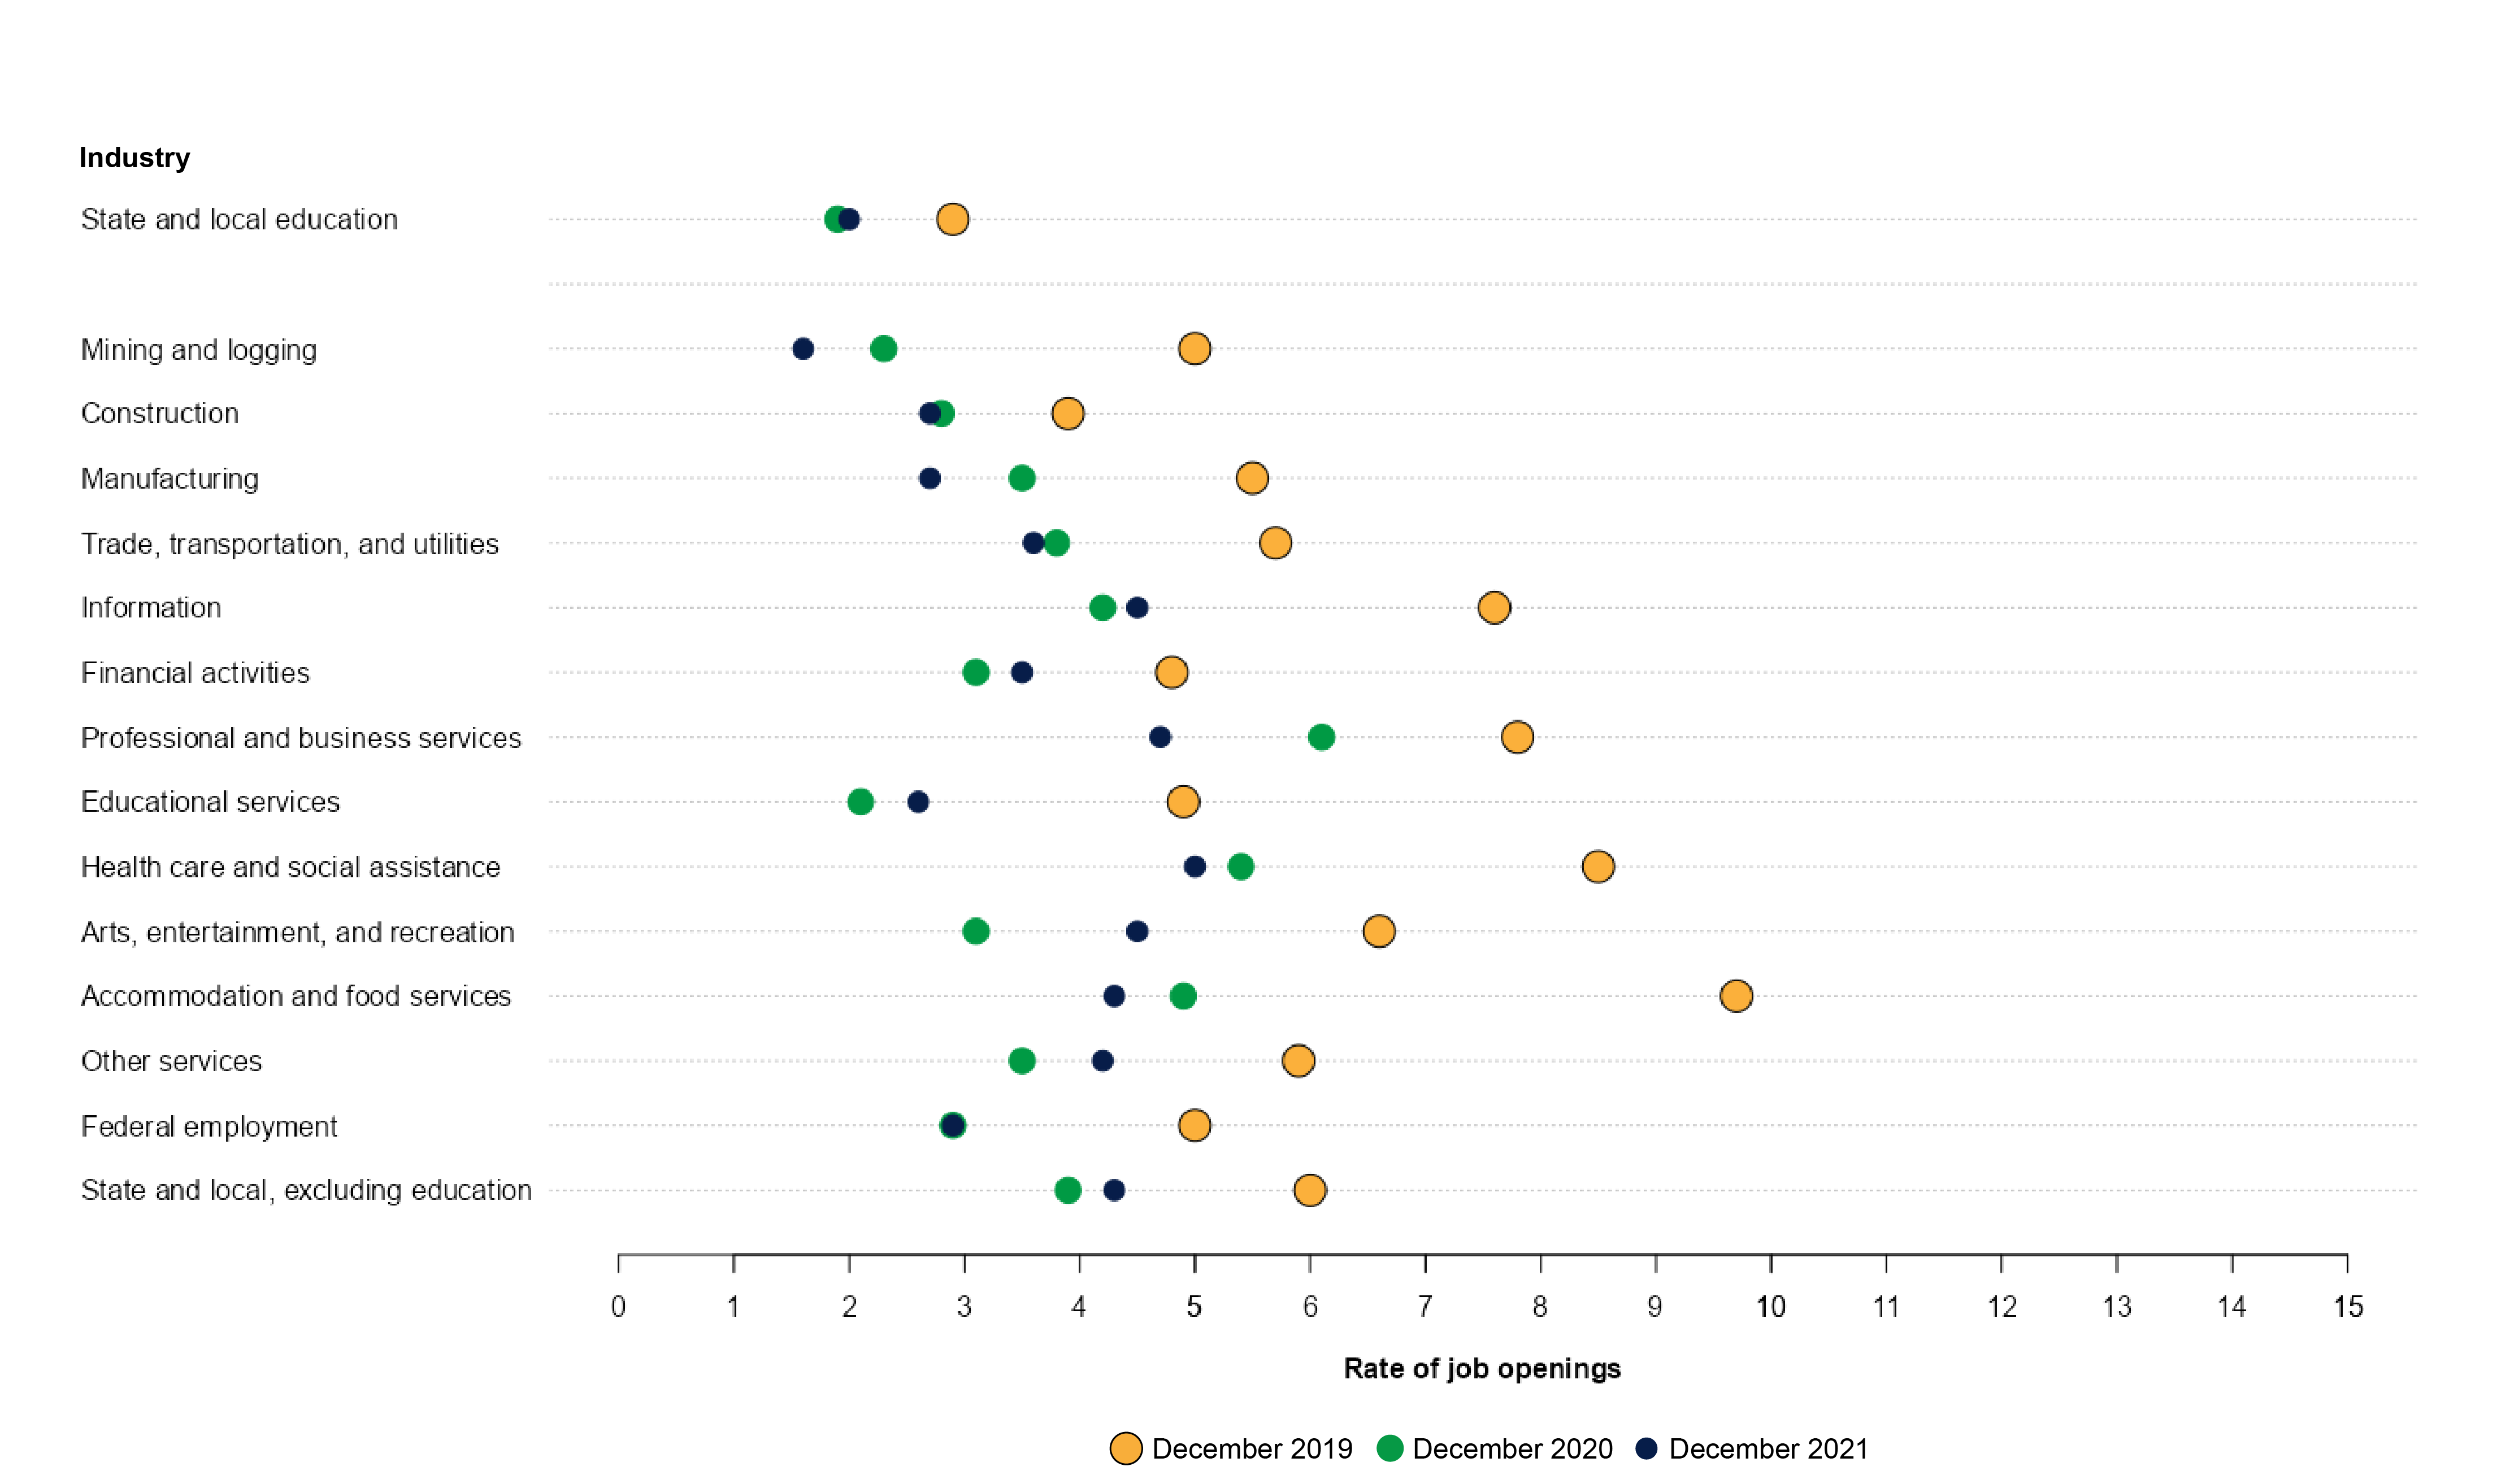
Figure 2 shows the job openings in December 2021 compared with those in December 2019 and December 2020 across different industries. Overall, the total nonfarm job opening rate was 6.4 percent in December 2021, which was an increase of 2.3 percentage points over the rate in December 2020. The percentage of public state and local education sector jobs with openings was 2.9 percent (320,000) in December 2021, which was higher than the 2.0 percent (220,000) in December 2019 or 1.9 percent (194,000) in December 2020. The percentage of public state and local education sector job openings in December 2021 was not measurably different from the percentage in November 2021.


Figure 2. Rate of job openings, by major industry: December 2019, December 2020, and December 2021
Scatter plot showing rate of job openings, by major industry, in December 2019, December 2020, and December 2021

NOTE: Data are not seasonally adjusted.
SOURCE: U.S. Department of Labor, Bureau of Labor Statistics, Job Openings and Labor Turnover Survey (JOLTS), 2019, 2020, and 2021, based on data downloaded March 17, 2022.


Public State and Local Education Hires

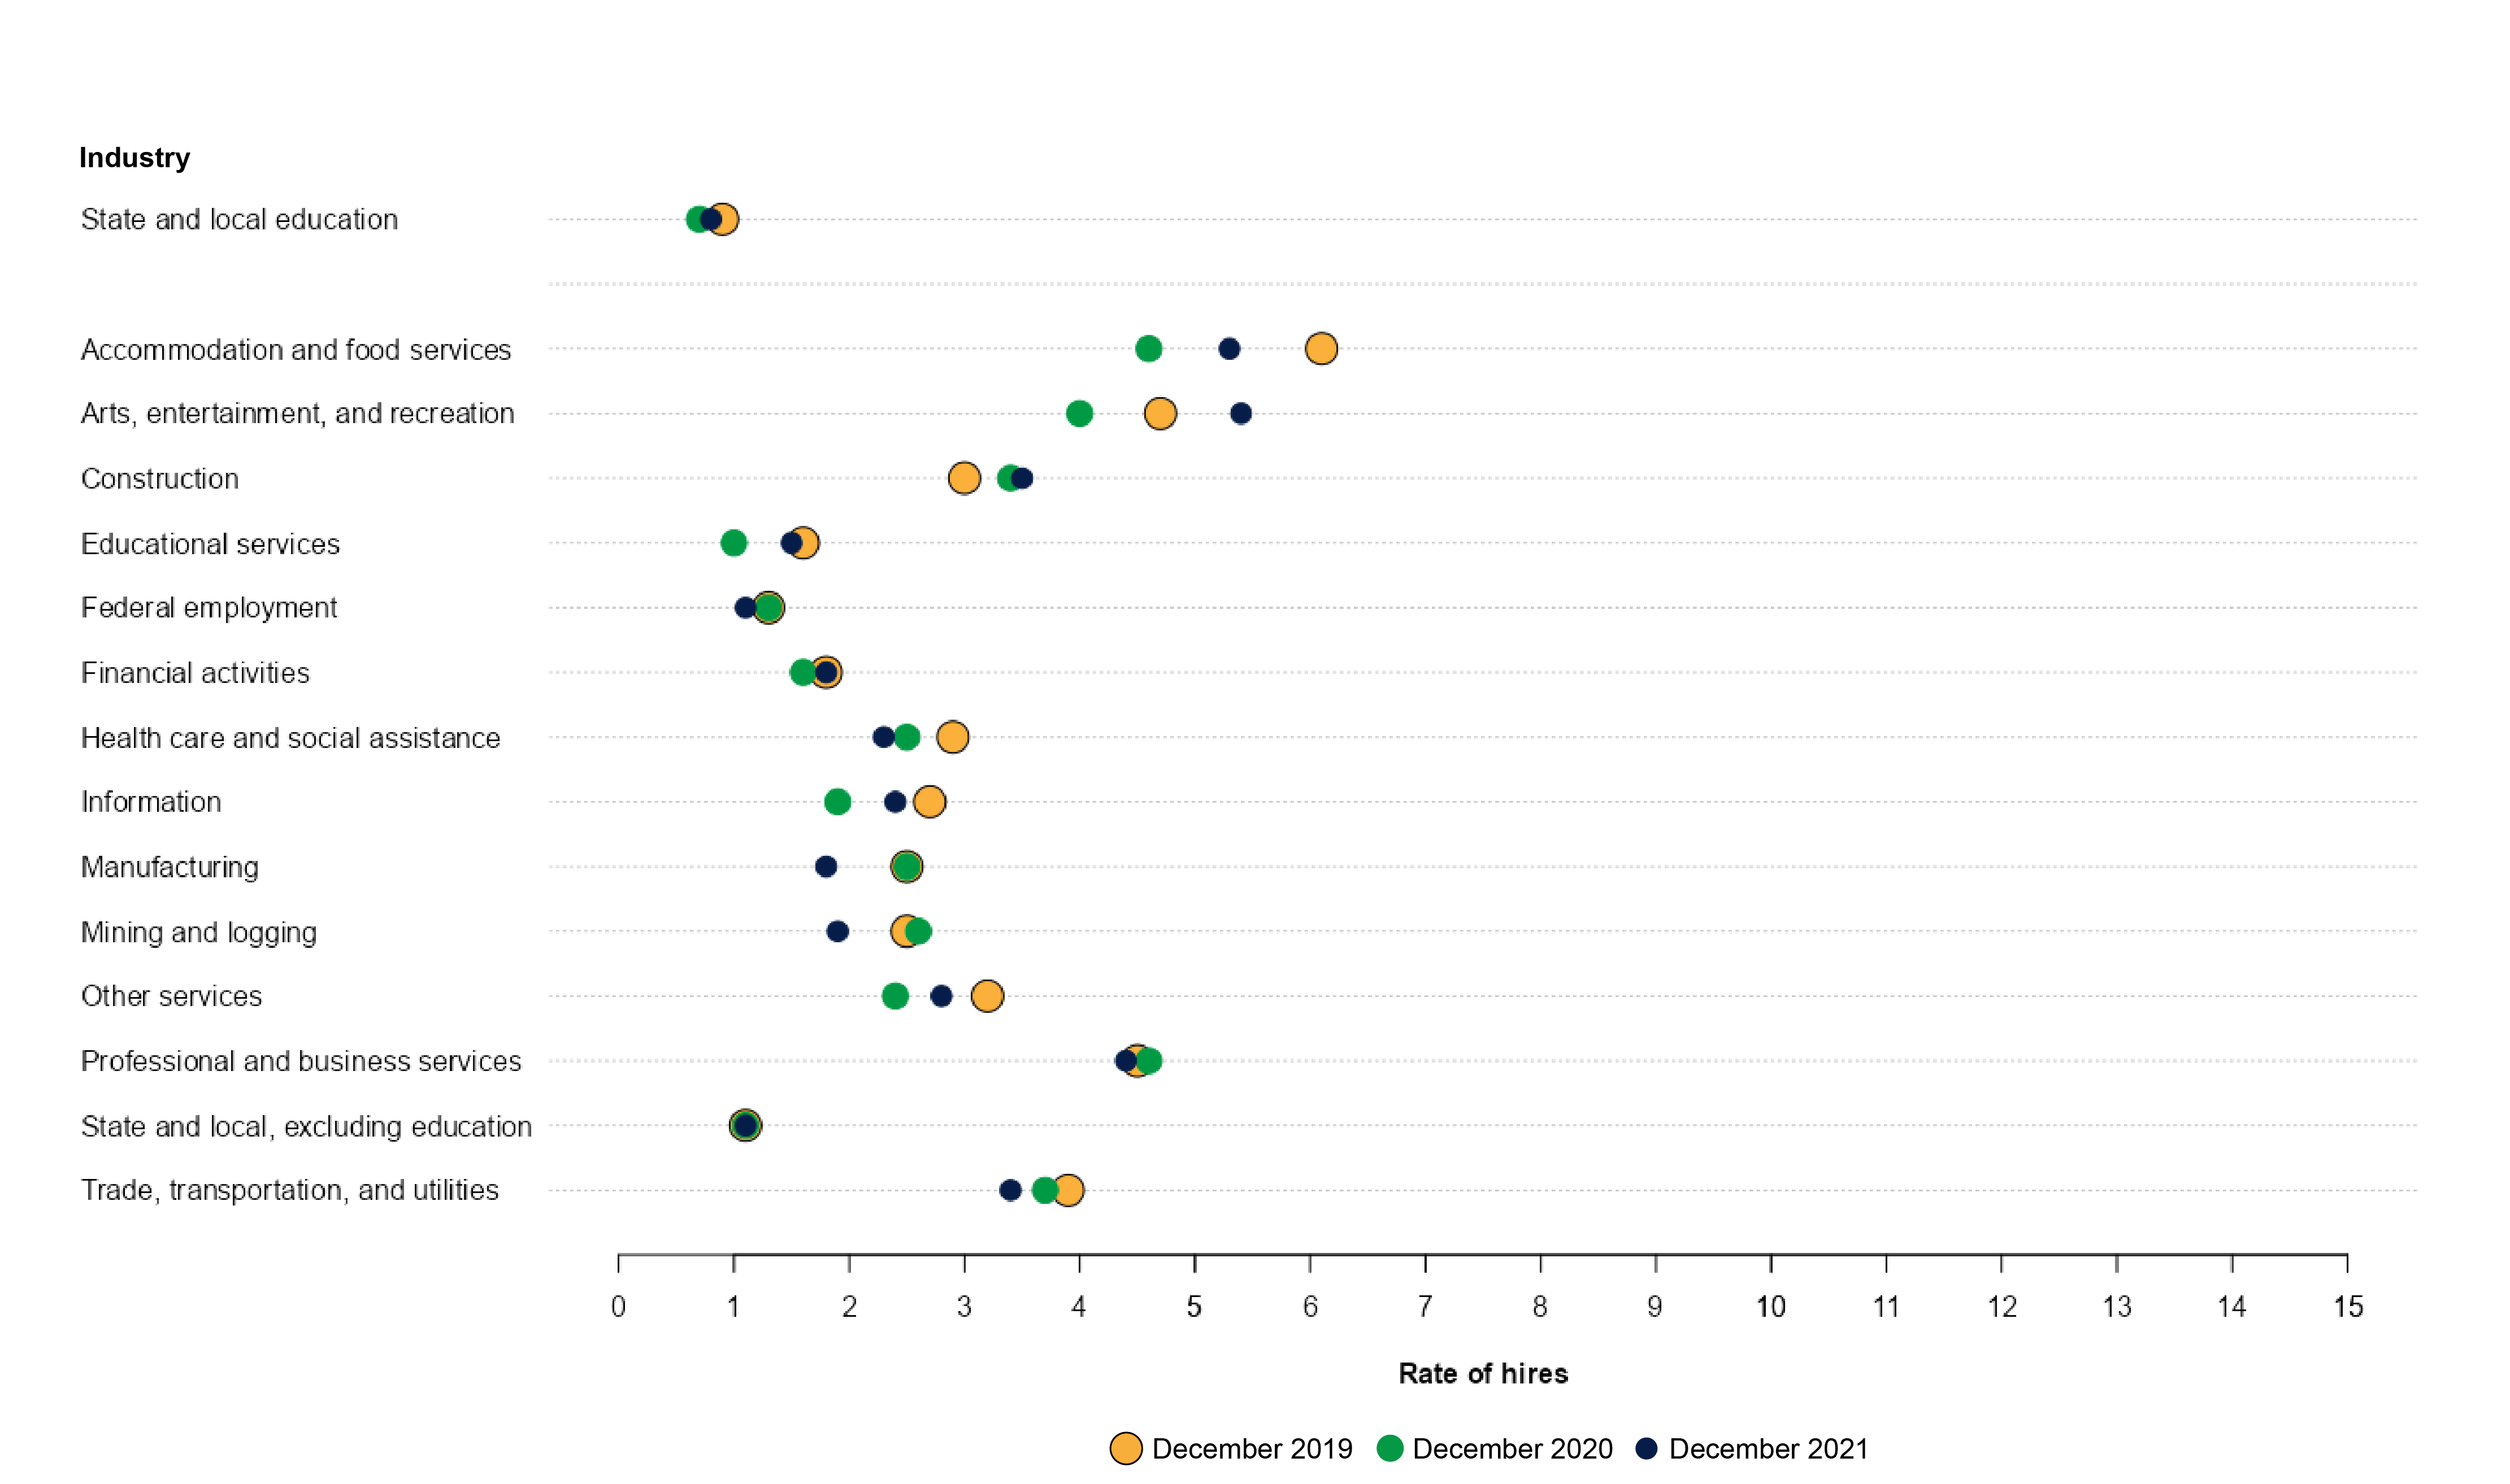
Figure 3 shows hires across major industries as a percentage of total employment. Overall, the total nonfarm hire rate was 3.2 percent in December 2021, which was 0.3 percentage points higher than the rate in December 2020. The percentage of public state and local education sector hires was 0.9 percent (91,000) in December 2021, which was not measurably different from the number or rate in either December 2019 or December 2020. The percentage of public state and local education sector hires in December 2021 was lower than the 1.2 percent in November 2021 (133,000).

The gaps between hires and job openings in the public education sector were larger in December 2021 than in 2019 or 2020, due to a larger number of openings in December 2021. In December 2021, the gap between the rates of job openings and hires in education was 2.0 percentage points, compared with 1.2 in both December 2019 and December 2020.


Figure 3. Rate of hires, by major industry: December 2019, December 2020, and December 2021
Scatter plot showing rate of hires, by major industry, in December 2019, December 2020, and December 2021

NOTE: Data are not seasonally adjusted.
SOURCE: U.S. Department of Labor, Bureau of Labor Statistics, Job Openings and Labor Turnover Survey (JOLTS), 2019, 2020, and 2021, based on data downloaded March 17, 2022.


Public State and Local Education Total Separations

Total separations include quits, layoffs and discharges, and other separations. Quits are generally voluntary separations initiated by the employee. Therefore, the quit rate can serve as a measure of workers’ willingness or ability to leave jobs. Layoffs and discharges are involuntary separations initiated by the employer. The other separations category includes separations due to retirement, death, disability, and transfers to other locations of the same firm.

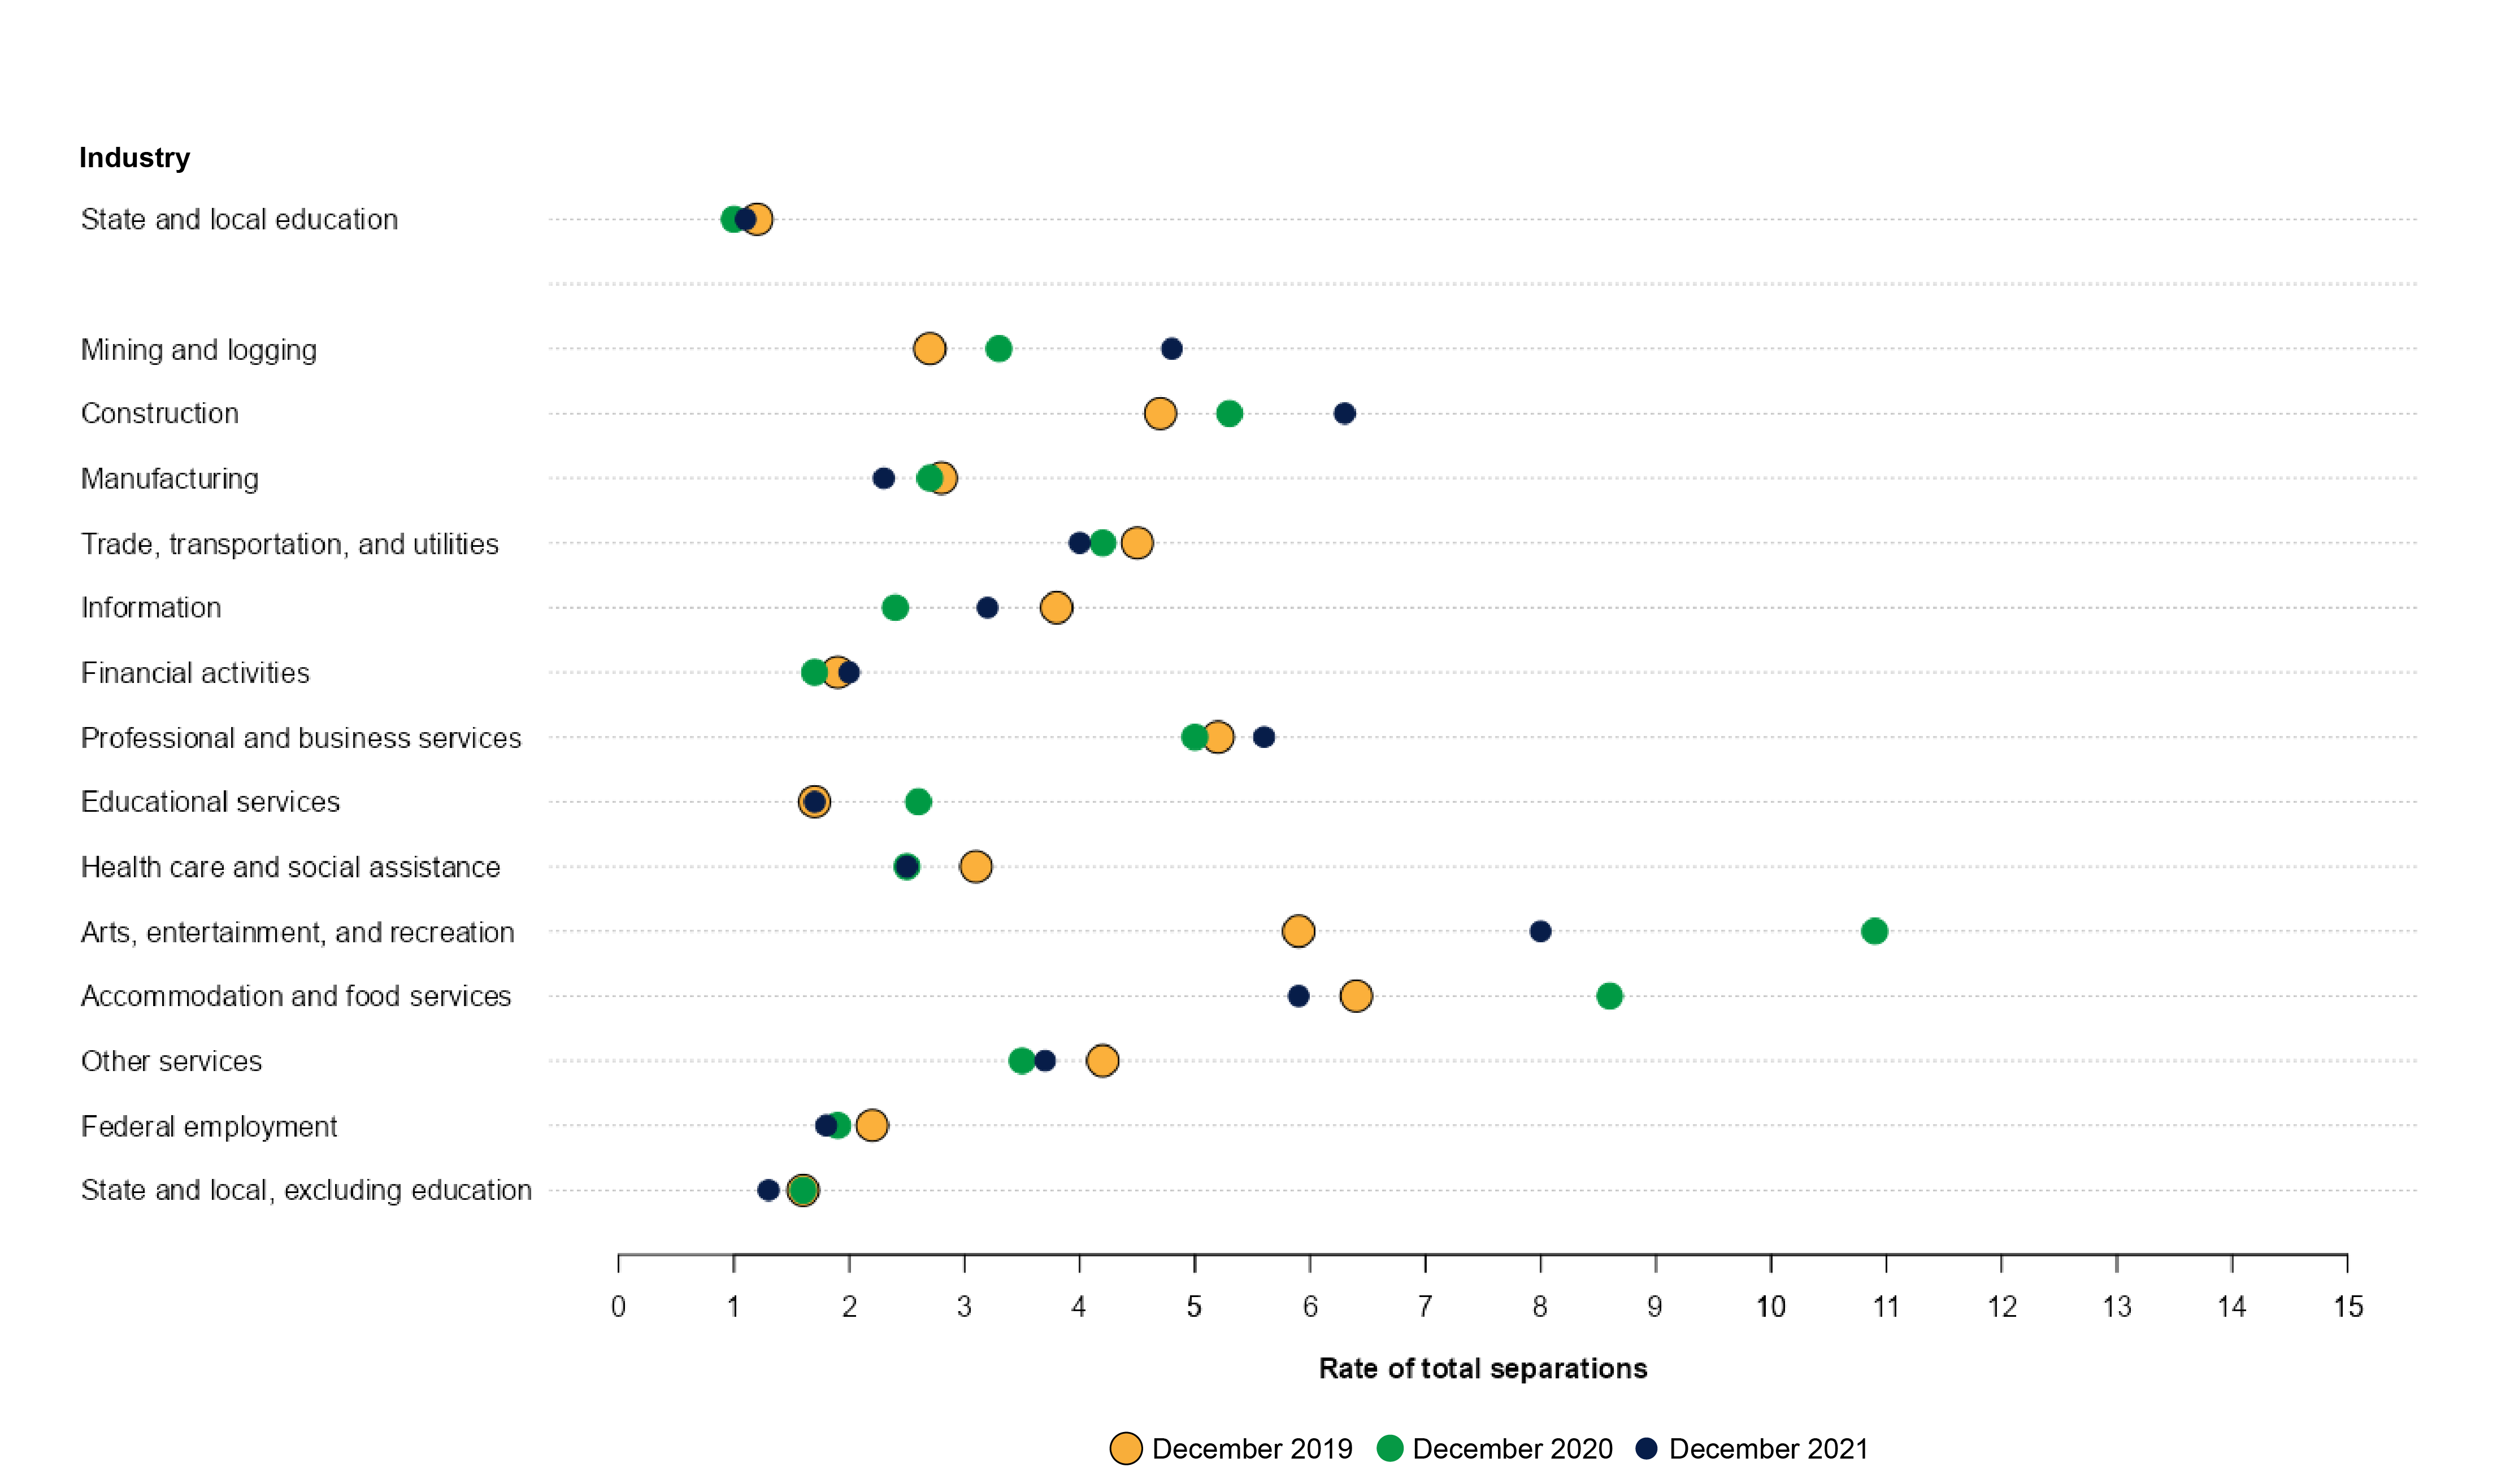
Total separations for the public state and local education industry were 126,000, or 1.2 percent, in December 2021 (figure 4). Quits accounted for 59 percent of all separations for state and local education employees in December 2021. The quit rate was 0.7 percent for December 2021, which was about 0.2 percentage points higher than in December 2020, but not measurably different from the rate in December 2019. Quit rates for public state and local education employees were consistently lower than for private sector employees.8 For example, in December 2021 the total private sector quit rate was 2.8 percent.


Figure 4. Rate of total separations, by major industry: December 2019, December 2020, and December 2021
Scatter plot showing rate of total separations, by major industry, in December 2019, December 2020, and December 2021

NOTE: Data are not seasonally adjusted.
SOURCE: U.S. Department of Labor, Bureau of Labor Statistics, Job Openings and Labor Turnover Survey (JOLTS), 2019, 2020, and 2021, based on data downloaded March 17, 2022.


Taken together, the data show that in recent years there generally have been fewer separations in the public education industry compared with other industries. The December 2021 separation rate for state and local education employees of 1.2 percent was higher than the November 2021 separation rate of 0.9 percent. Nevertheless, the separation rate for the state and local education industry was lower than for all other industries in December 2021.

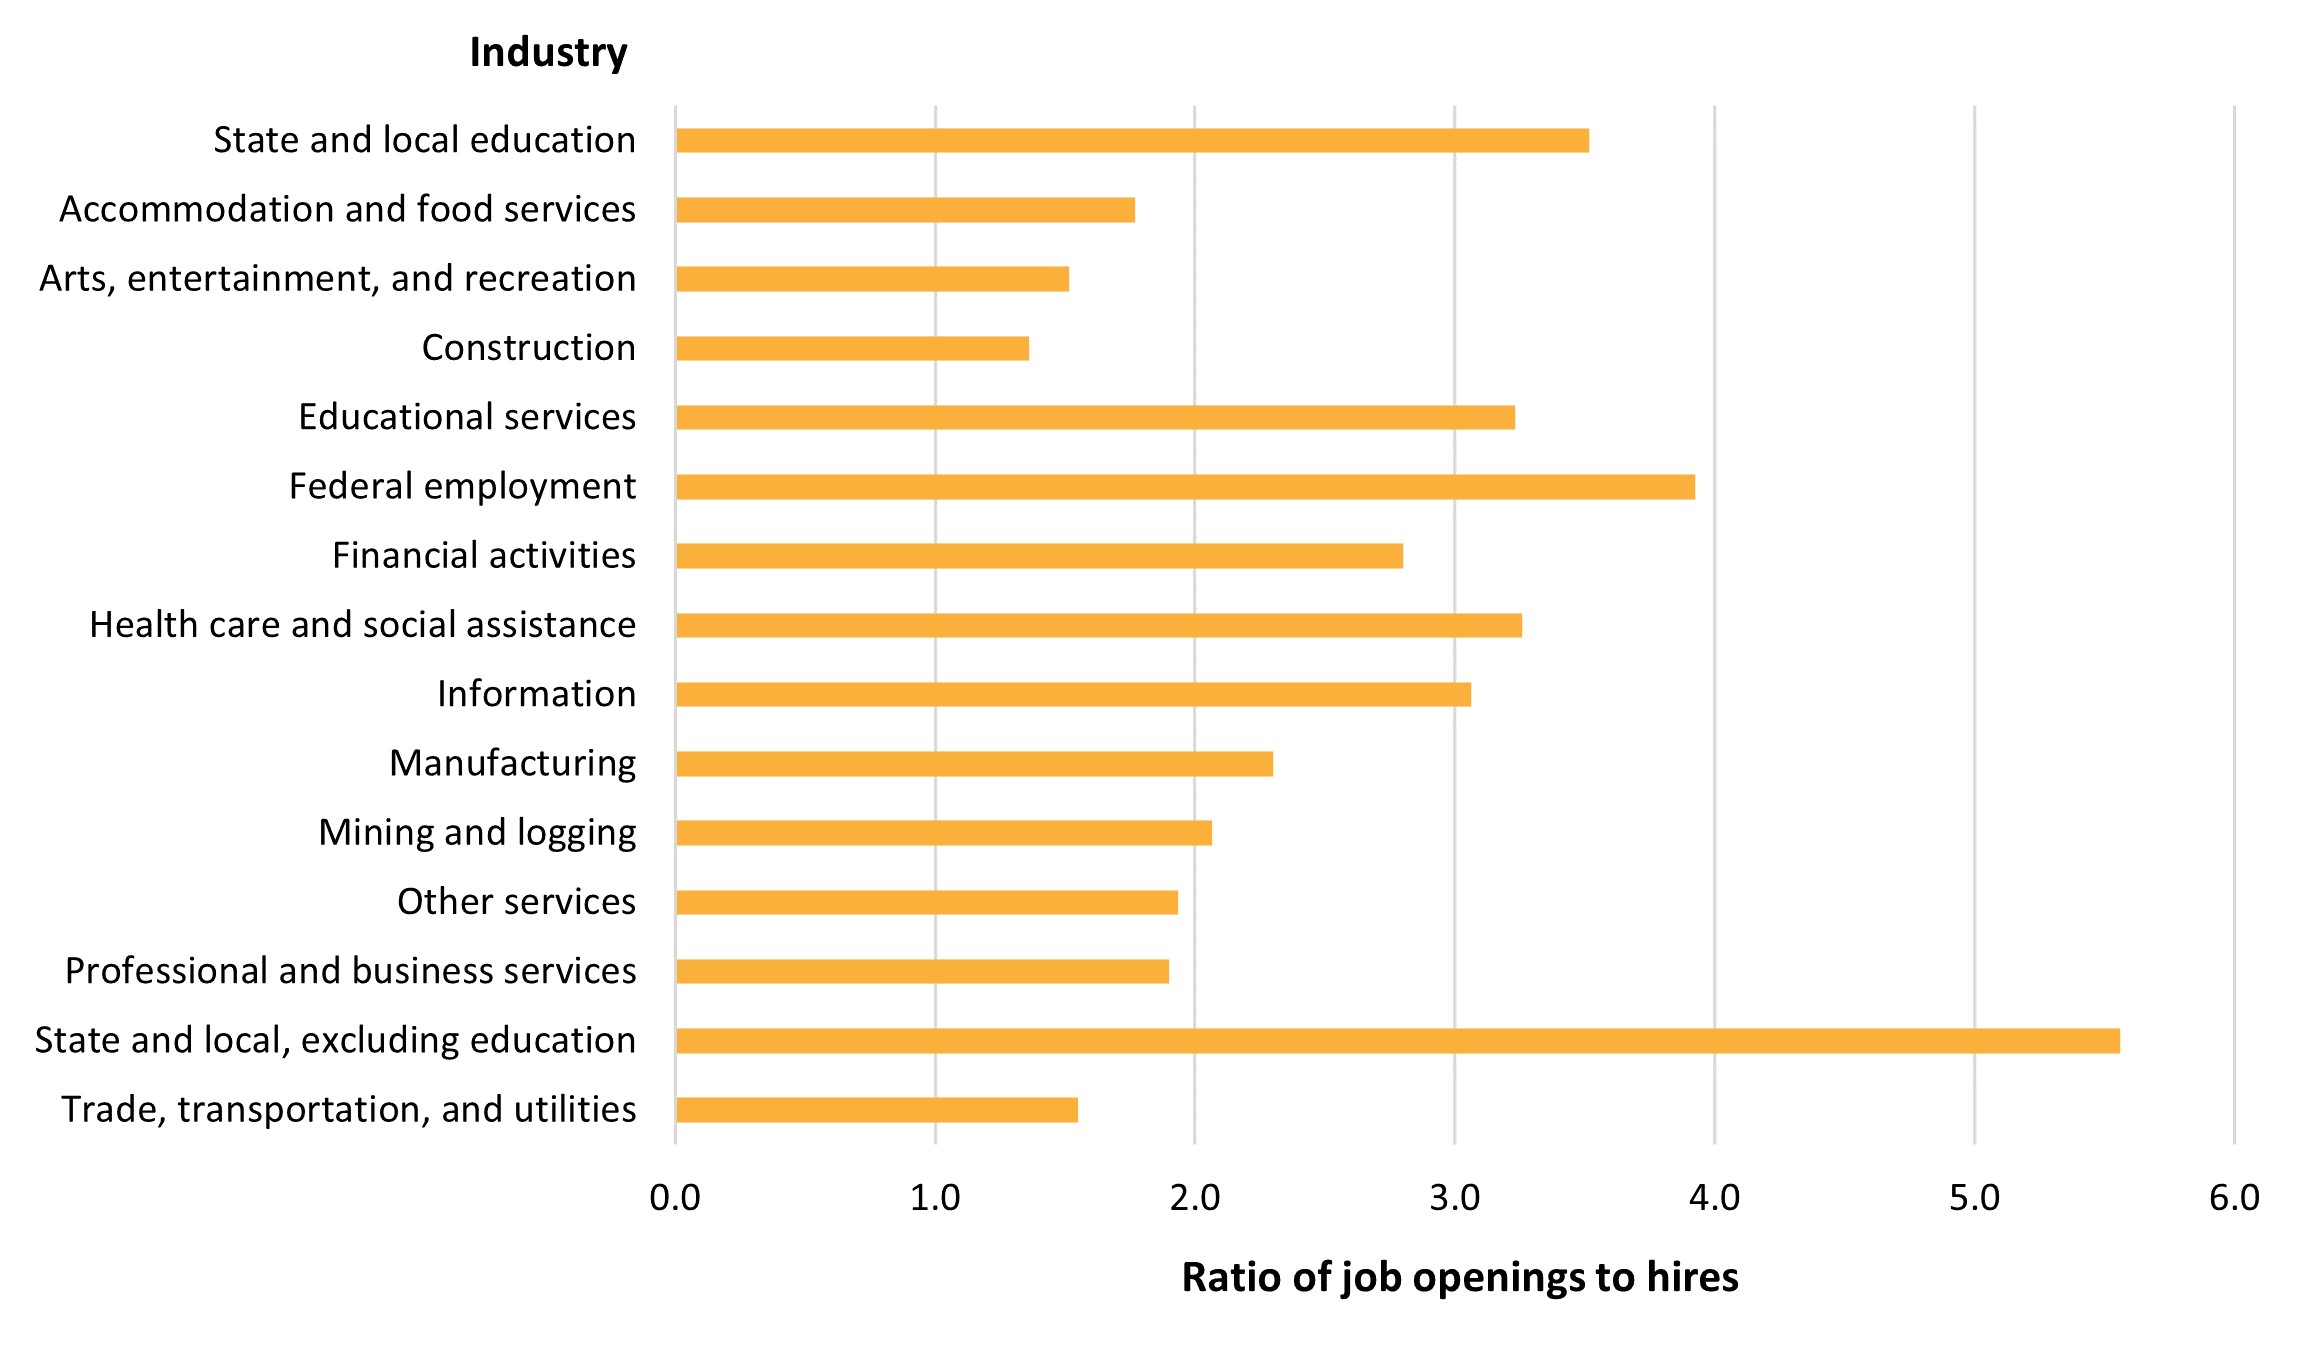
At 2.9 percent, state and local education had the lowest percentage of jobs with openings in December 2021. However, that does not mean that staffing shortages were not a factor in the state and local education industry (figure 5). The ratio of job openings to hires for state and local education (3.5) in December 2021 is well above the average for all industries (2.1), indicating a high demand for employees in this industry and relative difficulty of filling available slots. The only industries with higher openings-to-hires ratios were the federal government (3.9) and state and local government, excluding education (5.6). Thus, while the openings-to-hires ratio was relatively higher for the state and local education industry, it was lower than the ratio for the federal government and for state and local government, excluding education.


Figure 5. Ratio of job openings to hires, by major industry: December 2021
Horizontal bar chart showing ratio of job openings to hires, by major industry, in December 2021

NOTE: Data are not seasonally adjusted.
SOURCE: U.S. Department of Labor, Bureau of Labor Statistics, Job Openings and Labor Turnover Survey (JOLTS), 2021, based on data downloaded March 17, 2022.


To understand the cumulative status of the employment situation at the end of the school year, we intend to provide an update of our analyses as these data become available.

Learn more about JOLTS and access additional data on job openings, hires, and separations. Be sure to follow NCES on Twitter, Facebook, LinkedIn, and YouTube to stay informed.


By Josue DeLaRosa, NCES


[1] For a discussion on the reliability of the estimates, please see Job Openings and Labor Turnover Technical Note - 2022 M01 Results (bls.gov).

[2] U.S. Department of Labor, Bureau of Labor Statistics, “How Did Employment Change During the COVID-19 pandemic? Evidence From a New BLS Survey Supplement,” downloaded March 18, 2022, from https://www.bls.gov/opub/btn/volume-11/how-did-employment-change-during-the-covid-19-pandemic.htm; and “As the COVID-19 Pandemic Affects the Nation, Hires and Turnover Reach Record Highs in 2020,” downloaded March 18, 2022, from https://www.bls.gov/opub/mlr/2021/article/as-the-covid-19-pandemic-affects-the-nation-hires-and-turnover-reach-record-highs-in-2020.htm.

[3] JOLTS refers to this industry as state and local government education and uses ID 92.

[4] JOLTS does not collect occupation data.

[5] U.S. Department of Education, National Center for Education Statistics, Digest of Education Statistics, table 213.10, downloaded March 30, 2022, from https://nces.ed.gov/programs/digest/d21/tables/dt21_213.10.asp?current=yes, and table 314.10, downloaded March 30, 2022, from https://nces.ed.gov/programs/digest/d20/tables/dt20_314.10.asp?current=yes.

[6] Separations include all separations from the payroll during the entire reference month and are reported by type of separation: quits, layoffs and discharges, and other separations.

[7] Engel, M. (2012). The Timing of Teacher Hires and Teacher Qualifications: Is There an Association? Teachers College Record, 114(12): 1–29.

[8] The private sector includes all nonfarm employees except federal employment and state and local government employment.                                                           

Investing in Next Generation Technologies for Education and Special Education

The Department of Education’s (ED) Small Business Innovation Research (SBIR) program, administered by the Institute of Education Sciences (IES), funds entrepreneurial developers to create the next generation of technology products for students, teachers, and administrators in education and special education. The program, known as ED/IES SBIR, emphasizes an iterative design and development process and pilot research to test the feasibility, usability, and promise of new products to improve outcomes. The program also focuses on planning for commercialization so that the products can reach schools and end-users and be sustained over time.

In recent years, millions of students in tens of thousands of schools around the country have used technologies developed through ED/IES SBIR, including more than million students and teachers who used products for remote teaching and learning during the COVID-19 pandemic.

ED/IES SBIR Announces 2022 Awards

IES has made 10 2022 Phase I awards for $250,000*. During these 8 month projects, teams will develop and refine prototypes of new products and test their usability and initial feasibility. All awardees who complete a Phase I project will be eligible to apply for a Phase II award in 2023.

IES has made nine 2022 Phase II awards, which support further research and development of prototypes of education technology products that were developed under 2021 ED/IES SBIR Phase I awards. In these Phase II projects, teams will complete product development and conduct pilot studies in schools to demonstrate the usability and feasibility, fidelity of implementation, and the promise of the products to improve the intended outcomes.

IES also made one Direct to Phase II award to support the research, development, and evaluation of a new education technology product to ready an existing researcher-developed evidence-based intervention for use at scale and to plan for commercialization. The Direct to Phase II project is awarded without a prior Phase I award. All Phase II and the Direct to Phase II awards are for $1,000,000 for two-years. Across all awards, projects address different ages of students and content areas.

The list of all 2022 awards is posted here. This page will be updated with the two additional Phase I awards after the contracts are finalized.


The 2022 ED/IES SBIR awards highlight three trends that continue to emerge in the field of education technology.

Trend 1: Projects Are Employing Advanced Technologies to Personalize Learning and Generate Insights to Inform Tailored Instruction

About two-thirds of the new projects are developing software components that personalize teaching and learning, whether through artificial intelligence, machine learning, natural language processing, automated speech recognition, or algorithms. All these projects will include functionalities afforded by modern technology to personalize learning by adjusting content to the level of the individual learner, offer feedback and prompts to scaffold learning as students progress through the systems, and generate real-time actionable information for educators to track and understand student progress and adjust instruction accordingly. For example:

  • Charmtech Labs and Literably are fully developing reading assessments that provide feedback to inform instruction.
  • Sirius Thinking and studio:Sckaal are developing prototypes to formatively assess early grade school students in reading.
  • Sown To Grow and xSEL Labs are fully developing platforms to facilitate student social and emotional assessments and provide insights to educators.
  • Future Engineers is fully developing a platform for judges to provide feedback to students who enter STEM and educational challenges and contests.
  • Querium and 2Sigma School are developing prototypes to support math and computer science learning respectively.
  • ,Soterix is fully developing a smart walking cane and app for children with visual impairments to learn to navigate.
  • Alchemie is fully developing a product to provide audio cues to blind or visually impaired students learning science.
  • Star Autism Support is developing a prototype to support practitioners and parents of children with autism spectrum disorder.

Trend 2: Projects Focusing on Experiential and Hands-On Learning
Several new projects are combining hardware and software solutions to engage students through pedagogies employing game-based, hands-on, collaborative, or immersive learning:

  • Pocketlab is fully developing a matchbox-sized car with a sensor to collect physical science data as middle school students play.
  • GaiaXus is developing a prototype sensor used for environmental science field experiments.
  • Mind Trust is a developing a virtual reality escape room for biology learning.
  • Smart Girls is developing a prototype science game and accompanying real-world hands-on physical activity kits.
  • Indelible Learning is developing a prototype online multi-player game about the electoral college.
  • Edify is fully developing a school-based program for students to learn about, create, and play music.

Trend 3: Projects to Advance Research to Practice at Scale

Several new awards will advance existing education research-based practices into new technology products that are ready to be delivered at scale:

  • INSIGHTS is fully developing a new technology-delivered version to ready an NIH- and IES-supported social and emotional intervention for use at scale.
  • xSEL Laband Charmtech Labs (noted above) are building on prior IES-funded research-based interventions to create scalable products.
  • Scrible is developing an online writing platform in partnership with the National Writers Project based on prior Department of Education-funded research. 


*Note: Two additional 2022 Phase I awards are forthcoming in 2022. The contracts for these awards are delayed due to a back-up in the SAM registration process.

Stay tuned for updates on Twitter and Facebook as IES continues to support innovative forms of technology.

Edward Metz (Edward.Metz@ed.gov) is the Program Manager of the ED/IES SBIR program.

Michael Leonard (Michael.Leonard@ed.gov) is the Program Analyst of the ED/IES SBIR program.