Newly released provisional data from the Integrated Postsecondary Education Data System’s (IPEDS) Fall Enrollment (EF) survey provides an updated look at whether beginning college students are attending school in their home state or heading elsewhere.
In fall 2018, the number of first-time degree/certificate-seeking students enrolled at Title IV postsecondary institutions (beginning college students) varied widely across states, ranging from 3,700 in Alaska to 400,300 in California (figure 1). College enrollment is strongly correlated with the number of postsecondary institutions within each state, as more populous and geographically large states have more institutional capacity to enroll more students. Most states (32 out of 50) and the District of Columbia enrolled fewer than 50,000 beginning college students in fall 2018 and only six states (California, Texas, New York, Florida, Pennsylvania, and Ohio) enrolled more than 100,000 beginning college students.
Figure 1. Number of first-time degree/certificate-seeking undergraduate students enrolled at Title IV institutions, by state or jurisdiction: Fall 2018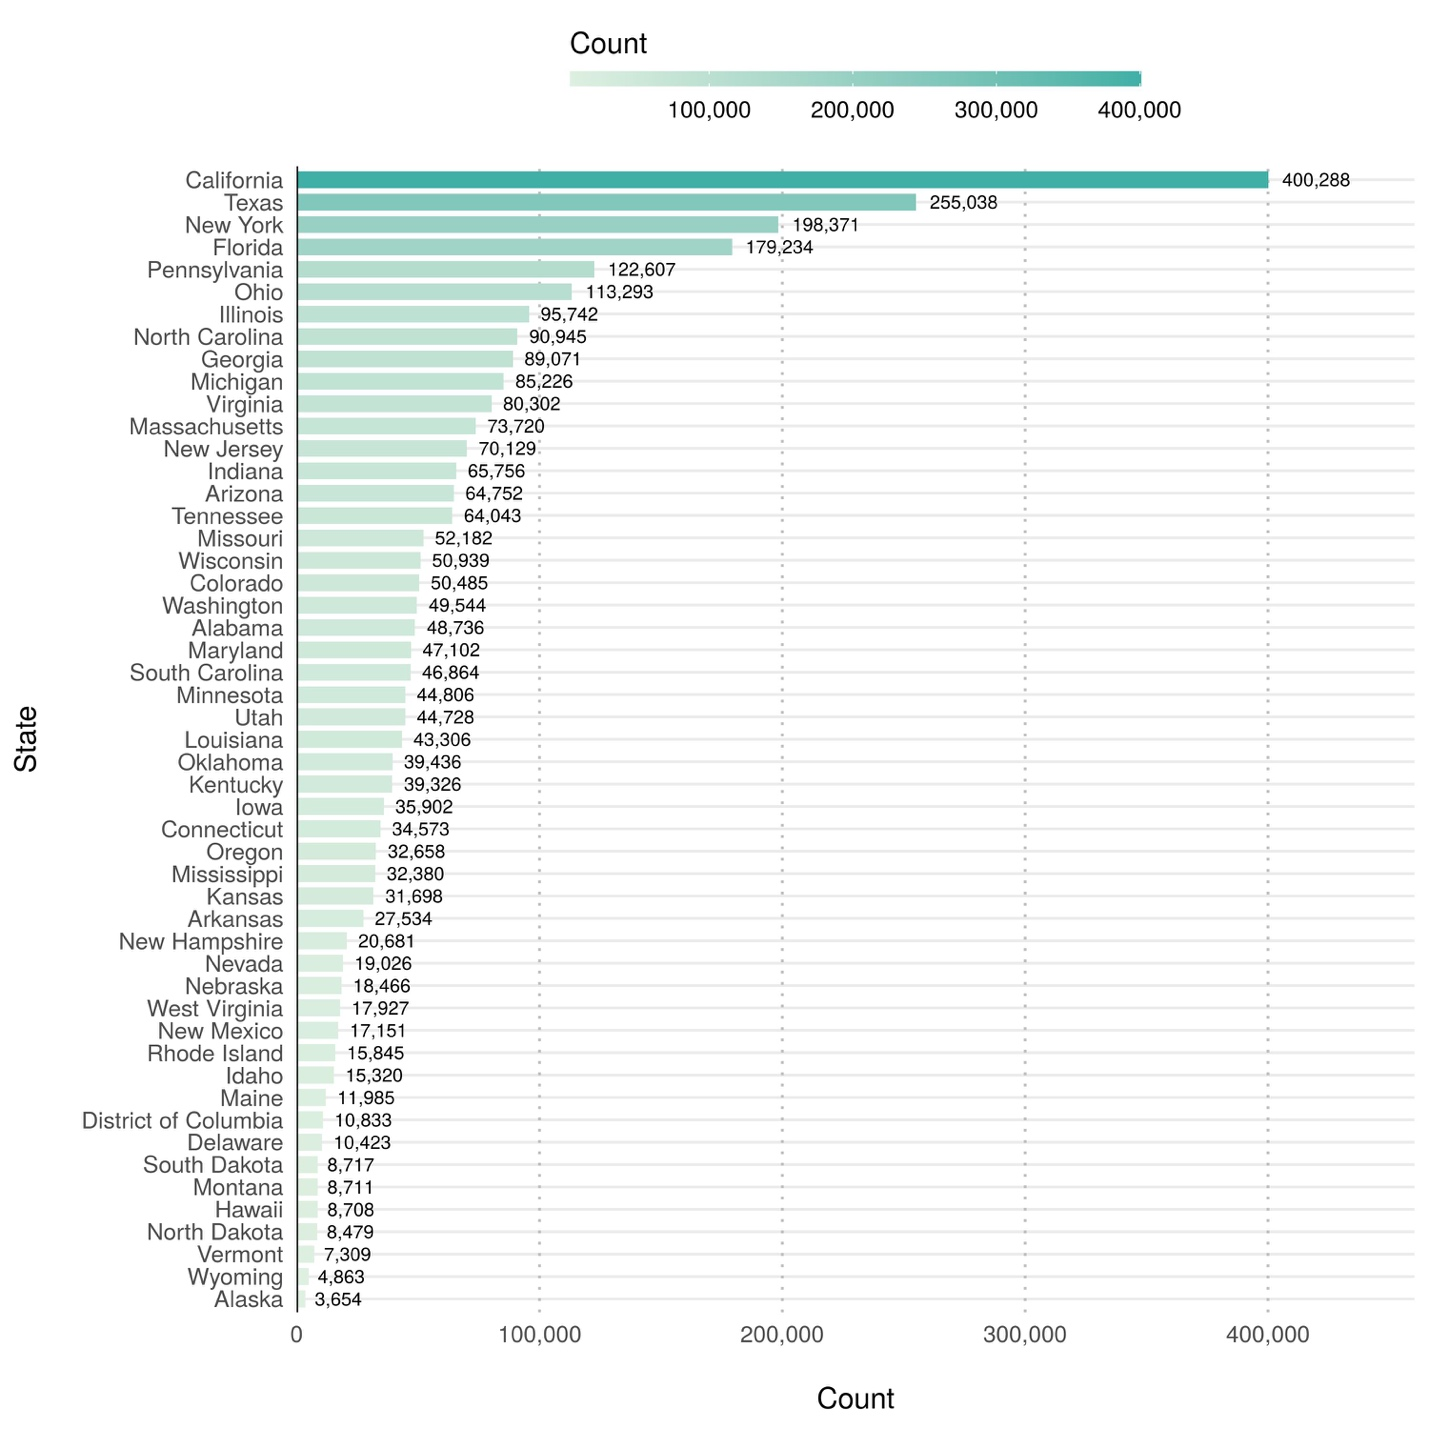 SOURCE: U.S. Department of Education, National Center for Education Statistics, IPEDS, Spring 2019, Fall Enrollment component (provisional data).
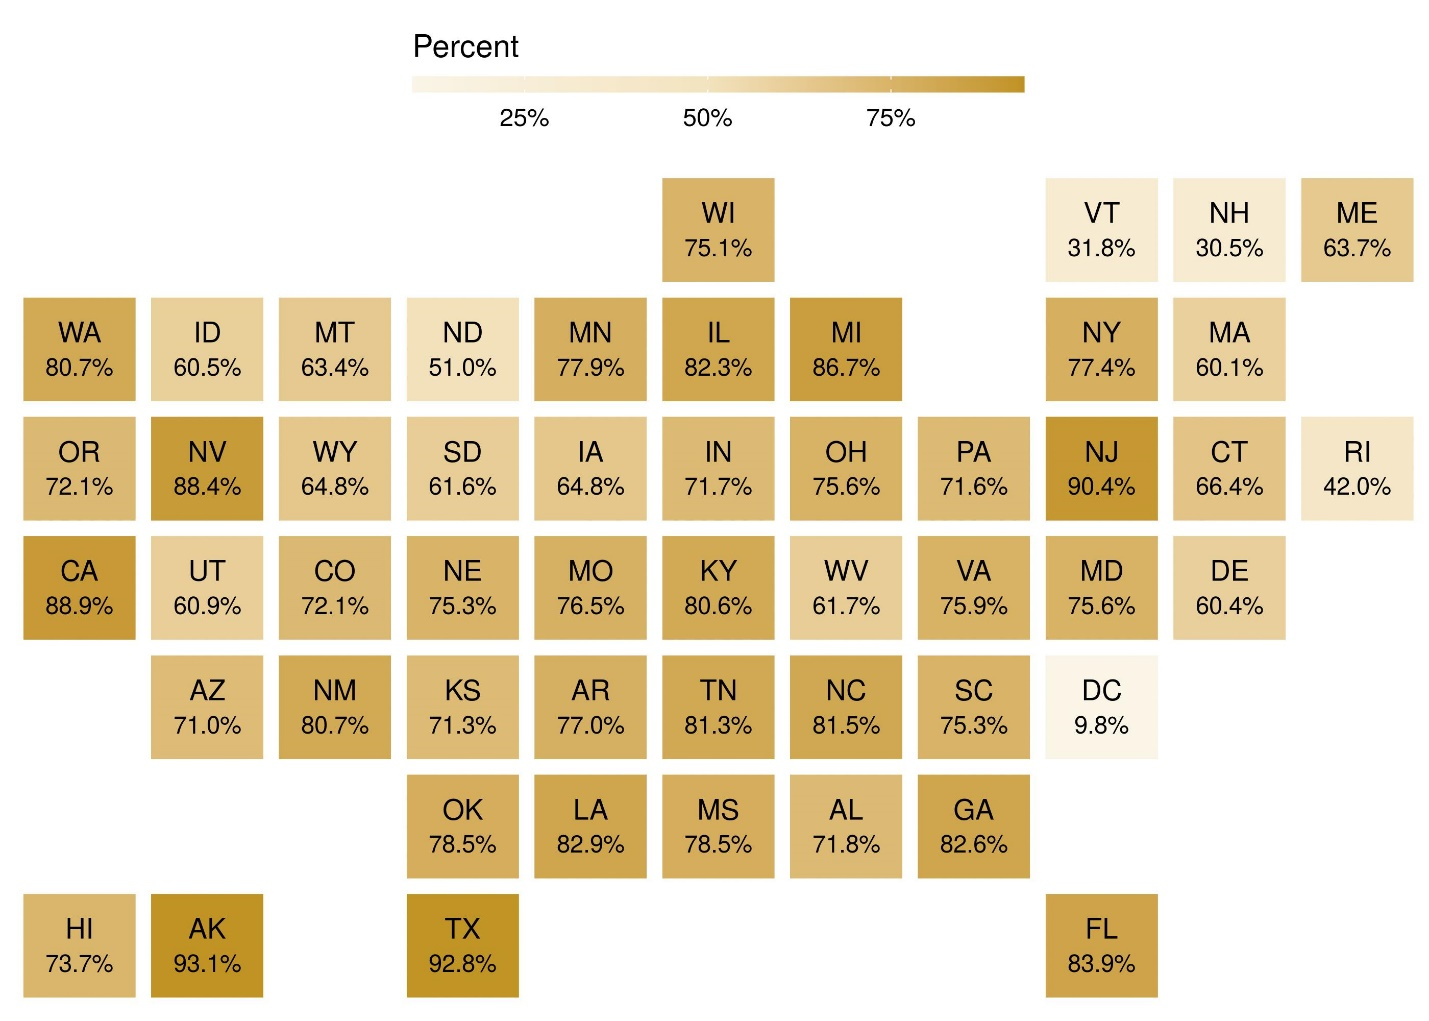
As a result of students migrating outside their home states to attend college, some postsecondary institutions enroll students who are not residents of the same state or jurisdiction in which it is located. Among beginning college students in fall 2018, the share of students who were residents of the same state varied widely, from 31 percent in New Hampshire to 93 percent in Texas and Alaska (figure 2). For a majority of states (27 out of 50), residents comprised at least 75 percent of total beginning college student enrollment. Only three states (Rhode Island, Vermont, and New Hampshire) and the District of Columbia enrolled more nonresidents than residents among their fall 2018 beginning college students.
Figure 2. Percent of first-time degree/certificate-seeking undergraduate students enrolled at Title IV institutions in the state or jurisdiction who are residents of the same state or jurisdiction: Fall 2018
 SOURCE: U.S. Department of Education, National Center for Education Statistics, IPEDS, Spring 2019, Fall Enrollment component (provisional data).
States experience varying levels of out-migration (i.e., residents leaving the state to attend college) and in-migration (i.e., nonresidents coming into the state to attend college). For example, in fall 2018, California experienced the largest number of residents out-migrating to attend college in a different state (44,800) but gained 37,800 nonresidents in-migrating to attend college in the state, for an overall negative net migration of beginning college students (figure 3). In contrast, New York also experienced a large number of residents out-migrating for college (33,800) but gained 43,300 nonresidents, for an overall positive net migration of beginning college students.
Figure 3. Number of first-time degree/certificate-seeking undergraduate students at Title IV institutions who migrate into and out of the state or jurisdiction: Fall 2018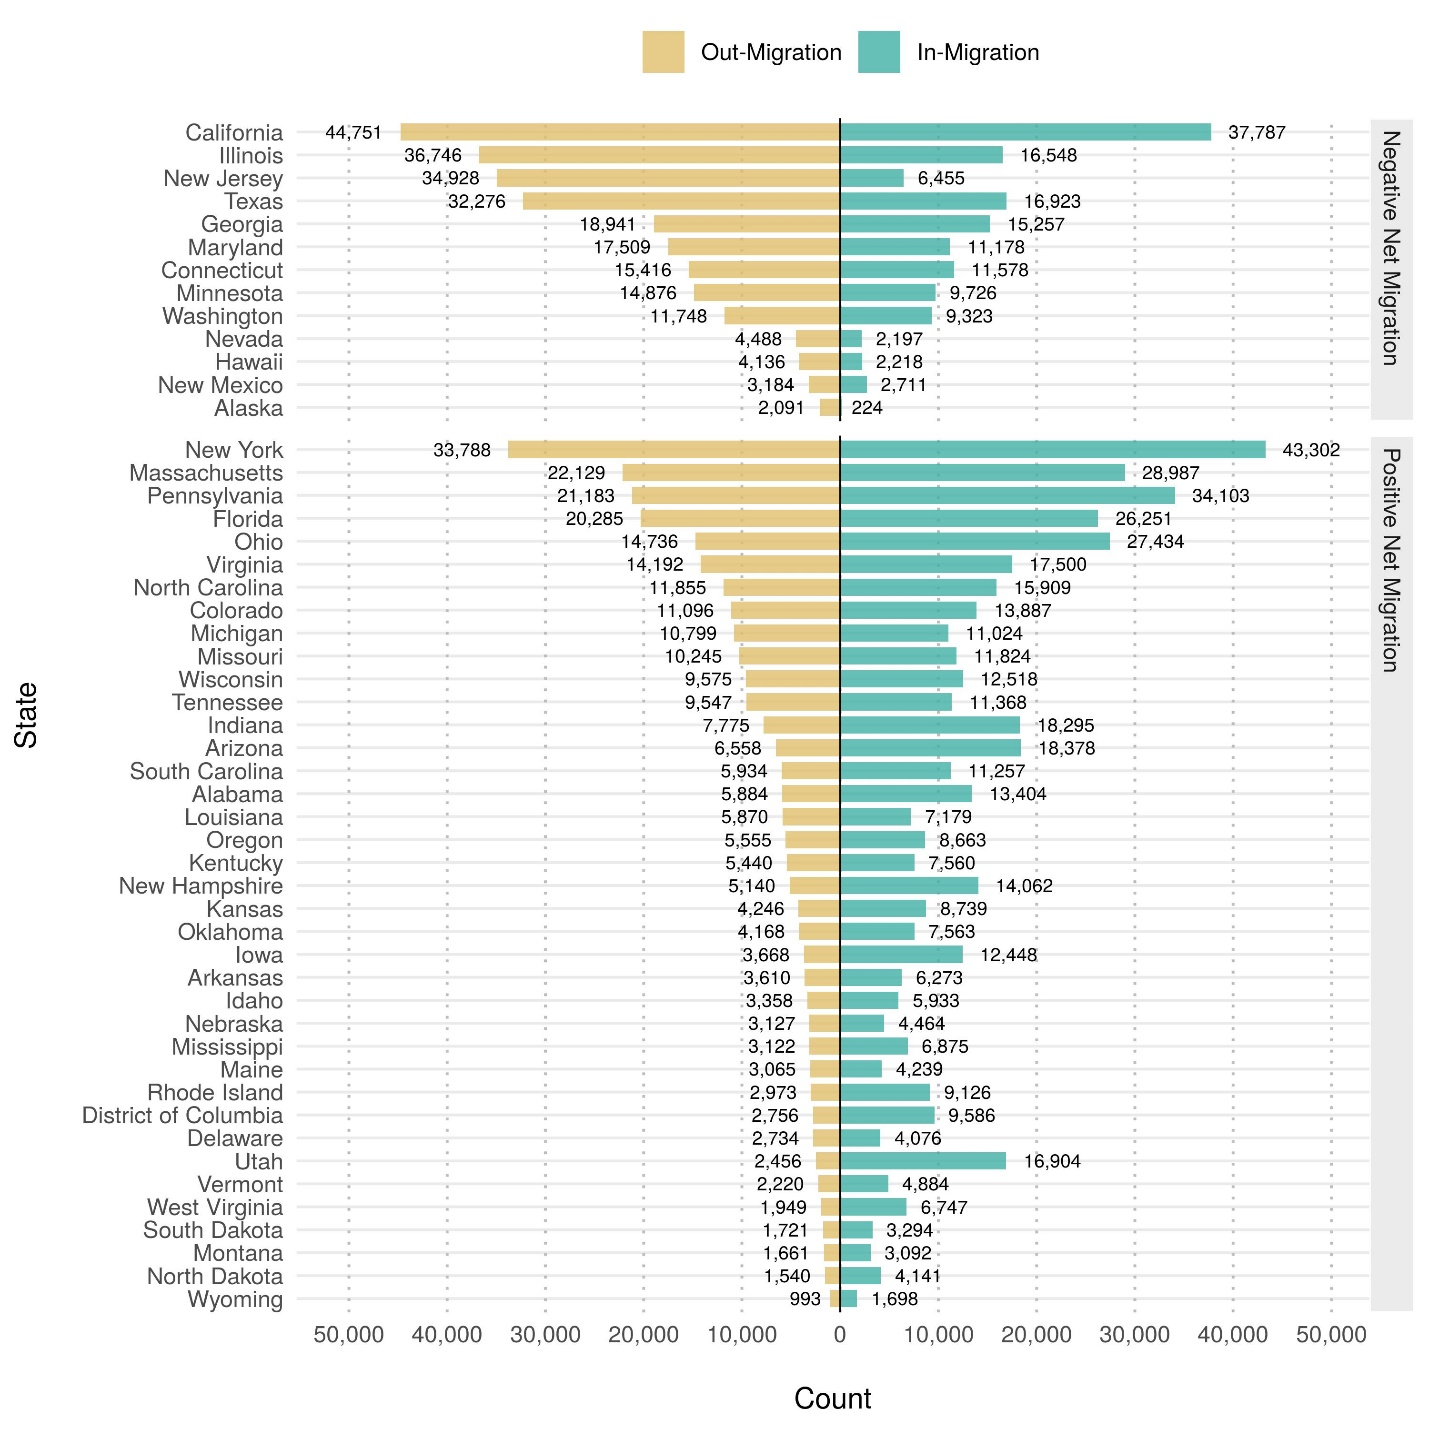
NOTE: The migration of students refers to students whose permanent address at the time of application to the institution is located in a different state or jurisdiction than the institution. Migration does not indicate a permanent change of address has occurred. Migration into the state or jurisdiction may include students who are nonresident aliens, who are from the other U.S. jurisdictions, or who reside outside the state or jurisdiction and are enrolled exclusively in online or distance education programs. Migration into the state or jurisdiction does not include individuals whose state or jurisdiction of residence is unknown.
SOURCE: U.S. Department of Education, National Center for Education Statistics, IPEDS, Spring 2019, Fall Enrollment component (provisional data).
Approximately three-quarters of states (37 out of 50) and the District of Columbia had a positive net migration of beginning college students in fall 2018 (figure 4). The remaining one-quarter of states (13 out of 50) had more residents out-migrate for college than nonresidents in-migrate for college, resulting in a negative net migration of beginning college students. Net migration varied widely by state, with New Jersey experiencing the largest negative net migration (28,500 students) and Utah experiencing the largest positive net migration (14,400 students).
Figure 4. Net migration of first-time degree/certificate-seeking undergraduate students at Title IV institutions, by state or jurisdiction: Fall 2018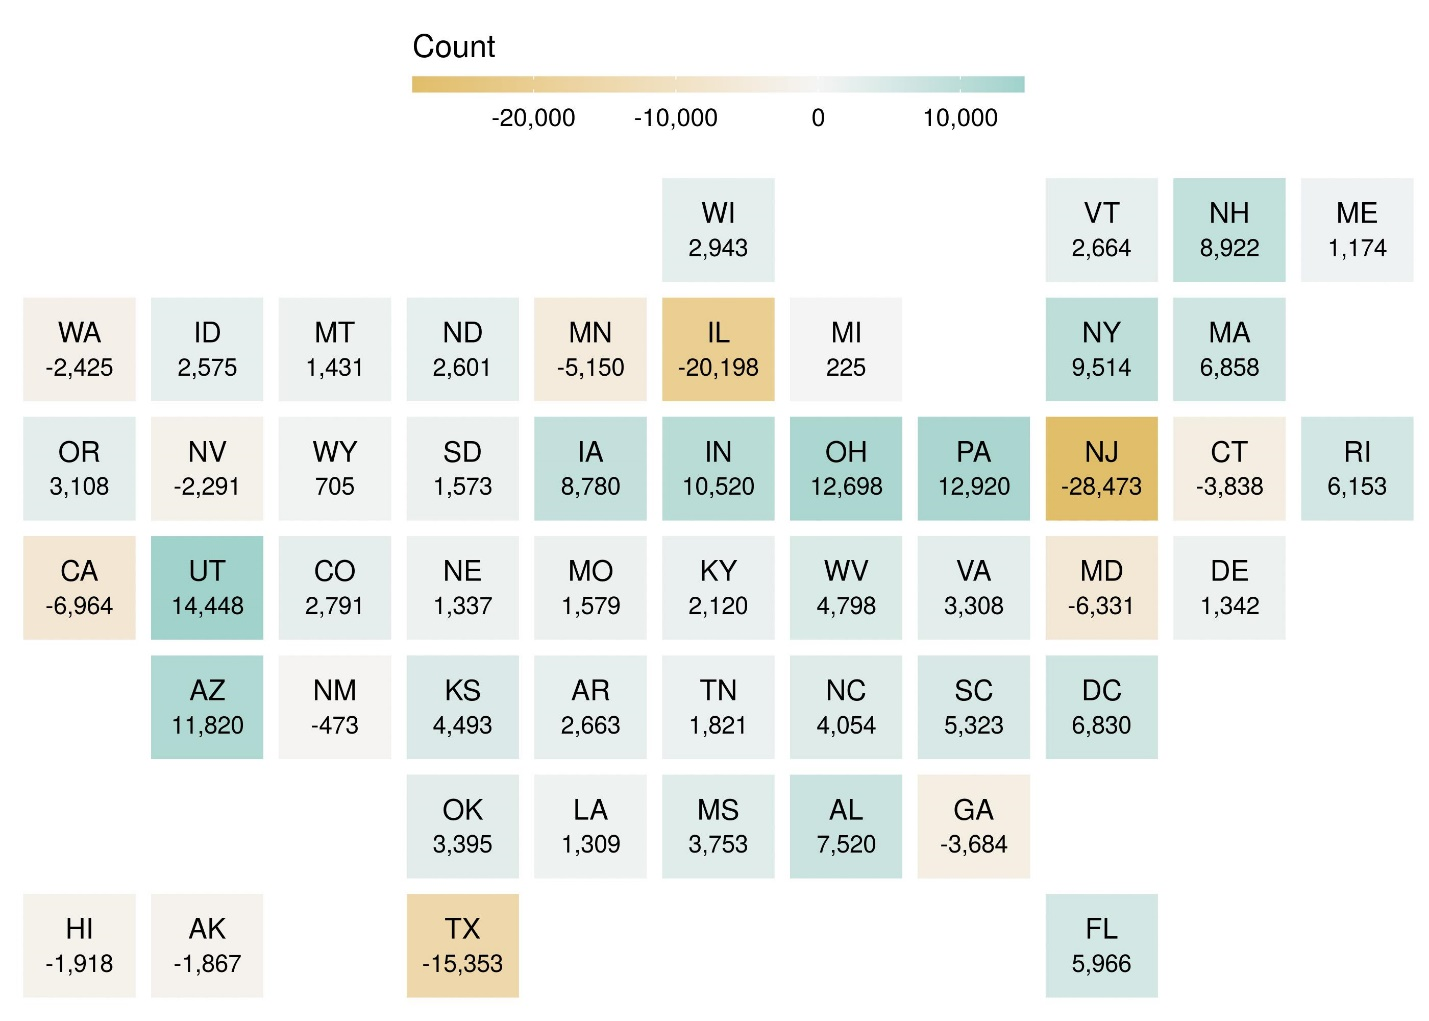
NOTE: Net migration is the difference between the number of students entering the state or jurisdiction to attend school (into) and the number of students (residents) who leave the state or jurisdiction to attend school elsewhere (out of). A positive net migration indicates more students coming into the state or jurisdiction than leaving to attend school elsewhere.
SOURCE: U.S. Department of Education, National Center for Education Statistics, IPEDS, Spring 2019, Fall Enrollment component (provisional data).
The newly released IPEDS Fall Enrollment data provide tremendous insights into the geographic mobility of beginning college students. Additional analyses on residence and migration can be conducted using the full IPEDS data files. For example, the data can identify to which states and types of institutions beginning college students out-migrate and, conversely, from which states postsecondary institutions recruit their incoming classes.
By Roman Ruiz, AIR