IES Blog

Institute of Education Sciences

New Report Shows Increased Diversity in U.S. Schools, Disparities in Outcomes

The school-age population in the United States is becoming more racially and ethnically diverse. An NCES report released in February 2019, Status and Trends in the Education of Racial and Ethnic Groups 2018, examines how education experiences and outcomes vary among racial/ethnic groups. The report contains 36 indicators that cover preprimary to postsecondary education, as well as family background characteristics and labor force outcomes.

Between 2000 and 2017, the percentage of 5- to 17-year-olds who were White decreased from 62 to 51 percent, while the percentage who were Hispanic increased from 16 to 25 percent.


Figure 1. Percentage distribution of the U.S. resident population ages 5–17, by race/ethnicity: 2000 and 2017

# Rounds to zero.

NOTE: Data are for the resident population as of July 1 of the indicated year.

SOURCE: U.S. Department of Commerce, Census Bureau, 2000 Population Estimates, retrieved August 14, 2012, from http://www.census.gov/popest/data/national/asrh/2011/index.html; and 2017 Population Estimates, retrieved September 5, 2017, from https://www.census.gov/data/datasets/2016/demo/popest/nation-detail.html. See Digest of Education Statistics 2017, table 101.20.


Prior research shows that living in poverty during early childhood is associated with lower-than-average academic performance that begins in kindergarten[1] and extends through high school, leading to lower-than-average rates of school completion.[2] In 2016, the percentages of children living in poverty were highest for Black and American Indian/Alaska Native children and lowest for White and Asian children.


Figure 2. Percentage of children under age 18 living in poverty, by race/ethnicity: 2016

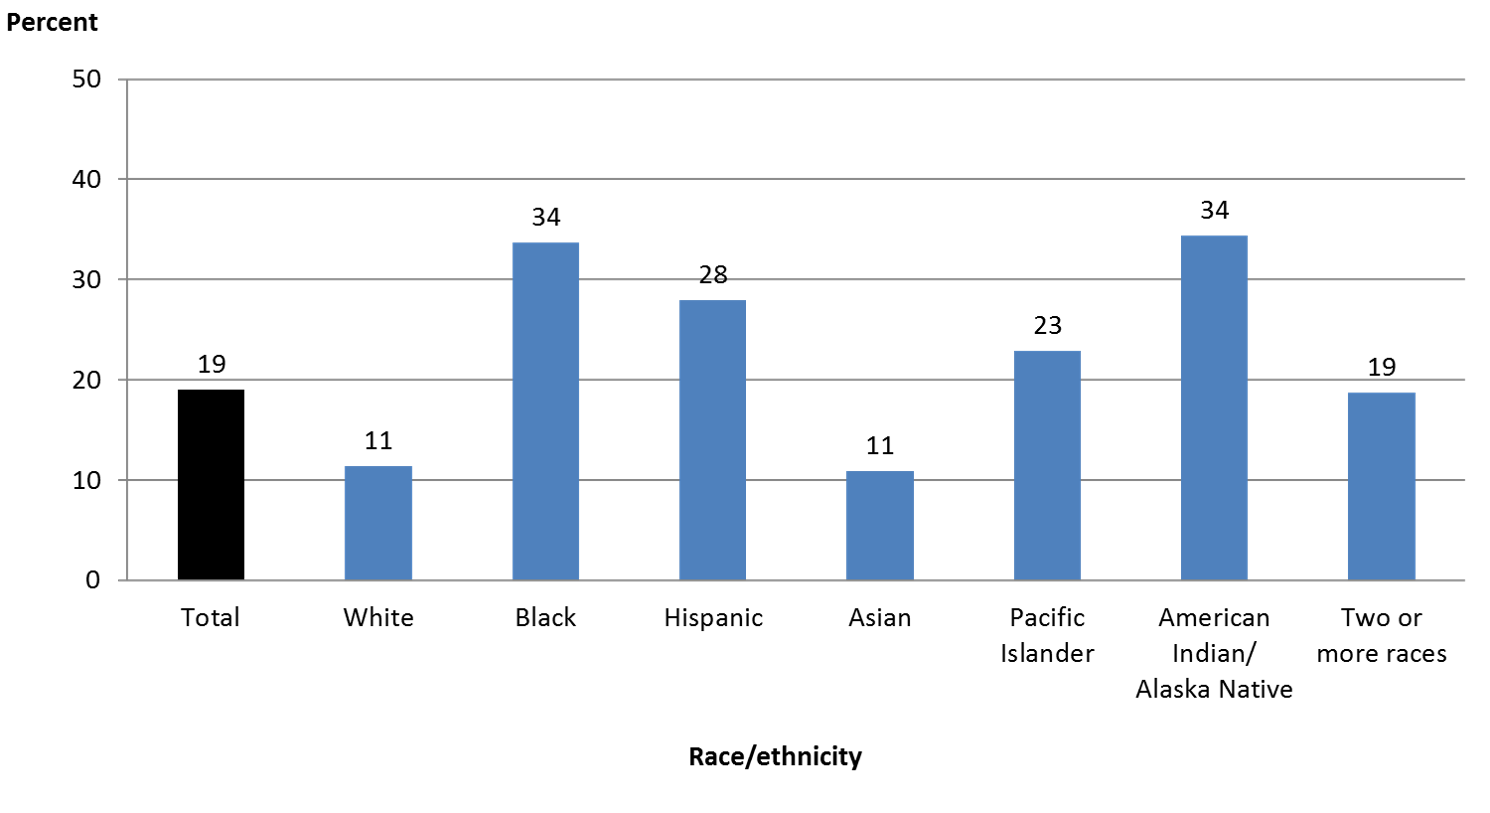
NOTE: Data shown are based only on related children in a family; that is, all children in the household who are related to the householder by birth, marriage, or adoption (except a child who is the spouse of the householder).

SOURCE: U.S. Department of Commerce, Census Bureau, American Community Survey (ACS), 2016. See Digest of Education Statistics 2017, table 102.60.


The National Assessment of Educational Progress (NAEP)—given to a representative sample of students across the United States—measures student performance over time in various subjects (including reading, math, and science) at grades 4, 8, and 12. Average grade 4 reading scores were higher in 2017 than in 1992 for the racial/ethnic groups with available data. Between 1992 and 2017, the White-Black score gap narrowed from 32 points in 1992 to 26 points in 2017. However, the White-Hispanic gap in 2017 was not measurably different from the corresponding gap in 1992.


Figure 3. Average National Assessment of Educational Progress (NAEP) reading scale scores of grade 4 students, by selected race/ethnicity: 1992 and 2017

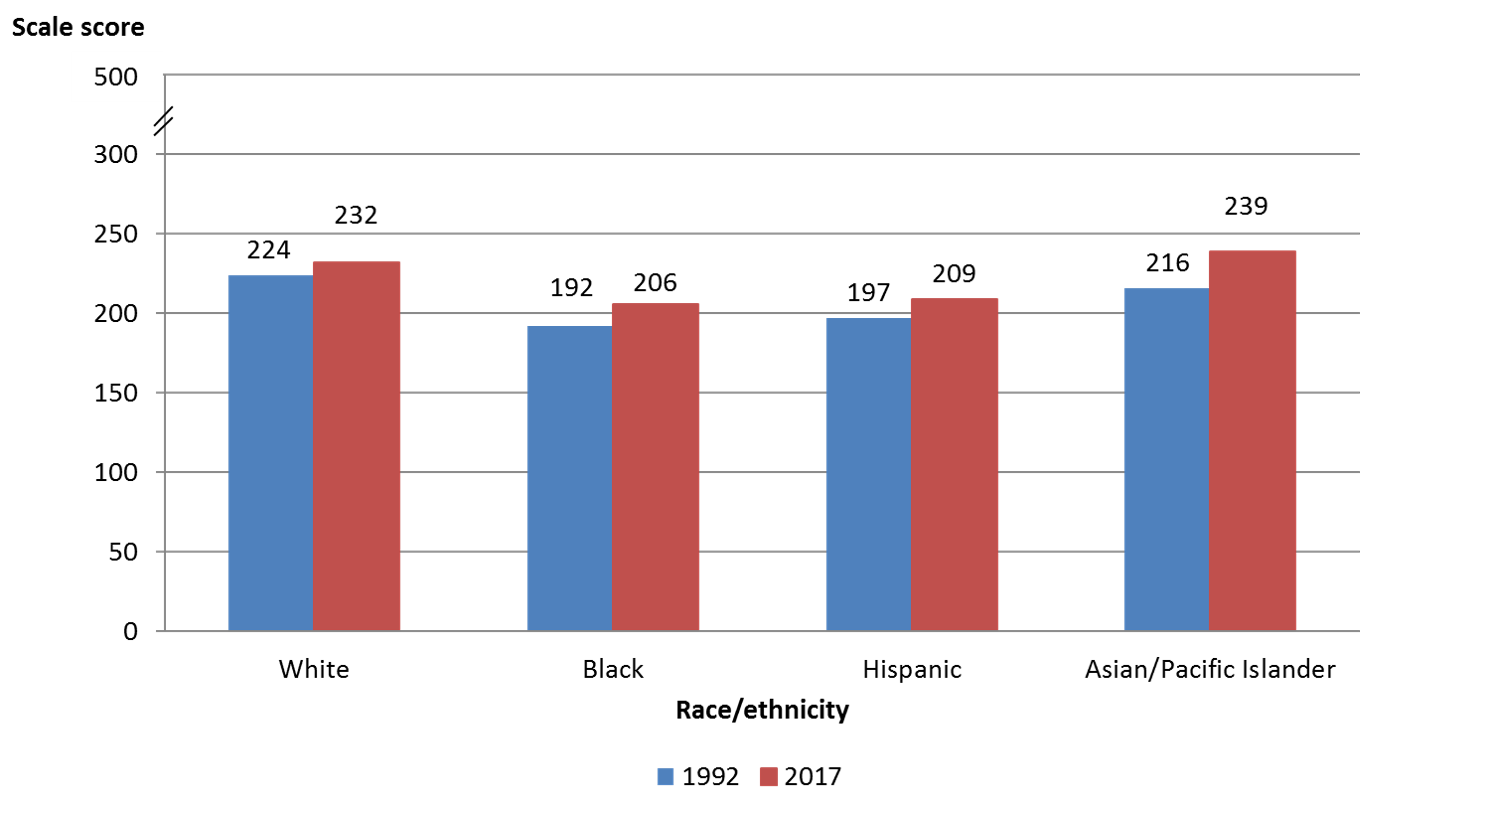
NOTE: Includes public and private schools. Testing accommodations (e.g., extended time, small group testing) for children with disabilities and English language learners were not permitted in 1992.

SOURCE: U.S. Department of Education, National Center for Education Statistics, National Assessment of Educational Progress (NAEP), 1992 and 2017 Reading Assessments, NAEP Data Explorer. See Digest of Education Statistics 2017, table 221.10.


Looking at higher education, between 2000 and 2016, the largest changes in the racial/ethnic composition of undergraduate students were for White students and Hispanic students. The share of undergraduates who were White decreased from 70 to 56 percent, and the share who were Hispanic increased from 10 to 19 percent.


Figure 4. Percentage of total undergraduate student enrollment in degree-granting institutions, by race/ethnicity: Fall 2000 and fall 2016

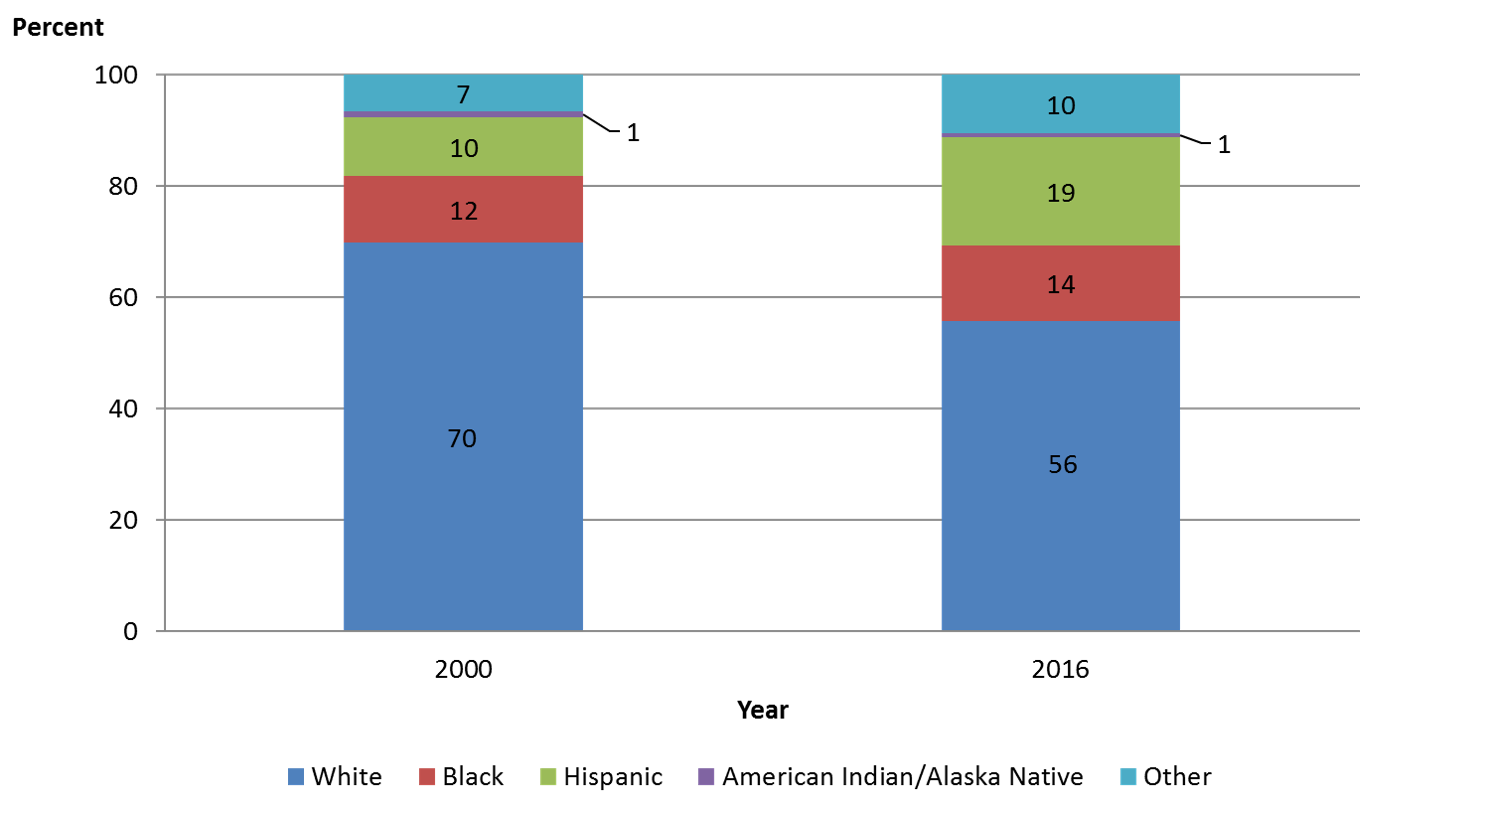
NOTE: Other includes Asian students, Pacific Islander students, and students of Two or more races.

SOURCE: U.S. Department of Education, National Center for Education Statistics, Integrated Postsecondary Education Data System (IPEDS), Spring 2001 and Spring 2017, Fall Enrollment component. See Digest of Education Statistics 2017, table 306.10.


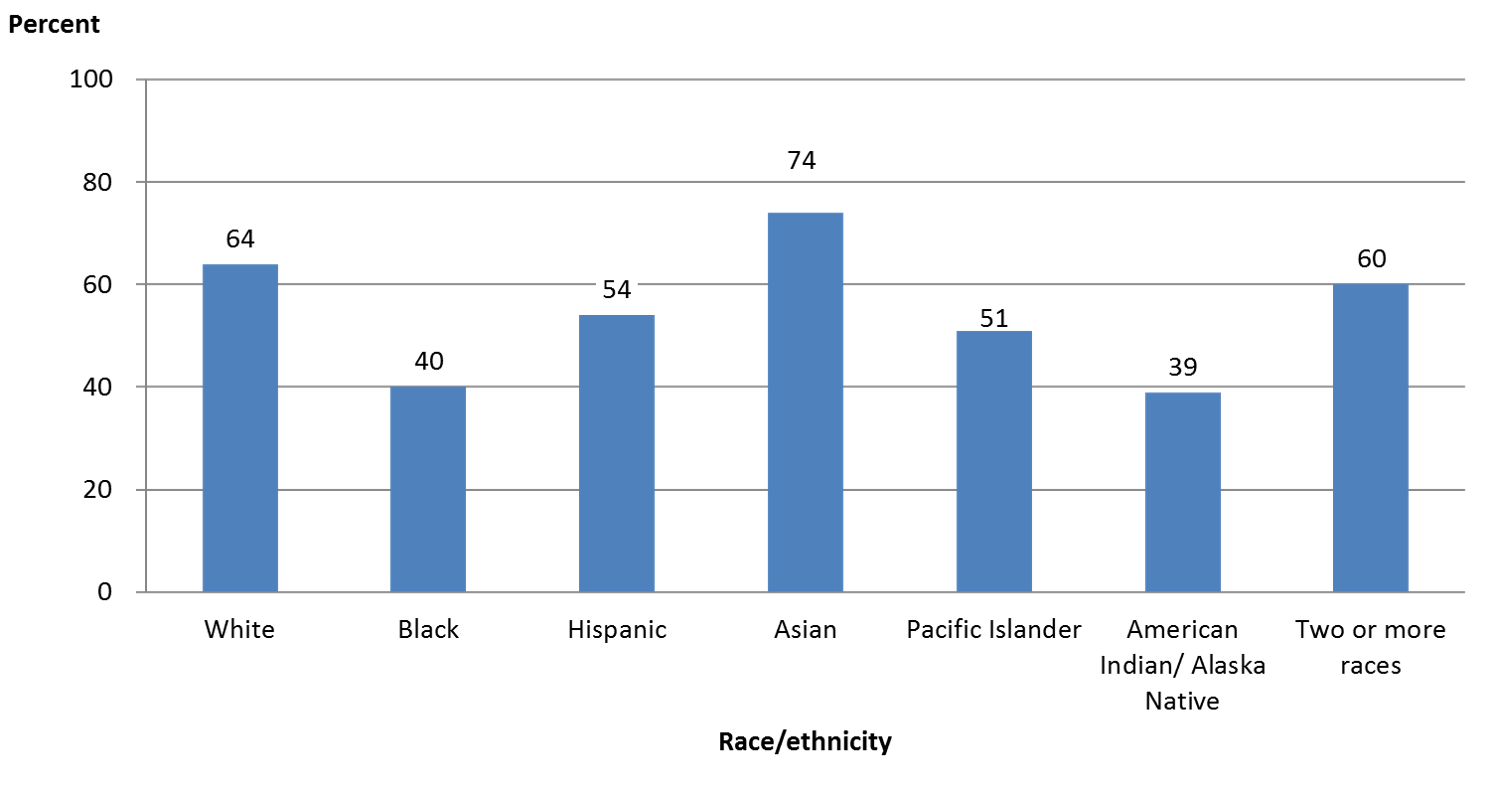
Postsecondary graduation rates vary widely by racial/ethnic group. For instance, among first-time students at 4-year institutions who enrolled in 2010, 74 percent of Asian students had graduated within 6 years. This was approximately 35 percentage points higher than the graduation rates for American Indian/Alaska Native students and Black students.   


Figure 5: Graduation rates within 6 years from first institution attended for first-time, full-time bachelor's degree-seeking students at 4-year postsecondary institutions, by race/ethnicity: Cohort entry year 2010

SOURCE: U.S. Department of Education, National Center for Education Statistics, Integrated Postsecondary Education Data System (IPEDS), Winter 2016–17, Graduation Rates component. See Digest of Education Statistics 2017, table 326.10.


The report also includes a new spotlight indicator, which highlights institutions that serve a large number of students from minority racial and ethnic groups. For instance, historically Black colleges and universities (HBCUs) are defined as “any historically Black college or university that was established prior to 1964, whose principal mission was, and is, the education of Black Americans.” In fall 2016, there were 102 HBCUs that enrolled over 292,000 students, 77 percent of whom were Black.


The spotlight also highlights other groups of minority-serving institutions—Hispanic-serving institutions, Tribally controlled colleges and universities, and Asian American and Native American Pacific Islander-serving institutions—describes how an institution is recognized as belonging to one of these groups, and discusses other institution characteristics, such as enrollment and degrees conferred.

For more information, visit the report’s website, where you can browse the indicators or download the full report


By Cris de Brey


[1] Mulligan, G.M., Hastedt, S., and McCarroll, J.C. (2012). First-Time Kindergartners in 2010–11: First Findings From the Kindergarten Rounds of the Early Childhood Longitudinal Study, Kindergarten Class of 2010–11 (ECLS-K:2011) (NCES 2012-049). U.S. Department of Education. Washington, DC: National Center for Education Statistics. Retrieved from https://nces.ed.gov/pubsearch/pubsinfo.asp?pubid=2012049.

[2] Ross, T., Kena, G., Rathbun, A., KewalRamani, A., Zhang, J., Kristapovich, P., and Manning, E. (2012). Higher Education: Gaps in Access and Persistence Study (NCES 2012-046). U.S. Department of Education. Washington, DC: National Center for Education Statistics. Retrieved from https://nces.ed.gov/pubsearch/pubsinfo.asp?pubid=2012046.

Announcing the Condition of Education 2019 Release

We are pleased to present The Condition of Education 2019, a congressionally mandated annual report summarizing the latest data on education in the United States. This report is designed to help policymakers and the public monitor educational progress. This year’s report includes 48 indicators on topics ranging from prekindergarten through postsecondary education, as well as labor force outcomes and international comparisons.

In addition to the regularly updated annual indicators, this year’s spotlight indicators show how recent NCES surveys have expanded our understanding of outcomes in postsecondary education.

The first spotlight examines the variation in postsecondary enrollment patterns between young adults who were raised in high- and low-socioeconomic status (SES) families. The study draws on data from the NCES High School Longitudinal Study of 2009, which collected data on a nationally representative cohort of ninth-grade students in 2009 and has continued to survey these students as they progress through postsecondary education. The indicator finds that the percentage of 2009 ninth-graders who were enrolled in postsecondary education in 2016 was 50 percentage points larger for the highest SES students (78 percent) than for the lowest SES students (28 percent). Among the highest SES 2009 ninth-graders who had enrolled in a postsecondary institution by 2016, more than three-quarters (78 percent) first pursued a bachelor’s degree and 13 percent first pursued an associate’s degree. In contrast, the percentage of students in the lowest SES category who first pursued a bachelor’s degree (32 percent) was smaller than the percentage who first pursued an associate’s degree (42 percent). In addition, the percentage who first enrolled in a highly selective 4-year institution was larger for the highest SES students (37 percent) than for the lowest SES students (7 percent).

The complete indicator, Young Adult Educational and Employment Outcomes by Family Socioeconomic Status, contains more information about how enrollment, persistence, choice of institution (public, private nonprofit, or private for-profit and 2-year or 4-year), and employment varied by the SES of the family in which young adults were raised.


Among 2009 ninth-graders who had enrolled in postsecondary education by 2016, percentage distribution of students' first credential pursued at first postsecondary institution, by socioeconomic status: 2016

1 Socioeconomic status was measured by a composite score of parental education and occupations and family income in 2009.
NOTE: Postsecondary outcomes are as of February 2016, approximately 3 years after most respondents had completed high school. Although rounded numbers are displayed, the figures are based on unrounded data. Detail may not sum to totals because of rounding.

SOURCE: U.S. Department of Education, National Center for Education Statistics, High School Longitudinal Study of 2009 (HSLS:09), Base Year and Second Follow-up. See Digest of Education Statistics 2018, table 302.44.


The second spotlight explores new data on postsecondary outcomes, including completion and transfer rates, for nontraditional undergraduate students. While the Integrated Postsecondary Education Data System formerly collected outcomes data only for first-time, full-time students, a new component of the survey includes information on students who enroll part time, transfer among institutions, or leave postsecondary education temporarily but later enroll again. These expanded data are particularly important for 2-year institutions, where higher percentages of students are nontraditional. For example, the indicator finds that, among students who started at public 2-year institutions in 2009, completion rates 8 years after entry were higher among full-time students (30 percent for first-time students and 38 percent for non-first-time students) than among part-time students (16 percent for first-time students and 21 percent for non-first-time students). Also at public 2-year institutions, transfer rates 8 years after entry were higher among non-first-time students (37 percent for part-time students and 30 percent for full-time students) than among first-time students (24 percent for both full-time and part-time students).

For more findings, including information on outcomes for nontraditional students at 4-year institutions, read the complete indicator, Postsecondary Outcomes for Nontraditional Undergraduate Students.


Percentage distribution of students' postsecondary outcomes 8 years after beginning at 2-year institutions in 2009, by initial attendance level and status: 2017

# Rounds to zero.
1 Attendance level (first-time or non-first-time student) and attendance status (full-time or part-time student) are based on the first full term (i.e., semester or quarter) after the student entered the institution. First-time students are those who had never attended a postsecondary institution prior to their 2009–10 entry into the reporting institution.
2 Includes certificates, associate’s degrees, and bachelor’s degrees. Includes only those awards that were conferred by the reporting institution (i.e., the institution the student entered in 2009–10); excludes awards conferred by institutions to which the student later transferred.
3 Refers to the percentage of students who were known transfers (i.e., those who notified their initial postsecondary institution of their transfer). The actual transfer rate (including students who transferred, but did not notify their initial institution) may be higher.
4 Includes students who dropped out of the reporting institution and students who transferred to another institution without notifying the reporting institution.
NOTE: The 2009 entry cohort includes all degree/certificate-seeking undergraduate students who entered a degree-granting institution between July 1, 2009, and June 30, 2010. Student enrollment status and completion status are determined as of August 31 of the year indicated; for example, within 8 years after the student’s 2009–10 entry into the reporting institution means by August 31, 2018. Detail may not sum to totals because of rounding. Although rounded numbers are displayed, the figures are based on unrounded data.

SOURCE: U.S. Department of Education, National Center for Education Statistics, Integrated Postsecondary Education Data System (IPEDS), Winter 2017–18, Outcome Measures component; and IPEDS Fall 2009, Institutional Characteristics component. See Digest of Education Statistics 2018, table 326.27.


The Condition of Education includes an At a Glance section, which allows readers to quickly make comparisons within and across indicators, and a Highlights section, which captures key findings from each indicator. The report also contains a Reader’s Guide, a Glossary, and a Guide to Sources that provide additional background information. Each indicator provides links to the source data tables used to produce the analyses.

As new data are released throughout the year, indicators will be updated and made available on The Condition of Education website. In addition, NCES produces a wide range of reports and datasets designed to help inform policymakers and the public. For more information on our latest activities and releases, please visit our website or follow us on TwitterFacebook, and LinkedIn.


By James L. Woodworth, NCES Commissioner

IPEDS Finance Data Reveal How Pension Benefits May Contribute to the Growth of Public Postsecondary Institutions’ Financial Liabilities

In the long-standing conversation of high college costs, ever wonder what public colleges and universities owe? For Fiscal Year (FY) 2017, the National Center for Education Statistics (NCES) using the Integrated Postsecondary Education System (IPEDS) found that 1,624[1] public institutions carried debt and total financial obligations of $451 billion in current dollars (see figure 1).

New finance data from IPEDS can now provide more insight about these obligations than was previously available.

Several common financial obligations or liabilities[2] can be found across all U.S. postsecondary institutions. A portion of an institution’s liabilities can be attributed to pension benefits and contributions (i.e., pension liabilities). Since fiscal year 2015, IPEDS collected data on these obligations as a specific part of the total debt held by public postsecondary institutions.  For example, the total amount of pension benefits and contributions that public institutions owed their employees in FY 2017 was $95 billion (see figure 1).


Before FY 2015, institutions did not have to report to NCES their pension liabilities and the total liabilities for public institutions were $304 billion in FY 2014.  However, after the change in reporting standards, the total liabilities for all public institutions jumped to $395 billion in FY 2015. This increase is greater than increases in all other fiscal years from 2012 to 2017. This finding suggests that the implementation of the new pension reporting standards may have contributed to the change in the increasing trend of total liabilities data.

Reporting Change in Context

Prior to the revised pension reporting standards, dating back to 1997, public institutions reported the difference between their annual required contribution to the pension plan(s) and the actual annual contribution (e.g., net pension obligation). The revised standards—known as Government Accounting Standards Board (GASB) Statements 67 and 68—require institutions to report the entire unfunded pension amount (e.g., net pension liability), not just the amount of deficiency in annual payments.

Including the full current pension liability of the institution instead of the annual shortfall in pension funding of the institution resulted in large shifts in the balance sheet of many public institutions. For example, if an institution had a total of $2 million in pension liabilities, prior to 2015 this institution would not report the $2 million in net pension liabilities, just the amount below the required contribution for that year that was actually paid. Now, this institution must report the full $2 million in net pension liabilities, even if the annual required contribution had been paid in full. This revision of the financial reporting standards resulted in increased transparency and accuracy of the total amount of liabilities reported by institutions.

Additional IPEDS Resources

NCES encourages educational researchers to use IPEDS data—a primary source on U.S. colleges, universities, and technical and vocational institutions. For more information about the IPEDS data, visit the IPEDS Survey Components page.

While finance data from the IPEDS collection may seem to be targeted for accountants and business officers, researchers interested in a postsecondary institution’s financial health can explore through expense and revenue metrics, resulting in possible data-driven, bellwether information. To learn more about an institution’s finance data, in particular its pension benefits, click here for the current finance survey materials; archived changes to the survey materials in 2015–16 (FY 2015)—such as the implementation of the new pension reporting standards; and links to Video Tutorials, FAQs, glossary definitions and other helpful resources.  


 By Bao Le, Aida Ali Akreyi, and Gigi Jones


[1] This total includes 735 four-year public institutions, 889 two-year public institutions, and 63 administrative public system offices (41 four-year and 22 two-year offices). Administrative system offices can report on behalf of their campuses. The four non-Title IV-eligible U.S. service academics are not included.

[2] Liabilities include long-term debts (current and noncurrent) as well as other current and noncurrent liabilities such as pensions, compensated absences, claims and judgments, etc.

Explore Transfer Student Data from the Integrated Postsecondary Education Data System (IPEDS)

Transfer students who attend full time complete a degree at higher rates than those attending part time. There were 2.1 million students who transferred into a 4-year institution during the 2009-10 academic year. At public institutions, which had the majority of transfer students (1.3 million) in 2009-10, 61 percent of full-time transfers completed their degree after 8 years of entering the institution, compared to 32 percent of part-time transfers (figure 1).


While NCES data users may be more familiar with the postsecondary transfer student data in the Beginning Postsecondary Study, NCES also collects data on this topic through the Integrated Postsecondary Education Data System (IPEDS) collection. IPEDS annually requires over 4,000 colleges and universities to report their transfer data starting from enrollment to completion. As defined by IPEDS, students who transfer into an institution with prior postsecondary experience–whether credit was earned or not–are considered transfer-in students. Students who leave an institution without completing their program of study and subsequently enrolled in another institution are defined as transfer-out students.

Below are some of the key data collected on student transfers through the different IPEDS survey components:

  • Fall Enrollment (EF): Transfer-in data

Collected since 2006-07, institutions report the fall census count and specific characteristics—i.e., gender, race/ethnicity, and attendance status (full and part time)—of transfer-in students.

  • Graduation Rates (GR): Transfer-out data

Collected since 1997-98, GR collects counts of students who are part of a specific first-time, full-time student cohort. Data users can calculate the transfer-out rates of first-time, full-time students by race/ethnicity and gender for each institution that reports transfer-out data. NCES requires the reporting of transfer-out data if the mission of the institution includes providing substantial preparation for students to enroll in another eligible institution without having completed a program. If it is not part of the institution’s mission, an institution has the option to report transfer-out data.

  • Outcome Measures (OM): Transfer-in and transfer-out data

Collected since 2015-16, OM collects information on entering students who are first-time students as well as non-first-time students (i.e., transfer-in students). Institutions report on the completions of transfer-in students at three points in time: at 4, 6, and 8 years. Also, any entering student who does not earn an award (i.e., certificate, associate’s degree, or bachelor’s degree), leaves the institution, and subsequently enrolls in another institution is reported as a transfer-out student. Click to learn more about OM. All institutions reporting to OM must report their transfer-out students regardless of mission.


NCES has been collecting IPEDS for several decades, which allows for trend analysis. Check out the IPEDS Trend Generator’s quick analysis of transfer-in students' fall enrollment. Also, the National Postsecondary Education Cooperative commissioned a 2018 paper that provides a high-level examination of the most common issues regarding U.S. postsecondary transfer students and presents suggestions on how NCES could enhance its student transfer data collection. For example, one caveat to using IPEDS transfer data is that information on where students transfer from or to is not collected. This means IPEDS data cannot be used to describe the various pathways of transfer students, such as reverse, swirling, and lateral transferring.[1]. While these nuances are important in today’s transfer research, they are out of the scope of the IPEDS collection. However, IPEDS data do provide a valuable national look at transfers and at the institutions that serve them. 


[1] A reverse transfer is defined as a student who transfers from a high-level institution to a low-level institution (e.g., transferring from a 4-year institution to a 2-year institution). Students who take a swirling pathway move back and forth between multiple institutions. A lateral transfer student is a student who transfers to another institution at a similar level (e.g., 4-year to 4-year or 2-year to 2-year). 


By Gigi Jones


Classification of Instructional Programs and the 2020 Update

How many bachelor’s degrees in computer science were awarded to women last year? What is Megatronics? What colleges and universities in Rhode Island offer degree programs in Animal Science?1

These are examples of the many questions NCES receives related to fields of postsecondary study. The ability of NCES to provide information on these topics and many related questions rests on the standardized use of the Classification of Instructional Programs (CIP).                         

The CIP, a taxonomy of instructional programs, provides a classification system for the thousands of different programs offered by postsecondary institutions. Its purpose is to facilitate the organization, collection, and reporting of fields of study and program completions.

NCES uses CIP Codes in the Integrated Postsecondary Education Data System (IPEDS) Completion Survey to report how many degrees and certificates were awarded for each field of study. Each field is represented by a 6-digit CIP code, and classified according to 2- and 4-digit prefixes of the code. Each 6-digit CIP Code includes the following elements:  Numeric Code, Title, Description, Illustrative Example and Cross Reference. For example:


11.1003 Computer and Information Systems Security/Information Assurance.
A program that prepares individuals to assess the security needs of computer and network systems, recommend safeguard solutions, and manage the implementation and maintenance of security devices, systems, and procedures. Includes instruction in computer architecture, programming, and systems analysis; networking; telecommunications; cryptography; security system design; applicable law and regulations; risk assessment and policy analysis; contingency planning; user access issues; investigation techniques; and troubleshooting.

Examples: [Information Assurance], [IT Security], [Internet Security], [Network Security], [Information Systems Security]
See also: 43.0116 – Cyber/Computer Forensics and Counterterrorism


CIP Codes and IPEDS Completions Survey data are used by many different groups of people for many different reasons. For instance, economists use the data to study the emerging labor pools to identify people with specific training and skills. The business community uses IPEDS Completions Survey data to help recruit minority and female candidates in specialized fields, by identifying the numbers of these students who are graduating from specific institutions.  Prospective college students can use the data to look for institutions offering specific programs of postsecondary study at all levels, from certificates to doctoral degrees.


2020 CIP Update:  Call for Comments

The CIP was initiated in 1980 and has been revised four times since—in 1985, 1990, 2000, and 2010. The 2020 CIP will focus on identifying new and emerging programs of study and presenting an updated taxonomy of instructional program classifications and descriptions. A CIP code will be deleted only when there is strong evidence that it is no longer offered at any IPEDS postsecondary institutions. NCES tentatively plans to implement the CIP 2020 during the 2020–21 IPEDS collection year.

The 2020 CIP revision will be the first time that NCES has solicited comments from the general public about a planned revision. To view the 2020 CIP Federal Register Notice (FRN), please visit: https://www.regulations.gov/document?D=ED-2018-IES-0126-0002.  Comments regarding the 2020 CIP were submitted on the regulations.gov website through March 27, 2019.

UPDATE: Following the public comment and revision period, the final version of CIP:2020 was posted on July 1, 2019: https://nces.ed.gov/ipeds/cipcode/Default.aspx?y=56


By Michelle Coon

________________________________________________________________________

1How many bachelor’s degrees in computer science were awarded to women last year? A total of 4,134 women received a bachelor’s degree in computer science for the 2016–17 academic year.

What is Megatronics? A program that prepares individuals to apply mathematical and scientific principles to the design, development and operational evaluation of computer controlled electro-mechanical systems and products with embedded electronics, sensors, and actuators; and which includes, but is not limited to, automata, robots and automation systems. Includes instruction in mechanical engineering, electronic and electrical engineering, computer and software engineering, and control engineering.

What colleges and universities in Rhode Island offer degree programs in Animal Science? Only The University of Rhode Island offers degrees in Animal Science.