IES Blog

Institute of Education Sciences

NAEP Opens a Pathway to Exploring Student Problem Solving in Assessments

A newly released NCES First Look report, Response Process Data From the NAEP 2017 Grade 8 Mathematics Assessment (NCES 2020-068), introduces a new type of data—response process data—which was made available after the NAEP reading and math assessments transitioned from paper to digitally based assessments in 2017. These new datasets will allow researchers to go beyond analyzing students’ answers to questions as simply right or wrong; instead, researchers will be able to examine the amount of time students spend on questions, the pathways they take through the assessment sections, and the tools they use while solving problems. The new First Look report provides an overview of data that will be available when the restricted-use data files for the 2017 grade 8 mathematics response process data are released later this summer.

NAEP reporting has hinted previously at the promise of response process data. With the release of the 2017 mathematics assessment results, NCES included a feature on The Nation’s Report Card website to show the different steps students took while responding to a question that assessed their multiplication skills. The short video below shows that students used a total of 397 different sequences to group four digits into two factors that yield a given product. The most popular correct and incorrect answer paths are shown in the video. Response process data, such as those summarized in this example item, can open new avenues for understanding how students work through math problems and identifying more detailed elements of response processes that could lead to common math errors.


The First Look report describes the forthcoming data files that will enable researchers to access student response process data from two 30-minute blocks of grade 8 mathematics assessment questions (or a total of 29 test items) and a 15-minute survey questionnaire where students responded to questions about their demographic characteristics, opportunities to learn in and outside of school, and educational experiences. Researchers will be able to explore logs of the response process data collected from each student along with a file containing students’ raw responses and scored responses, time stamps, and demographics. In addition, researchers can explore a file that summarizes defined features of students’ interactions with the assessment, such as the number of seconds spent on specific questions or the number of times the calculator was opened across all students.

To explore this response process dataset, interested researchers should apply for a restricted-use license and request access to the files through the NCES website. By providing this dataset to a wide variety of researchers, NCES hopes to encourage and enable a new domain of research on developing best practices for the use and interpretation of student response process data.


By Jan Marie Alegre and Robert Finnegan, Educational Testing Service

New 2019 Reading and Mathematics Assessment Data on 4th- and 8th-Grade Students

The average reading score for U.S. 4th- and 8th-grade students decreased between 2017 and 2019. Changes in mathematics scores were mixed during this period, with an increase at grade 4 and a decrease at grade 8. These data are from the National Assessment of Educational Progress (NAEP)—also known as The Nation’s Report Card. NAEP is the largest nationally representative and continuing assessment of what students in the United States know and can do in various subject areas and is frequently referred to as the “gold standard” of student assessments.

In 4th-grade reading, the average scale score in 2019 was 220, one point lower than in 2017 (figure 1). In 8th-grade reading, the average scale score was 263, three points lower than in 2017 (figure 2). Compared with a decade ago in 2009, the 2019 average reading scale scores at each grade were not significantly different, but they were higher than the scale scores in 1992, the first time the reading assessment was administered.


Figure 1. Average National Assessment of Educational Progress (NAEP) reading scale scores of 4th-grade students: Selected years, 1992–2019

* Significantly different (p < .05) from 2019

--- Accommodations not permitted

— Accommodations permitted


Figure 2. Average National Assessment of Educational Progress (NAEP) reading scale scores of 8th-grade students: Selected years, 1992–2019

* Significantly different (p < .05) from 2019

--- Accommodations not permitted

— Accommodations permitted


In 4th-grade mathematics, the average scale score in 2019 was 241, one point higher than in 2017 (figure 3). In 8th-grade mathematics, the average scale score in 2019 was 282, one point lower than in 2017 (figure 4). Like reading, average scale scores for mathematics at both grades in 2019 were not significantly different than in 2009. Mathematics scale scores for both grade were higher in 2019 than in 1990, the first time the mathematics assessments were administered.


Figure 3. Average National Assessment of Educational Progress (NAEP) mathematics scale scores of 4th-grade students: Selected years, 1990–2019

* Significantly different (p < .05) from 2019

--- Accommodations not permitted

— Accommodations permitted


Figure 4. Average National Assessment of Educational Progress (NAEP) mathematics scale scores of 8th-grade students: Selected years, 1990–2019

* Significantly different (p < .05) from 2019

--- Accommodations not permitted

— Accommodations permitted


The Nation’s Report Card also presents data by different demographic groups—such as race/ethnicity—gender, school type, and region. White and Black 4th- and 8th-grade students scored lower in reading in 2019 than in 2017. Hispanic and American Indian/Alaska Native 8th-grade students also scored lower in reading in 2019 than in 2017. In mathematics, 4th-grade Hispanic students scored higher in 2019 than in 2017, and 8th-grade American Indian/Alaska Native students scored lower in 2019 than in 2017. From 2017 to 2019, males’ scores increased in mathematics at grade 4 but decreased in reading at both grades.

NCES administered the 2019 NAEP mathematics and reading assessments to almost 600,000 4th- and 8th-graders in public and private schools in all 50 states, the District of Columbia, the U.S. Department of Defense schools, and 27 urban districts. Samples of schools and students are drawn from each state and from the District of Columbia and Department of Defense schools.

Visit https://nces.ed.gov/nationsreportcard/ to view the report.

Data Tools for College Professors and Students

Ever wonder what parts of the country produce the most English majors? Want to know which school districts have the most guidance counselors? The National Center for Education Statistics (NCES) has all the tools you need to dig into these and lots of other data!

Whether you’re a student embarking on a research project or a college professor looking for a large data set to use for an assignment, NCES has you covered. Below, check out the tools you can use to conduct searches, download datasets, and generate your own statistical tables and analyses.


Conduct Publication Searches

Two search tools help researchers identify potential data sources for their study and explore prior research conducted with NCES data. The Publications & Products Search Tool can be used to search for NCES publications and data products. The Bibliography Search Tool, which is updated continually, allows users to search for individual citations from journal articles that have been published using data from most surveys conducted by NCES.

Key reference publications include the Digest of Education Statistics, which is a comprehensive library of statistical tabulations, and The Condition of Education, which highlights up-to-date trends in education through statistical indicators.


Learn with Instructional Modules

The Distance Learning Dataset Training System (DLDT) is an interactive online tool that allows users to learn about NCES data across the education spectrum. DLDT’s computer-based training introduces users to many NCES datasets, explains their designs, and offers technical considerations to facilitate successful analyses. Please see the NCES blog Learning to Use the Data: Online Dataset Training Modules for more details about the DLDT tool.


Download and Access Raw Data Files

Users have several options for conducting statistical analyses and producing data tables. Many NCES surveys release public-use raw data files that professors and students can download and analyze using statistical software packages like SAS, STATA, and SPSS. Some data files and syntax files can also be downloaded using NCES data tools:

  • Education Data Analysis Tool (EDAT) and the Online Codebook allow users to download several survey datasets in various statistical software formats. Users can subset a dataset by selecting a survey, a population, and variables relevant to their analysis.
  • Many data files can be accessed directly from the Surveys & Programs page by clicking on the specific survey and then clicking on the “Data Products” link on the survey website.


Generate Analyses and Tables

NCES provides several online analysis tools that do not require a statistical software package:

  • DataLab is a tool for making tables and regressions that features more than 30 federal education datasets. It includes three powerful analytic tools:
    • QuickStats—for creating simple tables and charts.
    • PowerStats—for creating complex tables and logistic and linear regressions.
    • TrendStats—for creating complex tables spanning multiple data collection years. This tool also contains the Tables Library, which houses more than 5,000 published analysis tables by topic, publication, and source.


  • National Assessment of Educational Progress (NAEP) Data Explorer can be used to generate tables, charts, and maps of detailed results from national and state assessments. Users can identify the subject area, grade level, and years of interest and then select variables from the student, teacher, and school questionnaires for analysis.
  • International Data Explorer (IDE) is an interactive tool with data from international assessments and surveys, such as the Program for International Student Assessment (PISA), the Program for the International Assessment of Adult Competencies (PIAAC), and the Trends in International Mathematics and Science Study (TIMSS). The IDE can be used to explore student and adult performance on assessments, create a variety of data visualizations, and run statistical tests and regression analyses.
  • Elementary/Secondary Information System (ElSi) allows users to quickly view public and private school data and create custom tables and charts using data from the Common Core of Data (CCD) and Private School Universe Survey (PSS).
  • Integrated Postsecondary Education Data System (IPEDS) Use the Data provides researcher-focused access to IPEDS data and tools that contain comprehensive data on postsecondary institutions. Users can view video tutorials or use data through one of the many functions within the portal, including the following:
    • Data Trends—Provides trends over time for high-interest topics, including enrollment, graduation rates, and financial aid.
    • Look Up an Institution—Allows for quick access to an institution’s comprehensive profile. Shows data similar to College Navigator but contains additional IPEDS metrics.
    • Statistical Tables—Equips power users to quickly get data and statistics for specific measures, such as average graduation rates by state.


New Report Shows Increased Diversity in U.S. Schools, Disparities in Outcomes

The school-age population in the United States is becoming more racially and ethnically diverse. An NCES report released in February 2019, Status and Trends in the Education of Racial and Ethnic Groups 2018, examines how education experiences and outcomes vary among racial/ethnic groups. The report contains 36 indicators that cover preprimary to postsecondary education, as well as family background characteristics and labor force outcomes.

Between 2000 and 2017, the percentage of 5- to 17-year-olds who were White decreased from 62 to 51 percent, while the percentage who were Hispanic increased from 16 to 25 percent.


Figure 1. Percentage distribution of the U.S. resident population ages 5–17, by race/ethnicity: 2000 and 2017

# Rounds to zero.

NOTE: Data are for the resident population as of July 1 of the indicated year.

SOURCE: U.S. Department of Commerce, Census Bureau, 2000 Population Estimates, retrieved August 14, 2012, from http://www.census.gov/popest/data/national/asrh/2011/index.html; and 2017 Population Estimates, retrieved September 5, 2017, from https://www.census.gov/data/datasets/2016/demo/popest/nation-detail.html. See Digest of Education Statistics 2017, table 101.20.


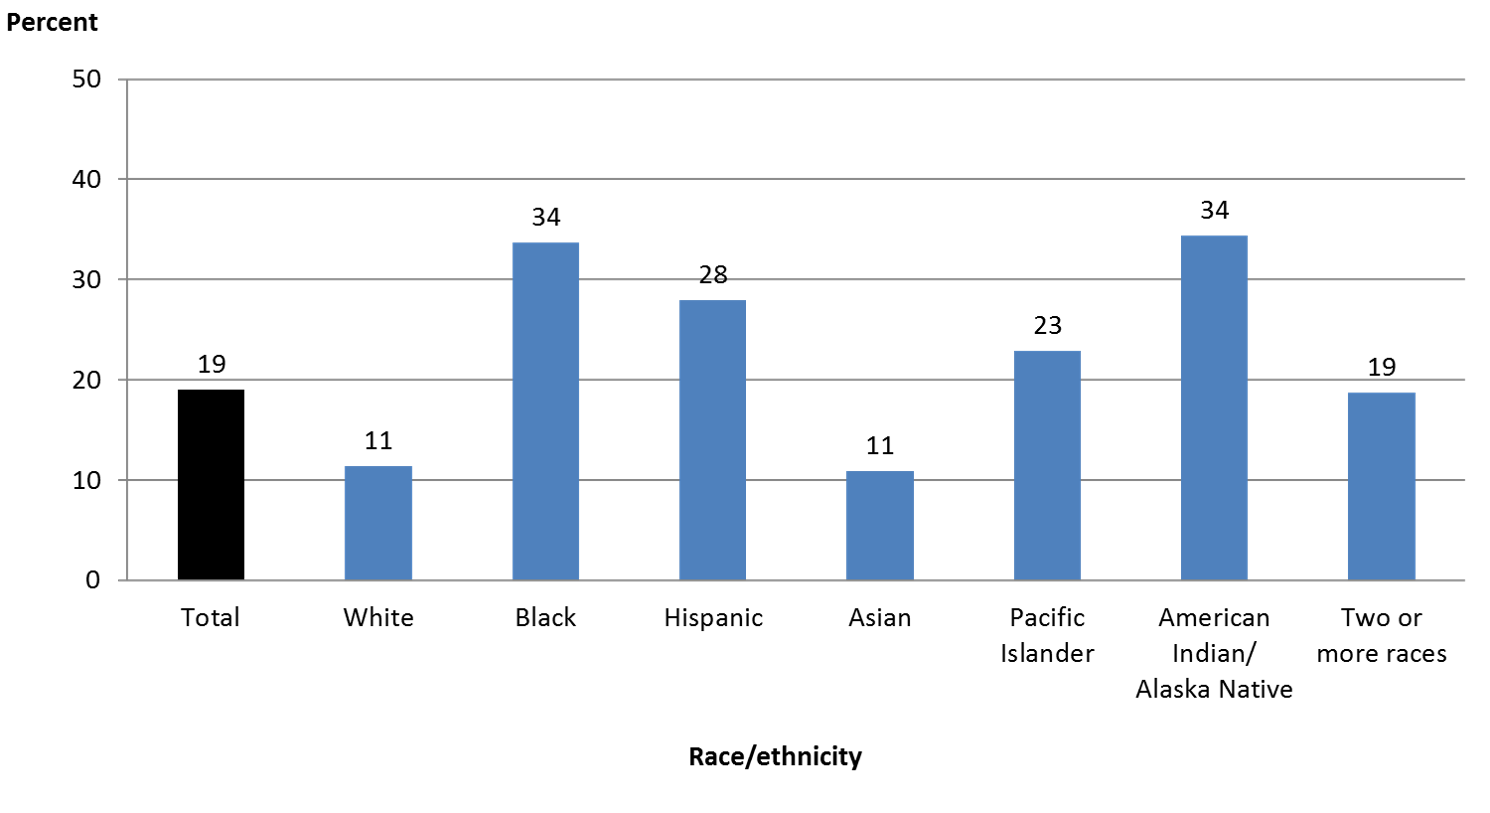
Prior research shows that living in poverty during early childhood is associated with lower-than-average academic performance that begins in kindergarten[1] and extends through high school, leading to lower-than-average rates of school completion.[2] In 2016, the percentages of children living in poverty were highest for Black and American Indian/Alaska Native children and lowest for White and Asian children.


Figure 2. Percentage of children under age 18 living in poverty, by race/ethnicity: 2016
NOTE: Data shown are based only on related children in a family; that is, all children in the household who are related to the householder by birth, marriage, or adoption (except a child who is the spouse of the householder).

SOURCE: U.S. Department of Commerce, Census Bureau, American Community Survey (ACS), 2016. See Digest of Education Statistics 2017, table 102.60.


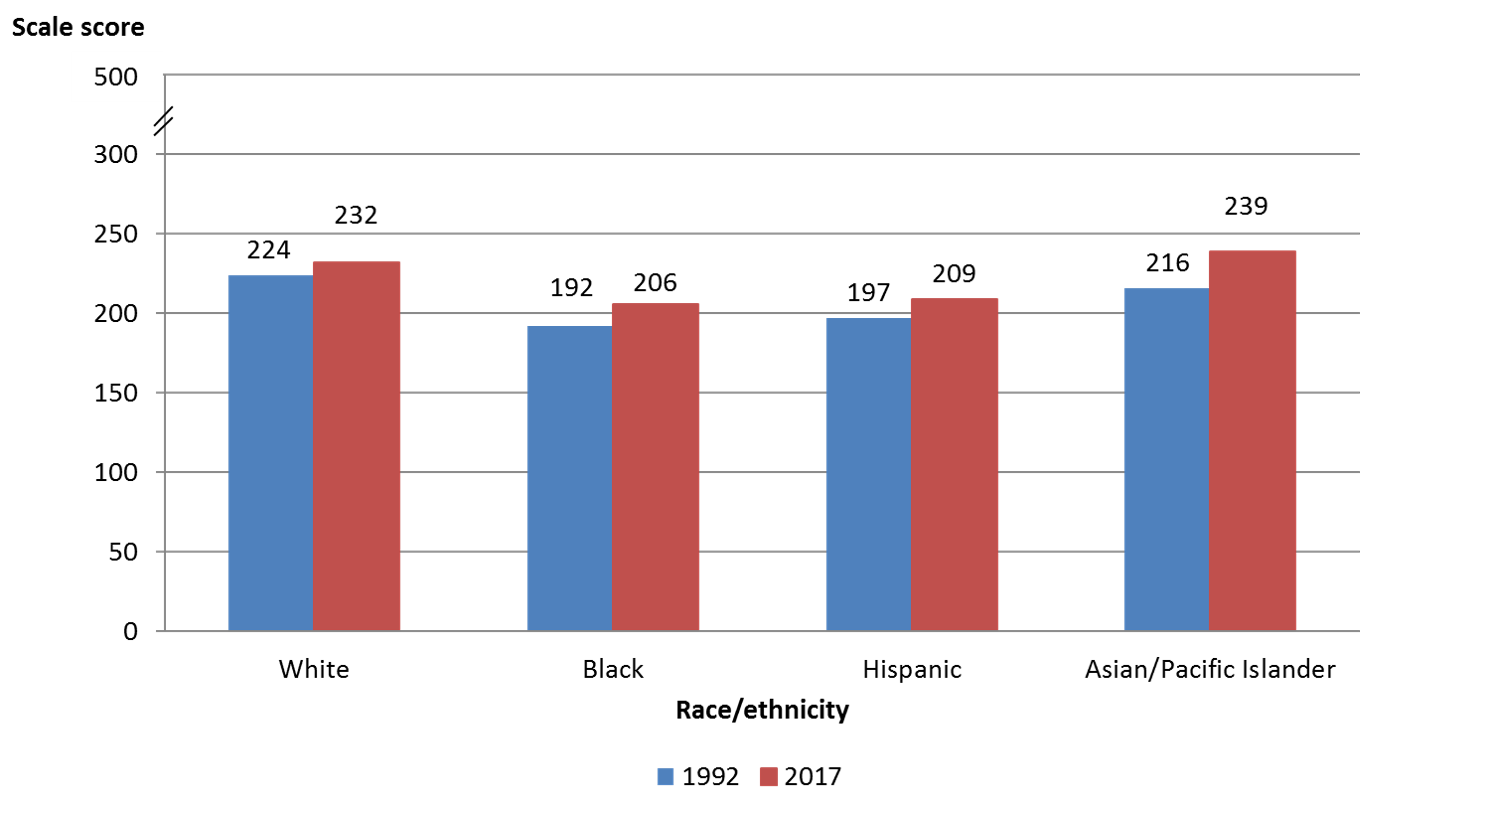
The National Assessment of Educational Progress (NAEP)—given to a representative sample of students across the United States—measures student performance over time in various subjects (including reading, math, and science) at grades 4, 8, and 12. Average grade 4 reading scores were higher in 2017 than in 1992 for the racial/ethnic groups with available data. Between 1992 and 2017, the White-Black score gap narrowed from 32 points in 1992 to 26 points in 2017. However, the White-Hispanic gap in 2017 was not measurably different from the corresponding gap in 1992.


Figure 3. Average National Assessment of Educational Progress (NAEP) reading scale scores of grade 4 students, by selected race/ethnicity: 1992 and 2017
NOTE: Includes public and private schools. Testing accommodations (e.g., extended time, small group testing) for children with disabilities and English language learners were not permitted in 1992.

SOURCE: U.S. Department of Education, National Center for Education Statistics, National Assessment of Educational Progress (NAEP), 1992 and 2017 Reading Assessments, NAEP Data Explorer. See Digest of Education Statistics 2017, table 221.10.


Looking at higher education, between 2000 and 2016, the largest changes in the racial/ethnic composition of undergraduate students were for White students and Hispanic students. The share of undergraduates who were White decreased from 70 to 56 percent, and the share who were Hispanic increased from 10 to 19 percent.


Figure 4. Percentage of total undergraduate student enrollment in degree-granting institutions, by race/ethnicity: Fall 2000 and fall 2016
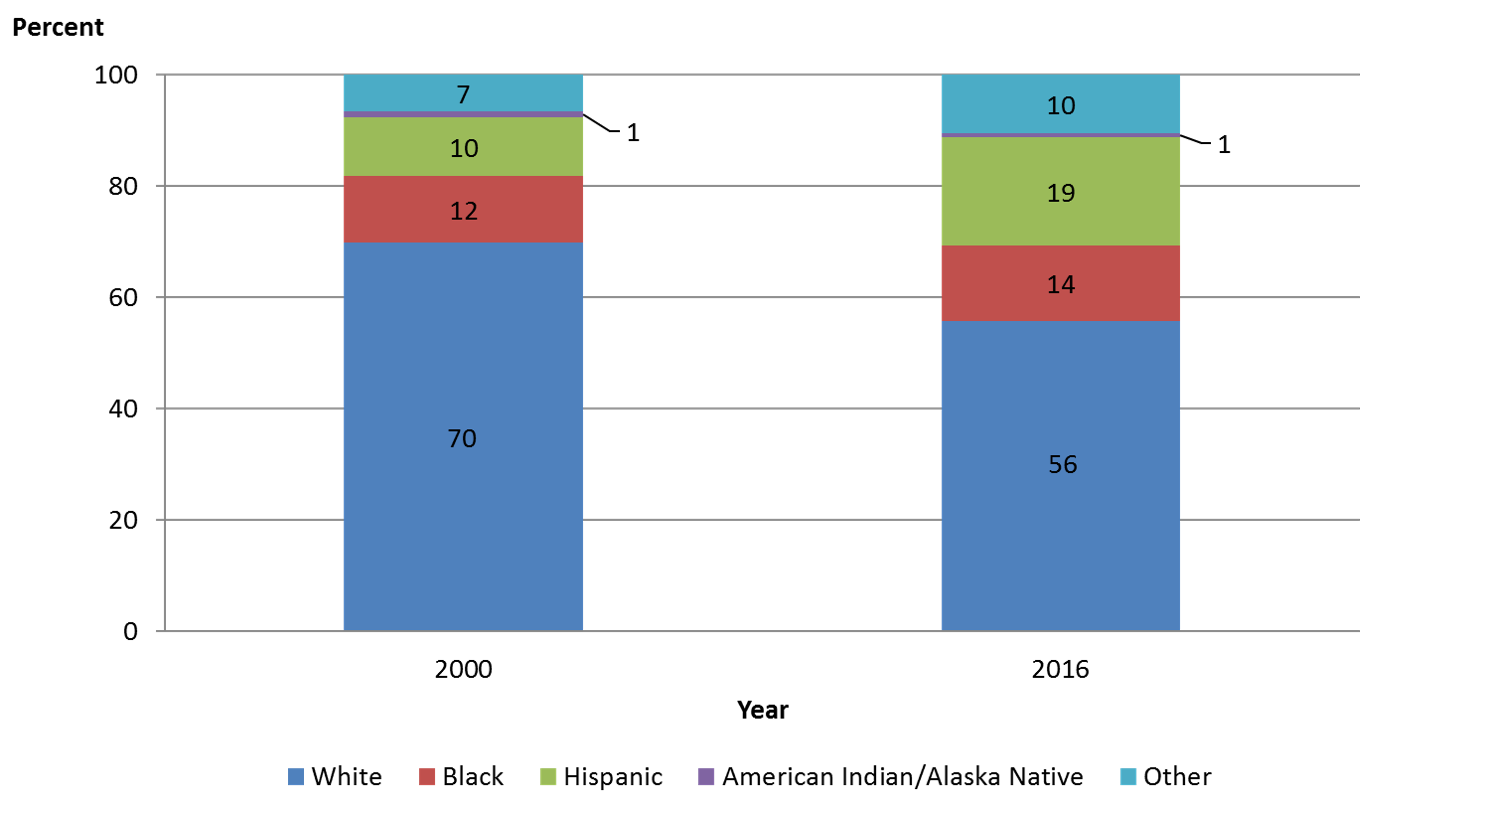
NOTE: Other includes Asian students, Pacific Islander students, and students of Two or more races.

SOURCE: U.S. Department of Education, National Center for Education Statistics, Integrated Postsecondary Education Data System (IPEDS), Spring 2001 and Spring 2017, Fall Enrollment component. See Digest of Education Statistics 2017, table 306.10.


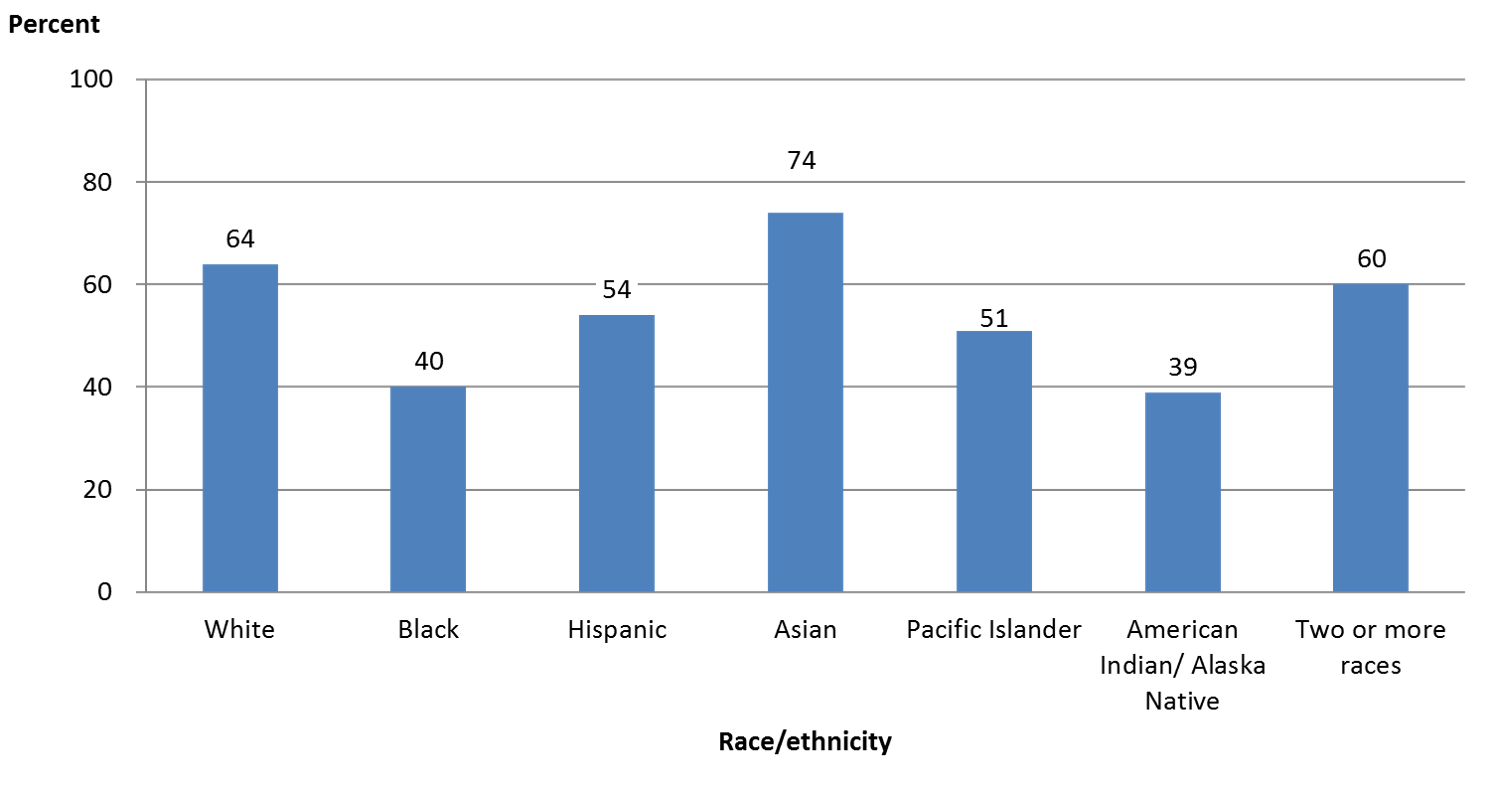
Postsecondary graduation rates vary widely by racial/ethnic group. For instance, among first-time students at 4-year institutions who enrolled in 2010, 74 percent of Asian students had graduated within 6 years. This was approximately 35 percentage points higher than the graduation rates for American Indian/Alaska Native students and Black students.   


Figure 5: Graduation rates within 6 years from first institution attended for first-time, full-time bachelor's degree-seeking students at 4-year postsecondary institutions, by race/ethnicity: Cohort entry year 2010
SOURCE: U.S. Department of Education, National Center for Education Statistics, Integrated Postsecondary Education Data System (IPEDS), Winter 2016–17, Graduation Rates component. See Digest of Education Statistics 2017, table 326.10.


The report also includes a new spotlight indicator, which highlights institutions that serve a large number of students from minority racial and ethnic groups. For instance, historically Black colleges and universities (HBCUs) are defined as “any historically Black college or university that was established prior to 1964, whose principal mission was, and is, the education of Black Americans.” In fall 2016, there were 102 HBCUs that enrolled over 292,000 students, 77 percent of whom were Black.


The spotlight also highlights other groups of minority-serving institutions—Hispanic-serving institutions, Tribally controlled colleges and universities, and Asian American and Native American Pacific Islander-serving institutions—describes how an institution is recognized as belonging to one of these groups, and discusses other institution characteristics, such as enrollment and degrees conferred.

For more information, visit the report’s website, where you can browse the indicators or download the full report


By Cris de Brey


[1] Mulligan, G.M., Hastedt, S., and McCarroll, J.C. (2012). First-Time Kindergartners in 2010–11: First Findings From the Kindergarten Rounds of the Early Childhood Longitudinal Study, Kindergarten Class of 2010–11 (ECLS-K:2011) (NCES 2012-049). U.S. Department of Education. Washington, DC: National Center for Education Statistics. Retrieved from https://nces.ed.gov/pubsearch/pubsinfo.asp?pubid=2012049.

[2] Ross, T., Kena, G., Rathbun, A., KewalRamani, A., Zhang, J., Kristapovich, P., and Manning, E. (2012). Higher Education: Gaps in Access and Persistence Study (NCES 2012-046). U.S. Department of Education. Washington, DC: National Center for Education Statistics. Retrieved from https://nces.ed.gov/pubsearch/pubsinfo.asp?pubid=2012046.

A Closer Look at the National Indian Education Study

While many NCES reports and products compare data between racial and ethnic groups, it is important to remember that outcomes can also differ substantially for individuals within these individual groups. The National Indian Education Study (NIES), part of the National Assessment of Education Progress (NAEP), is one way that NCES tries to look at the diverse experiences of a particular group of students.

One of the primary goals of NIES is to collect and report data for subgroups of American Indian and Alaska Native (AI/AN) students.  NCES released an initial report on the results of the 2015 NIES in early 2017 that focused on differences across three mutually exclusive school types:

  • Low density public schools (where less than 25 percent of all students in the school were AI/AN)
  • High density public schools (where 25 percent or more of all the students in the school were AI/AN)
  • Bureau of Indian Education schools

A recently released follow up report, National Indian Education Study 2015:  A Closer Look builds on the findings of the first report and focuses, in part, on NAEP 2015 assessment differences within the AI/AN student group. Although NIES provides a large enough sample size to facilitate comparisons among groups of AI/AN students, it is important to note that AI/AN students are diverse linguistically, culturally, geographically, economically, and in many other ways. By focusing specifically on this student group, NCES is able to highlight the educational experiences and related academic outcomes of these students.

National Indian Education Study 2015: A Closer Look reveals some significant differences when comparing AI/AN students performing at or above the 75th percentile (referred to in the report as “higher-performing”) with those performing below the 25th percentile (referred to as “lower-performing”). For example, higher-performing students in both mathematics and reading and in both grades 4 and 8 were more likely to have: 

  • A school library, media center, or resource center that contained materials about AI/AN people,
  • More than 25 books in their homes, and
  • A computer at home that they use.

A Technical Review Panel of American Indian and Alaska Native educators and researchers from across the country provides guidance on the study. Their expertise helps to ensure that this report will provide valuable, and much needed information to AI/AN educational stakeholders. In addition, whereas most other NCES reports are now electronic-only, hard copies of the NIES report are also produced in support of making them available for those AI/AN educational stakeholders who may not have easy access to the internet. This report is also unique in that the Technical Review Panel issued a statement highlighting the importance of this study and providing a brief overview of the overall context of AI/AN education, which may be helpful to readers as they read the report. This statement is available online at https://www2.ed.gov/about/offices/list/oese/resources.html


By Jamie Deaton