IES Blog

Institute of Education Sciences

U.S. Is Unique in Score Gap Widening in Mathematics and Science at Both Grades 4 and 8: Prepandemic Evidence from TIMSS

Tracking differences between the performance of high- and low-performing students is one way of monitoring equity in education. These differences are referred to as achievement gaps or “score gaps,” and they may widen or narrow over time.

To provide the most up-to-date international data on this topic, NCES recently released Changes Between 2011 and 2019 in Achievement Gaps Between High- and Low-Performing Students in Mathematics and Science: International Results From TIMSS. This interactive web-based Stats in Brief uses data from the Trends in International Mathematics and Science Study (TIMSS) to explore changes between 2011 and 2019 in the score gaps between students at the 90th percentile (high performing) and the 10th percentile (low performing). The study—which examines data from 47 countries at grade 4, 36 countries at grade 8, and 29 countries at both grades—provides an important picture of prepandemic trends.

This Stats in Brief also provides new analyses of the patterns in score gap changes over the last decade. The focus on patterns sheds light on which part of the achievement distribution may be driving change, which is important for developing appropriate policy responses. 


Did score gaps change in the United States and other countries between 2011 and 2019?

In the United States, score gap changes consistently widened between 2011 and 2019 (figure 1). In fact, the United States was the only country (of 29) where the score gap between high- and low-performing students widened in both mathematics and science at both grade 4 and grade 8.


Figure 1. Changes in scores gaps between high- and low-performing U.S. students between 2011 and 2019

Horizontal bar chart showing changes in scores gaps between high- and low-performing U.S. students between 2011 and 2019

* p < .05. Change in score gap is significant at the .05 level of statistical significance.

SOURCE: Stephens, M., Erberber, E., Tsokodayi, Y., and Fonseca, F. (2022). Changes Between 2011 and 2019 in Achievement Gaps Between High- and Low-Performing Students in Mathematics and Science: International Results From TIMSS (NCES 2022-041). U.S. Department of Education. Washington, DC: National Center for Education Statistics, Institute of Education Sciences. Available at https://nces.ed.gov/pubsearch/pubsinfo.asp?pubid=2022041.


For any given grade and subject combination, no more than a quarter of participating countries had a score gap that widened, and no more than a third had a score gap that narrowed—further highlighting the uniqueness of the U.S. results.


Did score gaps change because of high-performing students, low-performing students, or both?

At grade 4, score gaps widened in the United States between 2011 and 2019 due to decreases in low-performing students’ scores, while high-performing students’ scores did not measurably change (figure 2). This was true for both mathematics and science and for most of the countries where score gaps also widened.


Figure 2. Changes in scores of high- and low-performing U.S. students between 2011 and 2019

Horizontal bar chart showing changes in scores of high- and low-performing U.S. students between 2011 and 2019 and changes in the corresponding score gaps

p < .05. 2019 score gap is significantly different from 2011 score gap.

SOURCE: Stephens, M., Erberber, E., Tsokodayi, Y., and Fonseca, F. (2022). Changes Between 2011 and 2019 in Achievement Gaps Between High- and Low-Performing Students in Mathematics and Science: International Results From TIMSS (NCES 2022-041). U.S. Department of Education. Washington, DC: National Center for Education Statistics, Institute of Education Sciences. Available at https://nces.ed.gov/pubsearch/pubsinfo.asp?pubid=2022041.


Low-performing U.S. students’ scores also dropped in both subjects at grade 8, but at this grade, they were accompanied by rises in high-performing students’ scores. This pattern—where the two ends of the distribution move in opposite directions—led to the United States’ relatively large changes in score gaps. Among the other countries with widening score gaps at grade 8, this pattern of divergence was not common in mathematics but was more common in science.

In contrast, in countries where the score gaps narrowed, low-performing students’ scores generally increased. In some cases, the scores of both low- and high-performing students increased, but the scores of low-performing students increased more.

Countries with narrowing score gaps typically also saw their average scores rise between 2011 and 2019, demonstrating improvements in both equity and achievement. This was almost never the case in countries where the scores of low-performing students dropped, highlighting the global importance of not letting this group of students fall behind.  


What else can we learn from this TIMSS Stats in Brief?

In addition to providing summary results (described above), this interactive Stats in Brief allows users to select a subject and grade to explore each of the study questions further (exhibit 1). Within each selection, users can choose either a more streamlined or a more expanded view of the cross-country figures and walk through the findings step-by-step while key parts of the figures are highlighted.


Exhibit 1. Preview of the Stats in Brief’s Features

Image of the TIMSS Stats in Brief web report


Explore NCES’ new interactive TIMSS Stats in Brief to learn more about how score gaps between high- and low-performing students have changed over time across countries.

Be sure to follow NCES on TwitterFacebookLinkedIn, and YouTube and subscribe to the NCES News Flash to stay up-to-date on TIMSS data releases and resources.


By Maria Stephens and Ebru Erberber, AIR; and Lydia Malley, NCES

Rescaled Data Files for Analyses of Trends in Adult Skills

In January 2022, NCES released the rescaled data files for three adult literacy assessments conducted several decades earlier: the 1992 National Adult Literacy Survey (NALS), the 1994 International Adult Literacy Survey (IALS), and the 2003 Adult Literacy and Lifeskills Survey (ALL). By connecting the rescaled data from these assessments with data from the current adult literacy assessment, the Program for the International Assessment of Adult Competencies (PIAAC), researchers can examine trends on adult skills in the United States going back to 1992. This blog post traces the history of each of these adult literacy assessments, describes the files and explains what “rescaling” means, and discusses how these files can be used in analyses in conjunction with the PIAAC files. The last section of the post offers several example analyses of the data.

A Brief History of International and National Adult Literacy Assessments Conducted in the United States

The rescaled data files highlighted in this blog post update and combine historical data from national and international adult literacy studies that have been conducted in the United States.

NALS was conducted in 1992 by NCES and assessed U.S. adults in households, as well as adults in prisons. IALS—developed by Statistics Canada and ETS in collaboration with 22 participating countries, including the United States—assessed adults in households and was administered in three waves between 1994 and 1998. ALL was administered in 11 countries, including the United States, and assessed adults in two waves between 2003 and 2008.

PIAAC seeks to ensure continuity with these previous surveys, but it also expands on their quality assurance standards, extends the definitions of literacy and numeracy, and provides more information about adults with low levels of literacy by assessing reading component skills. It also, for the first time, includes a problem-solving domain to emphasize the skills used in digital (originally called “technology-rich”) environments.

How Do the Released Data Files From the Earlier Studies of Adult Skills Relate to PIACC?

All three of the released restricted-use data files (for NALS, IALS, and ALL) relate to PIAAC, the latest adult skills assessment, in different ways.

The NALS data file contains literacy estimates and background characteristics of U.S. adults in households and in prisons in 1992. It is comparable to the PIAAC data files for 2012/14 and 2017 through rescaling of the assessment scores and matching of the background variables to those of PIAAC.

The IALS and ALL data files contain literacy (IALS and ALL) and numeracy (ALL) estimates and background characteristics of U.S. adults in 1994 (IALS) and 2003 (ALL). Similar to NALS, they are comparable to the PIAAC restricted-use data (2012/14) through rescaling of the literacy and numeracy assessment scores and matching of the background variables to those of PIAAC. These estimates are also comparable to the international estimates of skills of adults in several other countries, including in Canada, Hungary, Italy, Norway, the Netherlands, and New Zealand (see the recently released Data Point International Comparisons of Adult Literacy and Numeracy Skills Over Time). While the NCES datasets contain only the U.S. respondents, IALS and ALL are international studies, and the data from other participating countries can be requested from Statistics Canada (see the IALS Data Files/Publications and ALL Data pages for more detail). See the History of International and National Adult Literacy Assessments page for additional background on these studies. 

Table 1 provides an overview of the rescaled NALS, IALS, and ALL data files.


Table 1. Overview of the rescaled data files for the National Adult Literacy Survey (NALS), International Adult Literacy Survey (IALS), and Adult Literacy and Lifeskills Survey (ALL) 
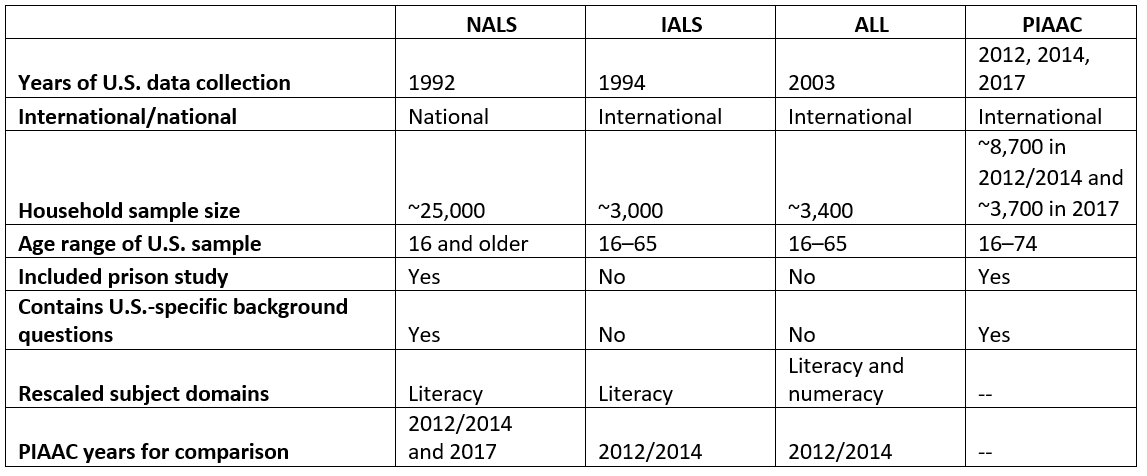
Table showing overview of the rescaled data files for the National Adult Literacy Survey (NALS), International Adult Literacy Survey (IALS), and Adult Literacy and Lifeskills Survey


What Does “Rescaled” Mean?

“Rescaling” the literacy (NALS, IALS, ALL) and numeracy (ALL) domains from these three previous studies means that the domains were put on the same scale as the PIAAC domains through the derivation of updated estimates of proficiency created using the same statistical models used to create the PIAAC skills proficiencies. Rescaling was possible because PIAAC administered a sufficient number of the same test questions used in NALS, IALS, and ALL.1 These rescaled proficiency estimates allow for trend analysis of adult skills across the time points provided by each study.

What Can These Different Files Be Used For?

While mixing the national and international trend lines isn’t recommended, both sets of files have their own distinct advantages and purposes for analysis.

National files

The rescaled NALS 1992 files can be used for national trend analyses with the PIAAC national trend points in 2012/2014 and 2017. Some potential analytic uses of the NALS trend files are to

  • Provide a picture of the skills of adults only in the United States;
  • Examine the skills of adults in prison and compare their skills with those of adults in households over time, given that NALS and PIAAC include prison studies conducted in 1992 and 2014, respectively;
  • Conduct analyses on subgroups of the population (such as those ages 16–24 or those with less than a high school education) because the larger sample size of NALS allows for more detailed breakdowns along with the U.S. PIAAC sample;
  • Focus on the subgroup of older adults (ages 66–74), given that NALS sampled adults over the age of 65, similar to PIAAC, which sampled adult ages 16–74; and
  • Analyze U.S.-specific background questions (such as those on race/ethnicity or health-related practices).

International files

The rescaled IALS 1994 and ALL 2003 files can be used for international trend analyses among six countries with the U.S. PIAAC international trend point in 2012/2014: Canada, Hungary, Italy, Norway, the Netherlands, and New Zealand. Some potential analytic uses of the IALS and ALL trend files are to

  • Compare literacy proficiency results internationally and over time using the results from IALS, ALL, and PIAAC; and
  • Compare numeracy proficiency results internationally and over time using the results from ALL and PIAAC.

Example Analyses Using the U.S. Trend Data on Adult Literacy

Below are examples of a national trend analysis and an international trend analysis conducted using the rescaled NALS, IALS, and ALL data in conjunction with the PIAAC data.

National trend estimates

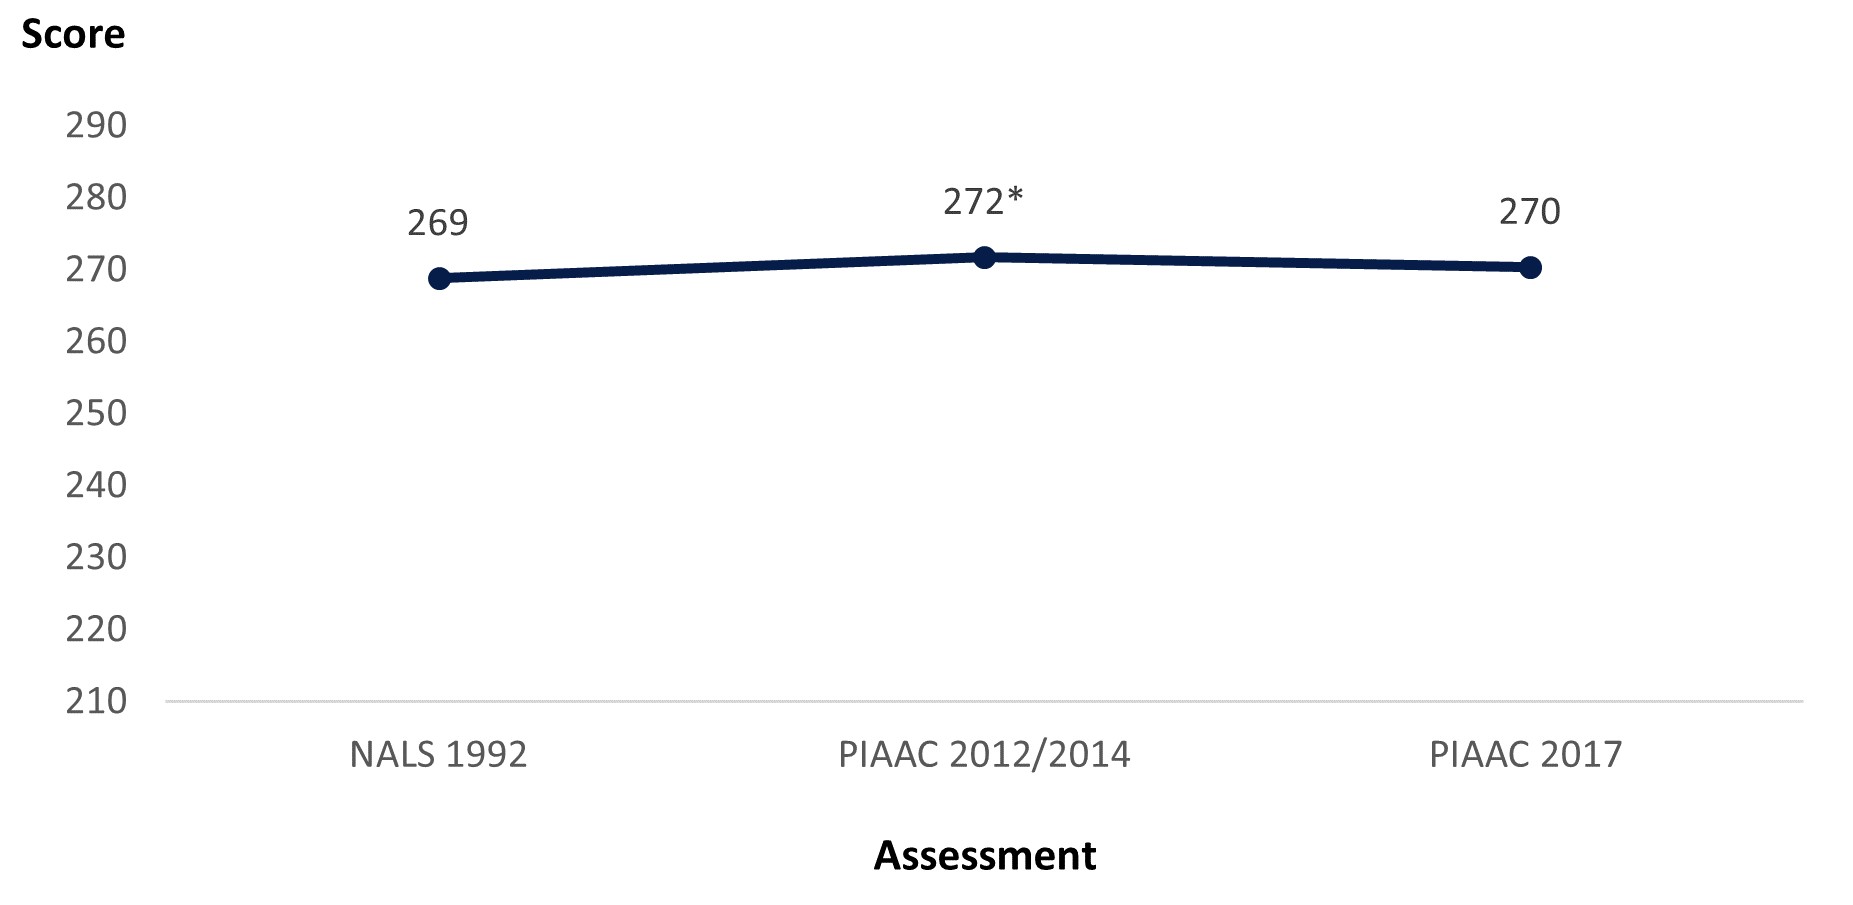
The literacy scores of U.S. adults increased from 269 in NALS 1992 to 272 in PIAAC 2012/2014. However, the PIAAC 2017 score of 270 was not significantly different from the 1992 or 2012/2014 scores.


Figure 1. Literacy scores of U.S. adults (ages 16–65) along national trend line: Selected years, 1992–2017
Line graph showing literacy scores of U.S. adults (ages 16–65) along national trend line for NALS 1992, PIAAC 2012/2014, and PIAAC 2017

* Significantly different (p < .05) from NALS 1992 estimate.
SOURCE: U.S. Department of Education, National Center for Education Statistics, National Adult Literacy Survey (NALS), NALS 1992; and Program for the International Assessment of Adult Competencies (PIAAC), PIAAC 2012–17.


International trend estimates

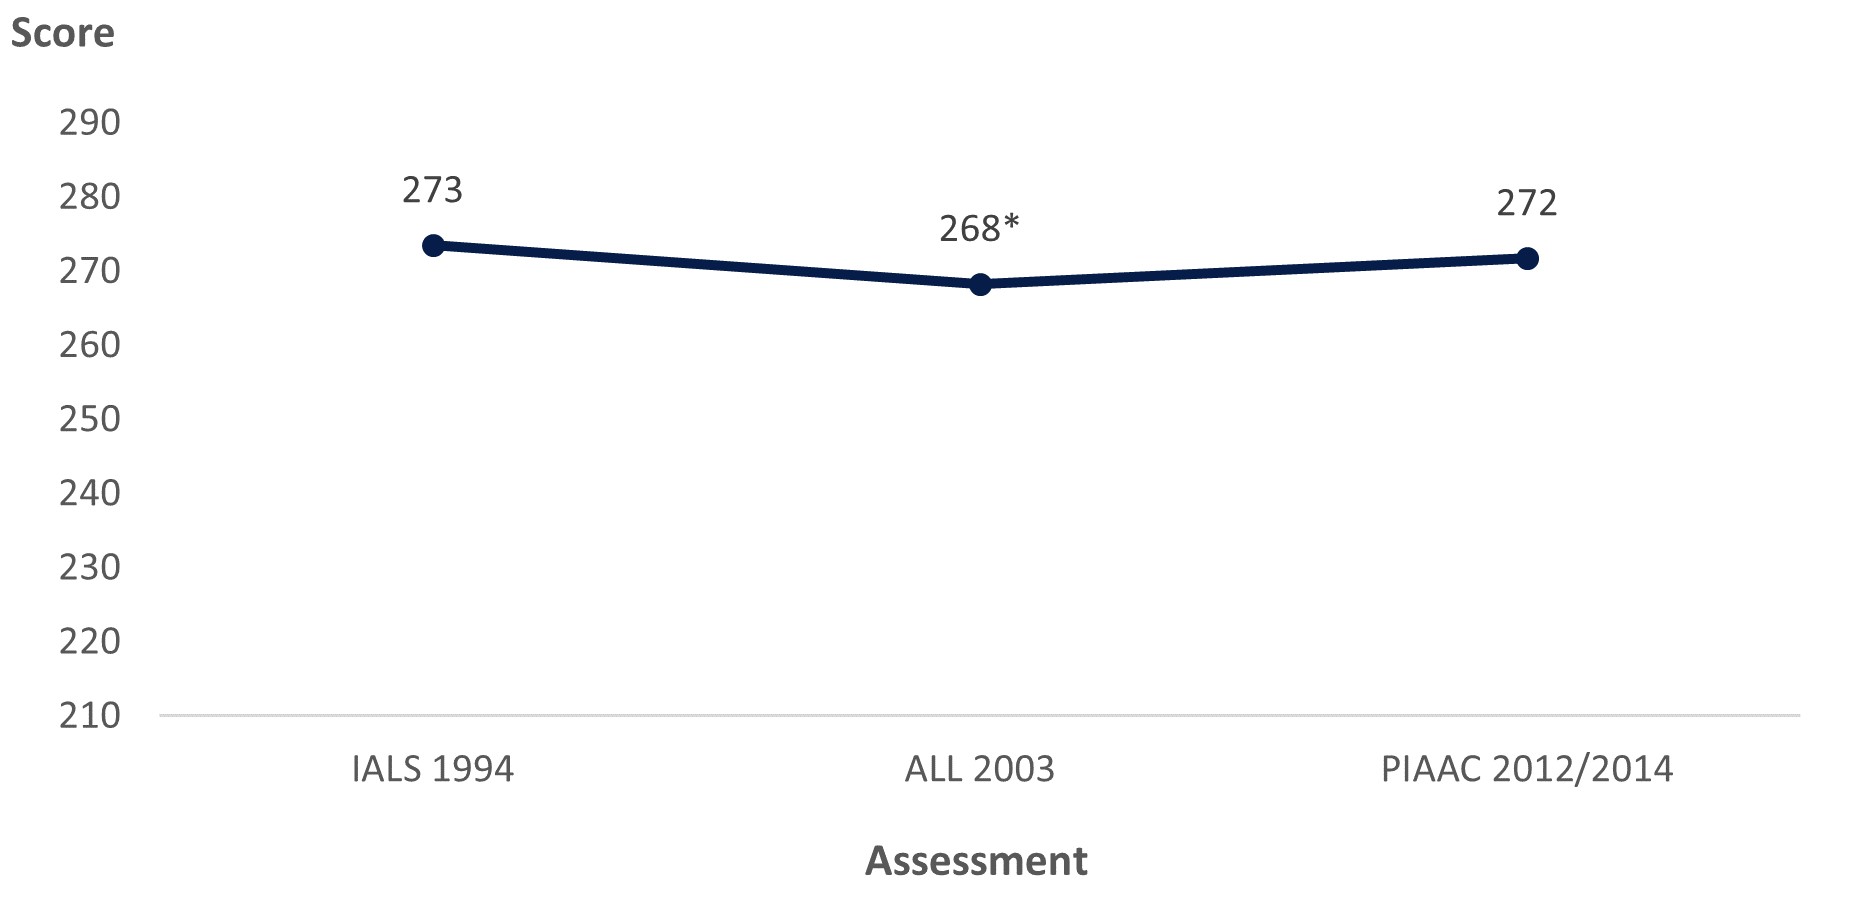
The literacy scores of U.S. adults decreased from 273 in IALS 1994 to 268 in ALL 2003 before increasing to 272 in PIAAC 2012/2014. However, the PIAAC 2012/2014 score was not significantly different from the IALS 1994 score.


Figure 2. Literacy scores of U.S. adults (ages 16–65) along international trend line: Selected years, 1994–2012/14
Line graph showing literacy scores of U.S. adults (ages 16–65) along international trend line for IALS 1994, ALL 2003, and PIAAC 2012/2014

* Significantly different (p < .05) from IALS 1994 estimate.
SOURCE: U.S. Department of Education, National Center for Education Statistics, Statistics Canada and Organization for Economic Cooperation and Development (OECD), International Adult Literacy Survey (IALS), 1994–98; Adult Literacy and Lifeskills Survey (ALL), 2003–08; and Program for the International Assessment of Adult Competencies (PIAAC), PIAAC 2012/14. See figure 1 in the International Comparisons of Adult Literacy and Numeracy Skills Over Time Data Point.


How to Access the Rescaled Data Files

More complex analyses can be conducted with the NALS, IALS, and ALL rescaled data files. These are restricted-use files and researchers must obtain a restricted-use license to access them. Further information about these files is available on the PIAAC Data Files page (see the “International Trend Data Files and Data Resources” and “National Trend Data Files and Data Resources” sections at the bottom of the page).

Additional resources:

By Emily Pawlowski, AIR, and Holly Xie, NCES


[1] In contrast, the 2003 National Assessment of Adult Literacy (NAAL), another assessment of adult literacy conducted in the United States, was not rescaled for trend analyses with PIAAC. For various reasons, including the lack of overlap between the NAAL and PIAAC literacy items, NAAL and PIAAC are thought to be the least comparable of the adult literacy assessments.

The Growing Reading Gap: IES Event to Link Knowledge to Action Through Literacy Data

On June 8 and 9, the Institute of Education Sciences (IES) and the Council of the Great City Schools (CGCS) will host a Reading Summit to address one of the most important issues confronting American education today: the declining reading performance of America’s lowest-performing students and the growing gap between low- and high-performing students.

At this 2-day virtual event, participants will explore the results of the National Assessment of Educational Progress (NAEP), as well as other IES data, and learn strategies to help educators and low-performing readers make progress.

Learn more about the summit’s agenda and speakers—including IES Director Mark Schneider, NCES Commissioner James L. Woodworth, and NCES Associate Commissioner Peggy Carr—and register to participate (registration is free).

In the meantime, explore some of the data NCES collects on K–12 literacy and reading achievement, which show that the scores of students in the lowest-performing groups are decreasing over time.

  • The National Assessment of Educational Progress (NAEP) administers reading assessments to 4th-, 8th-, and 12th-grade students. The most recent results from 2019 show that average reading scores for students in the 10th percentile (i.e., the lowest-performing students) decreased between 2017 and 2019 at grade 4 (from 171 to 168) and grade 8 (from 219 to 213) and decreased between 2019 and 2015 at grade 12 (from 233 to 228).
  • The Progress in International Reading Literacy Study (PIRLS) is an international comparative assessment that measures 4th-grade students’ reading knowledge and skills. The most recent findings from 2016 show that the overall U.S. average score (549) was higher than the PIRLS scale centerpoint (500), but at the 25th percentile, U.S. 4th-graders scored lower in 2016 (501) than in 2011 (510).
  • The Program for International Student Assessment (PISA) is a study of 15-year-old students’ performance in several subjects, including reading literacy. The 2018 results show that, although the overall U.S. average reading score (505) was higher than the OECD average score (487), at the 10th percentile, the U.S. average score in 2018 (361) was not measurably different from the score in 2015 and was lower than the score in 2012 (378).

NCES also collects data on young children’s literacy knowledge and activities as well as the literacy competencies of adults. Here are a few data collections and tools for you to explore:

This year, the Condition of Education includes a newly updated indicator on literacy activities that parents reported doing with young children at home. Here are some key findings from this indicator, which features data from the 2019 NHES Early Childhood Program Participation Survey:

In the week before the parents were surveyed,

  • 85 percent of 3- to 5-year-olds were read to by a family member three or more times.
  • 87 percent of 3- to 5-year-olds were told a story by a family member at least once.
  • 96 percent of 3- to 5-year-olds were taught letters, words, or numbers by a family member at least once.

In the month before the parents were surveyed,

  • 37 percent of 3- to 5-year-olds visited a library with a family member at least once.

Be sure to read the full indicator in the 2021 Condition of Education, which was released in May, for more data on young children’s literacy activities, including analyses by race/ethnicity, mother’s educational attainment, and family income.

Don’t forget to follow NCES on Twitter, Facebook, and LinkedIn to stay up-to-date on the latest findings and trends in literacy and reading data and register for the IES Reading Summit to learn more about this topic from experts in the field. 


By Megan Barnett, AIR

New International Data Show Large and Widening Gaps Between High- and Low-Performing U.S. 4th- and 8th-Graders in Mathematics and Science

NCES recently released results from the 2019 Trends in International Mathematics and Science Study (TIMSS). TIMSS tests students in grades 4 and 8 in mathematics and science every 4 years. The results show that

  • Across both subjects and grades, the United States scored, on average, in the top quarter of the education systems that took part in TIMSS 2019.
    • Among the 64 education systems that participated at grade 4, the United States ranked 15th and 8th in average mathematics and science scores, respectively.
    • Among the 46 education systems that participated at grade 8, the United States ranked 11th in average scores for both subjects.
  • On average, U.S. scores did not change significantly between the 2011 and 2019 rounds of TIMSS.

Average scores are one measure of achievement in national and international studies. However, they provide a very narrow perspective on student performance. One way to look more broadly is to examine differences in scores (or “score gaps”) between high-performing students and low-performing students. Score gaps between high performers and low performers can be one indication of equity within an education system. Here, high performers are those who scored in the 90th percentile (or top 10 percent) within their education system, and low performers are those who scored in the 10th percentile (or bottom 10 percent) within their education system.

In 2019, while some education systems had a higher average TIMSS score than the United States, none of these education systems had a wider score gap between their high and low performers than the United States. This was true across both subjects and grades.

Figure 1 shows an example of these findings using the grade 8 mathematics data. The figure shows that 17 education systems had average scores that were higher or not statistically different from the U.S. average score.

  • Of these 17 education systems, 13 had smaller score gaps between their high and low performers than the United States. The score gaps in 4 education systems (Singapore, Chinese Taipei, the Republic of Korea, and Israel) were not statistically different from the score gap in the United States.
  • The score gaps between the high and low performers in these 17 education systems ranged from 170 points in Quebec, Canada, to 259 points in Israel. The U.S. score gap was 256 points.
  • If you are interested in the range in the score gaps for all 46 education systems in the TIMSS 2019 grade 8 mathematics assessment, see Figure M2b of the TIMSS 2019 U.S. Highlights Web Report, released in December 2020. This report also includes these results for grade 8 science and both subjects at the grade 4 level.

Figure 1. Average scores and 90th to 10th percentile score gaps of grade 8 students on the TIMSS mathematics scale, by education system: 2019

NOTE: This figure presents only those education systems whose average scores were similar to or higher than the U.S. average score. Scores are reported on a scale of 0 to 1,000 with a TIMSS centerpoint of 500 and standard deviation of 100.

SOURCE: International Association for the Evaluation of Educational Achievement (IEA), Trends in International Mathematics and Science Study (TIMSS), 2019.


From 2011 to 2019, U.S. average scores did not change significantly. However, the scores of low performers decreased, and score gaps between low and high performers grew wider in both subjects and grades. In addition, at grade 8, there was an increase in the scores of high performers in mathematics and science over the same period. These two changes contributed to the widening gaps at grade 8.

Figure 2 shows these results for the U.S. grade 8 mathematics data. Average scores in 2011 and 2019 were not significantly different. However, the score of high performers increased from 607 to 642 points between 2011 and 2019, while the score of low performers decreased from 409 to 385 points. As a result, the score gap widened from 198 to 256 points between 2011 and 2019. In addition, the 2019 score gap for grade 8 mathematics is significantly wider than the gaps for all previous administrations of TIMSS.


Figure 2. Trends in average scores and selected percentile scores of U.S. grade 8 students on the TIMSS mathematics scale: Selected years, 1995 to 2019

* p < .05. Significantly different from the 2019 estimate at the .05 level of statistical significance.

NOTE: Scores are reported on a scale of 0 to 1,000 with a TIMSS centerpoint of 500 and standard deviation of 100.

SOURCE: International Association for the Evaluation of Educational Achievement (IEA), Trends in International Mathematics and Science Study (TIMSS), 1995, 1999, 2003, 2007, 2011, 2015, 2019.


These TIMSS findings provide insights regarding equity within the U.S. and other education systems. Similar results from the National Assessment of Educational Progress (NAEP) show that mathematics scores at both grades 4 and 8 decreased or did not change significantly between 2009 and 2019 for lower performing students, while scores increased for higher performing students. More national and international research on the gap between high- and low-performing students could help inform important education policy decisions that aim to address these growing performance gaps.

To learn more about TIMSS and the 2019 U.S. and international results, check out the TIMSS 2019 U.S. Highlights Web Report and the TIMSS 2019 International Results in Mathematics and Science. A recording is also available for a RISE Webinar from February 24, 2021 (What Do TIMSS and NAEP Tell Us About Gaps Between High- and Low-Performing 4th and 8th Graders?) that explores these topics further. 


By Katie Herz, AIR; Marissa Hall, AIR; and Lydia Malley, NCES

Due to COVID Pandemic, NCES to Delay National Assessment of Educational Progress (NAEP) Assessment

Due to the impact of the COVID pandemic on school operations, it will not be possible for NCES to conduct the National Assessment of Educational Progress (NAEP) assessments in accordance with the statutory requirements defined by the Education Sciences Reform Act (ESRA) which requires NAEP to be conducted in a valid and reliable manner every 2 years (20 U.S.C. 9622(b)(2)(B)).

NCES has been carefully monitoring physical attendance patterns in schools across the county. I have determined that NCES cannot at this time conduct a national-level assessment (20 U.S.C. 9622(b)(2)(A)) in a manner with sufficient validity and reliability to meet the mandate of the law. Too many students are receiving their education through distance learning or are physically attending schools in locations where outside visitors to the schools are being kept at a minimum due to COVID levels. The NAEP assessments are a key indicator of educational progress in the United States with trends going back decades. The change in operations and lack of access to students to be assessed means that NAEP will not be able to produce estimates of what students know and can do that would be comparable to either past or future national or state estimates.


As Commissioner for Education Statistics, I feel it would be in the best interests of the country and keeping with the intent of ESRA (20 U.S.C. 9622(b)(2)(B)) to postpone the next NAEP collection to 2022. By postponing the collection, we are allowing time for conditions on the ground to stabilize before attempting a large-scale national assessment. Further, if we attempted to move forward with a collection in 2021 and failed to produce estimates of student performance, we would not only have spent tens of millions of dollars, but also will not by law be able to conduct the next grades four and eight reading and mathematics assessments until 2023. By postponing to 2022, we will be more likely to get reliable national and state NAEP results closer to the statutorily prescribed timeline than if we attempt and fail to collect the data in 2021.

Additionally, delaying the next NAEP assessment to early 2022 will reduce the burden this year on schools, allowing time for the states to conduct their own state assessments this spring. To create comparable results, NAEP is conducted during the same time window across the country each time it is given. This was impractical as COVID infection rates differ greatly from state to state during any one time. NAEP also uses shared equipment and outside proctors who go into the schools to ensure a consistent assessment experience across the nation. I was obviously concerned about sending outsiders into schools and possibly increasing the risk of COVID transmission.

State assessments, however, generally use existing school staff and equipment; thus, eliminating this additional risk associated with NAEP. Therefore, while having nationally comparable NAEP data to estimate the impact of the COVID pandemic on educational progress would be ideal but impossible, there is still an opportunity to get solid state-by-state data on the impact of COVID on student outcomes. This state-level data can serve as a bridge until Spring 2022 when NCES will likely be able to conduct the national NAEP assessment in a manner that has sufficient validity and reliability. 


By James L. Woodworth, NCES Commissioner