IES Blog

Institute of Education Sciences

NCES Releases First-Ever Response Process Dataset—A Rich New Resource for Researchers

The NCES data file National Assessment of Educational Progress (NAEP) Response Process Data From the 2017 Grade 8 Mathematics Assessment (NCES 2020-102; documentation NCES 2020-134) introduces a new type of data—response process data—which was made possible by NAEP’s transition from paper to digitally based assessments in mathematics and reading in 2017. These new datasets allow researchers to go beyond analyzing students’ answers to questions as simply right or wrong; instead, researchers can examine the amount of time students spend on questions, the pathways they take through the assessment sections, and the tools they use while solving problems. 

NAEP reporting has hinted previously at the promise of response process data. With the release of the 2017 mathematics assessment results, NCES included a feature on The Nation’s Report Card website to show the different steps students took while responding to a question that assessed their multiplication skills. The short video below shows that students used a total of 397 different sequences to group four digits into two factors that yield a given product. The most popular correct and incorrect answer paths are shown in the video. Response process data, such as those summarized in this example item, can open new avenues for understanding how students work through math problems and identifying more detailed elements of response processes that could lead to common math errors.


In the newly released data, researchers can access student response process data from two 30-minute blocks of grade 8 mathematics assessment questions (or a total of 29 test items) and a 15-minute survey questionnaire where students responded to questions about their demographic characteristics, opportunities to learn in and outside of school, and educational experiences. Researchers can explore logs of the response process data collected from each student along with a file containing students’ raw responses and scored responses, time stamps, and demographics. In addition, researchers can explore a file that summarizes defined features of students’ interactions with the assessment, such as the number of seconds spent on specific questions or the number of times the calculator was opened across all students.

To explore this response process dataset, interested researchers should apply for a restricted-use license and request access to the files through the NCES website. By providing this dataset to a wide variety of researchers, NCES hopes to encourage and enable a new domain of research on developing best practices for the use and interpretation of student response process data.


By Jan Marie Alegre and Robert Finnegan, Educational Testing Service

What National and International Assessments Can Tell Us About Technology in Students’ Learning: Technology Instruction, Use, and Resources in U.S. Schools

As schools and school districts plan instruction amid the current coronavirus pandemic, the use of technology and digital resources for student instruction is a key consideration.

In this post, the final in a three-part series, we present results from the NAEP TEL and ICILS educator questionnaires (see the first post for information about the results of the two assessments and the second post for the results of the student questionnaires). The questionnaires ask about the focus of technology instruction in schools, school resources to support technology instruction, and the use of technology in teaching practices.

It is important to note that NAEP TEL surveys the principals of U.S. eighth-grade students, while ICILS surveys a nationally representative sample of U.S. eighth-grade teachers.

Emphasis in technology instruction

According to the 2018 NAEP TEL principal questionnaire results, principals1 of 61 percent of U.S. eighth-grade students reported that prior to or in eighth grade, much of the emphasis in information and communication technologies (ICT) instruction was placed on teaching students how to collaborate with others. In addition, principals of 51 percent of eighth-grade students reported that a lot of emphasis was placed on teaching students how to find information or data to solve a problem. In comparison, principals of only 10 percent of eighth-grade students reported that a lot of emphasis was placed on teaching students how to run simulations (figure 1).


According to the 2018 ICILS teacher questionnaire results, 40 percent of U.S. eighth-grade teachers reported a strong emphasis on the use of ICT instruction to develop students’ capacities to use computer software to construct digital work products (e.g., presentations). In addition, 35 percent of eighth-grade teachers reported a strong emphasis on building students’ capacities to access online information efficiently. In comparison, 17 percent reported a strong emphasis on developing students’ capacities to provide digital feedback on the work of others (figure 2).  


Resources at school

NAEP TEL and ICILS used different approaches to collect information about technology-related school resources. NAEP TEL asked about hindrances that limited schools’ capabilities to provide instruction in technology or engineering concepts. According to NAEP TEL, principals of 5 percent of U.S. eighth-grade students indicated that a lack or inadequacy of internet connectivity was a “moderate” or “large” hindrance in their schools. However, principals of 61 percent of eighth-grade students indicated that a lack of time due to curriculum content demands was a “moderate” or “large” hindrance. Principals of 44 percent of eighth-grade students indicated that a lack of qualified teachers was a “moderate” or “large” hindrance (figure 3).


ICILS asked about the adequacy of school resources to support ICT use in teaching. Eighty-six percent of U.S. teachers “agreed” or “strongly agreed” that technology was considered a priority for use in teaching. Nearly three-quarters of teachers “agreed” or “strongly agreed” that their schools had access to sufficient digital learning resources and had good internet connectivity (74 and 73 percent, respectively) (figure 4).


Use of technology in teaching

Teachers of U.S. eighth-grade students reported that they often used technology in their teaching practices. ICILS found that 64 percent of U.S. teachers regularly (i.e., “often” or “always”) used technology to present class instruction. Fifty-four percent of teachers regularly used technology to communicate with parents or guardians about students’ learning. In addition, 45 percent of teachers regularly used technology to provide remedial or enrichment support to individual or small groups of students, and a similar percentage (44 percent) regularly used technology to reinforce skills through repetition of examples (figure 5).


ICILS also reported results from U.S. eighth-grade teachers about how they collaborated on technology use. About three-quarters “agreed” or “strongly agreed” that they talked to other teachers about how to use technology in their teaching. Similarly, about three-quarters “agreed” or “strongly agreed” that they shared technology resources with other teachers in the school. More than half of the teachers “agreed” or “strongly agreed” that they collaborated with colleagues on the development of technology-based lessons.

Overall, the responses of teachers and principals suggested that emphasis had been put on different aspects of instruction for eighth-grade students. The majority of schools had enough digital resources and adequate internet access. However, technologies were also used differently in different teaching practices.

It should be noted that the data presented here were collected in 2018; any changes since then due to the coronavirus pandemic are not reflected in the results reported here. The NAEP TEL and ICILS samples both include public and private schools. The 2018 ICILS also included a principal questionnaire, but the questions are not directly related to the topics included in this blog. Data reported in the text and figures are rounded to the nearest integer.


Resources for more information:


By Yan Wang, AIR, and Taslima Rahman, NCES


[1] The unit of analysis for TEL principal responses is student.

What National and International Assessments Can Tell Us About Technology in Students’ Learning: Eighth-Graders’ Experience with Technology

The use of technology has become an integral part of life at work, at school, and at home throughout the 21st century and, in particular, during the coronavirus pandemic.

In this post, the second in a three-part series, we present results from the NAEP TEL and ICILS student questionnaires about students’ experience and confidence using technology (see the first post for more information about these assessments and their results). These results can help to inform education systems that are implementing remote learning activities this school year.

Uses of information and communication technologies (ICT) for school

Both NAEP TEL and ICILS collected data in 2018 on U.S. eighth-grade students’ uses of ICT in school or for school-related purposes.

According to the NAEP TEL questionnaire results, about one-third of U.S. eighth-grade students reported that they used ICT regularly (i.e., at least once a week) to create, edit, or organize digital media (figure 1). About a quarter used ICT regularly to create presentations, and 18 percent used ICT regularly to create spreadsheets.


According to the ICILS questionnaire results, 72 percent of U.S. eighth-grade students reported that they regularly used the Internet to do research, and 56 percent regularly used ICT to complete worksheets or exercises (figure 2). Forty percent of eighth-grade students regularly used ICT to organize their time and work. One-third regularly used software or applications to learn skills or a subject, and 30 percent regularly used ICT to work online with other students.


Confidence in using ICT

Both the 2018 NAEP TEL and ICILS questionnaires asked U.S. eighth-grade students about their confidence in their ICT skills. NAEP TEL found that about three-quarters of eighth-grade students reported that they were confident that they could—that is, they reported that they “probably can” or “definitely can”—compare products using the Internet or create presentations with sound, pictures, or video (figure 3). Seventy percent were confident that they could organize information into a chart, graph, or spreadsheet.


ICILS found that 86 percent of U.S. eighth-grade students reported that they knew how to search for and find relevant information for a school project on the Internet (figure 4). Eighty-three percent knew how to both upload text, images, or video to an online profile and install a program or app. About three-quarters of eighth-grade students knew how to change the settings on their devices, and 65 percent knew how to edit digital photographs or other graphic images.


Years of experience using computers

In the 2018 ICILS questionnaire, U.S. eighth-grade students were also asked how many years they had been using desktop or laptop computers. One-third of eighth-grade students reported using computers for 7 years or more—that is, they had been using computers since first grade (figure 5). This finding was similar to results from the Computer Access and Familiarity Study (CAFS), which was conducted as part of the 2015 NAEP. The CAFS found that in 2015, about 35 percent of eighth-grade public school students reported first using a laptop or desktop computer in kindergarten or before kindergarten.

Nineteen percent of eighth-grade students reported that they had used computers for at least 5 but less than 7 years. However, 9 percent of eighth-grade students had never used computers or had used them for less than one year, meaning they had only started using computers when they reached eighth grade.


Overall, responses of eighth-grade students showed that some had more years of experience using computers than others. Although there were differences in students’ use of ICT for school-related purposes, most students felt confident using ICT.

It should be noted that the data presented here were collected in 2018; any changes since then due to the coronavirus pandemic or other factors are not reflected in the results reported here. The NAEP TEL and ICILS samples both include public and private schools. Data reported in the text and figures are rounded to the nearest integer.


Resources for more information:


By Yan Wang, AIR, and Taslima Rahman, NCES

NAEP Opens a Pathway to Exploring Student Problem Solving in Assessments

A newly released NCES First Look report, Response Process Data From the NAEP 2017 Grade 8 Mathematics Assessment (NCES 2020-068), introduces a new type of data—response process data—which was made available after the NAEP reading and math assessments transitioned from paper to digitally based assessments in 2017. These new datasets will allow researchers to go beyond analyzing students’ answers to questions as simply right or wrong; instead, researchers will be able to examine the amount of time students spend on questions, the pathways they take through the assessment sections, and the tools they use while solving problems. The new First Look report provides an overview of data that will be available when the restricted-use data files for the 2017 grade 8 mathematics response process data are released later this summer.

NAEP reporting has hinted previously at the promise of response process data. With the release of the 2017 mathematics assessment results, NCES included a feature on The Nation’s Report Card website to show the different steps students took while responding to a question that assessed their multiplication skills. The short video below shows that students used a total of 397 different sequences to group four digits into two factors that yield a given product. The most popular correct and incorrect answer paths are shown in the video. Response process data, such as those summarized in this example item, can open new avenues for understanding how students work through math problems and identifying more detailed elements of response processes that could lead to common math errors.


The First Look report describes the forthcoming data files that will enable researchers to access student response process data from two 30-minute blocks of grade 8 mathematics assessment questions (or a total of 29 test items) and a 15-minute survey questionnaire where students responded to questions about their demographic characteristics, opportunities to learn in and outside of school, and educational experiences. Researchers will be able to explore logs of the response process data collected from each student along with a file containing students’ raw responses and scored responses, time stamps, and demographics. In addition, researchers can explore a file that summarizes defined features of students’ interactions with the assessment, such as the number of seconds spent on specific questions or the number of times the calculator was opened across all students.

To explore this response process dataset, interested researchers should apply for a restricted-use license and request access to the files through the NCES website. By providing this dataset to a wide variety of researchers, NCES hopes to encourage and enable a new domain of research on developing best practices for the use and interpretation of student response process data.


By Jan Marie Alegre and Robert Finnegan, Educational Testing Service

SELweb: From Research to Practice at Scale in Education

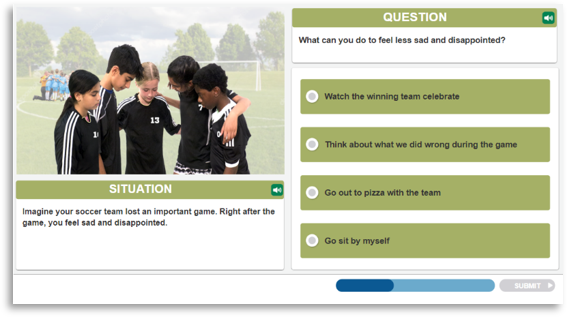
With a 2011 IES development grant, researchers at Rush University Medical Center, led by Clark McKown, created SELweb, a web-based system to assess the social-emotional skills in children in Kindergarten to Grade 3. The system (watch the video demo) includes illustrated and narrated modules that gauge children’s social acceptance with peers and assess their ability to understand others’ emotions and perspectives, solve social problems, and self-regulate. The system generates teacher reports with norm-referenced scores and classroom social network maps. Field trials with 8,881 children in seven states demonstrate that system produces reliable and valid measures of social-emotional skills. Findings from all publications on SELweb are posted here.

In 2016, with support from the university, McKown launched a company called xSEL Labs, to further develop and ready SELweb for use at scale and to facilitate the launch SELweb into the school marketplace. SELweb is currently used in 21 school districts in 16 states by over 90,000 students per year.

Interview with Clark McKown of Rush University Medical Center and xSEL Labs


From the start of the project, was it always a goal for SELweb to one day be ready to be used widely in schools?

CM: When we started our aspiration was to build a usable, feasible, scientifically sound assessment and it could be done. When the end of the grant got closer, we knew that unless we figured out another way to support the work, this would be yet another good idea that would wither on the vine after showing evidence of promise. In the last year and a half of the grant, I started thinking about how to get this into the hands of educators to support teaching and learning, and how to do it in a large-scale way.


By the conclusion of your IES grant to develop SELweb, how close were you to the version that is being used now in schools? How much more time and money was it going to take?

CM: Let me answer that in two ways. First is how close I thought we were to a scalable version. I thought we were pretty close. Then let me answer how close we really were. Not very close. We had built SELweb in a Flash based application that was perfectly suited to small-scale data collection and was economical to build. But for a number of reasons, there was no way that it would work at scale. So we needed capital, time, and a new platform. We found an outstanding technology partner, the 3C Institute, who have a terrific ed tech platform well-suited to our needs, robust, and scalable. And we received funding from the Wallace Foundation to migrate the assessment from the original platform to 3C’s. The other thing I have learned is that technology is not one and done. It requires continued investment, upkeep, and improvement.

What experiences led you to start a company? How were you able to do this as an academic researcher?

CM: I could tell you that I ran a children’s center, had a lot of program development experience, had raised funds, and all that would be true, and some of the skills I developed in those roles have transferred. But starting a company is really different than anything I’d done before. It’s exciting and terrifying. It requires constant effort, a willingness to change course, rapid decision-making, collaboration, and a different kind of creativity than the academy. Turns out I really like it. I probably wouldn’t have made the leap except that the research led me to something that I felt required the marketplace to develop further and to realize its potential. There was really only so far I could take SELweb in the academic context. And universities recognize the limitations of doing business through the university—that’s why they have offices of technology transfer—to spin off good ideas from the academy to the market. And it’s a feather in their cap when they help a faculty member commercialize an invention. So really, it was about finding out how to use the resources at my disposal to migrate to an ecosystem suited to continuing to improve SELweb and to get it into the hands of educators.

How did xSEL Labs pay for the full development of the version of SELweb ready for use at scale?

CM: Just as we were getting off the ground, we developed

 a partnership with a research funder (the Wallace Foundation) who was interested in using SELweb as an outcome measure in a large-scale field trial of an SEL initiative. They really liked SELweb, but it was clear that in its original form, it simply wouldn’t work at the scale they required. So we worked out a contract that included financial support for improving the system in exchange for discounted fees in the out years of the project.

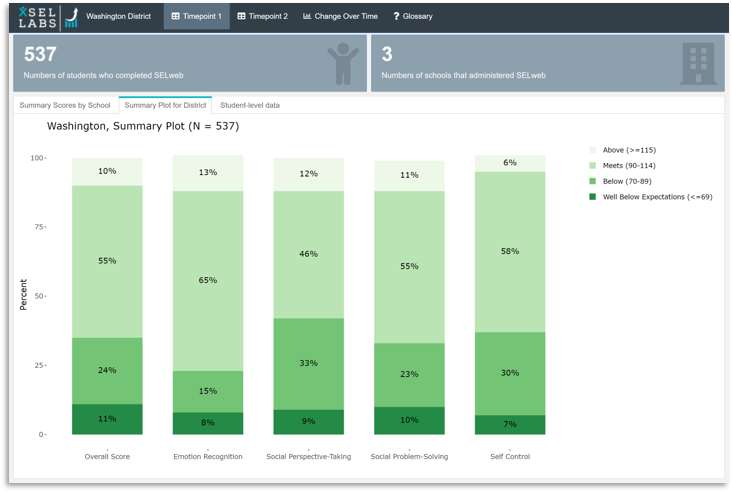
What agreement did you make with the university in order to start your company and commercial SELweb?

CM: I negotiated a license for the intellectual property from Rush University with the university getting a royalty and a small equity stake in the company.

Did anyone provide you guidance on the business side?

CM: Yes. I lucked into a group of in-laws who happen to be entrepreneurs, some in the education space. And my wife has a sharp business mind. They were helpful. I also sought and found advisors with relevant expertise to help me think through the initial licensing terms, and then pricing, marketing, sales, product development, and the like. One of the nice things about business is that you aren’t expected to know everything. You do need to know how and when to reach out to others for guidance, and how to frame the issues so that guidance is relevant and helpful.

How do you describe the experience of commercializing SELWeb?

CM: Commercialization is, in my experience, an exercise in experimentation and successive approximations. How will you find time and money to test the waters? Commercialization is an exciting and challenging leap from the lab to the marketplace. In my experience, you can’t do it alone, and even with great partners, competitive forces and chance factors make success scale hard to accomplish. Knowing what you don’t know, and finding partners who can help, is critical.

I forgot who described a startup as a temporary organization designed to test whether a business idea is replicable and sustainable. That really rings true. The experience has been about leaving the safe confines of the university and entering the dynamic and endlessly interesting bazaar beyond the ivory tower to see if what I have to offer can solve a problem of practice.

In one sentence (or two!), what would say is most needed for gaining traction in the marketplace?

CM: Figure out who the customer is, what the customer needs, and how what you have to offer addresses those needs. Until you get that down, all the evidence in the world won’t lead to scale.

Do you have advice for university researchers seeking to move their laboratory research into wide-spread practice?

CM: It’s not really practical for most university researchers to shift gears and become an entrepreneur. So I don’t advise doing what I did, although I’m so glad I did. For most university researchers, they should continue doing great science, and when they recognize a scalable idea, consider commercialization as an important option for bringing the idea to scale. My impression is that academic culture often finds commerce to be alien and somewhat grubby, which can get in the way. The truth is, there are whip-smart people in business who have tremendous expertise. The biggest hurdle for many university researchers will be to recognize that they lack expertise in bringing ideas to market, they will need to find that expertise, respect it, and let go of some control as the idea, program, or product is shaped by market forces. It’s also a hard truth for researchers, but most of the world doesn’t care very much about evidence of efficacy. They have much more pressing problems of practice to attend to. Don’t get me wrong—evidence of efficacy is crucial. But for an efficacious idea to go to scale, usability and feasibility are the biggest considerations.

For academics, getting the product into the marketplace requires a new set of considerations, such as: Universities and granting mechanisms reward solo stars; the marketplace rewards partnerships. That is a big shift in mindset, and not easily accomplished. Think partnerships, not empires; listening more than talking.

Any final words of wisdom in moving your intervention from research to practice?

CM: Proving the concept of an ed tech product gets you to the starting line, not the finish. Going to scale benefits from, probably actually requires, the power of the marketplace. Figuring out how the marketplace works and how to fit your product into it is a big leap for most professors and inventors. Knowing the product is not the same as knowing how to commercialize it.

 ____________________________________________________________________________

Clark McKown is a national expert on social and emotional learning (SEL) assessments. In his role as a university faculty member, Clark has been the lead scientist on several large grants supporting the development and validation of SELweb, Networker, and other assessment systems. Clark is passionate about creating usable, feasible, and scientifically sound tools that help educators and their students.

This interview was produced by Ed Metz of the Institute of Education Sciences. This post is the third in an ongoing series of blog posts examining moving from university research to practice at scale in education.