Every year, NCES releases nonfiscal data files from the Common Core of Data (CCD), the Department of Education’s (ED’s) primary longitudinal database on public elementary and secondary education in the United States. CCD data releases include directory data (location, status, and grades offered), student membership data (by grade, gender, and race/ethnicity), data on full-time equivalent staff and teachers, and data on the number of students eligible for the National School Lunch Program (NSLP).
This blog post, one in a series of posts about CCD data, focuses on how to access and use the data. For information on using NSLP data, read the blog post Understanding School Lunch Eligibility in the Common Core of Data.
CCD Data Use
CCD data are used both internally by ED and externally by the public. For example, within ED, CCD data serve as the sample frame for the National Assessment of Educational Progress (NAEP) and are the mainstay of many tables in the Digest of Education Statistics and The Condition of Education. Outside of ED, CCD data are used by researchers, the general public (e.g., realtor sites, The Common Application, Great Schools), and teachers who need their school’s NCES school ID to apply for grants.
Data Structure and Availability
CCD data are available at the state, district, and school levels, using a nested structure: all schools are within a parent district and all districts are within a state. CCD does not include any student- or staff-level data.
Most CCD data elements are available for school year (SY) 1986‒87 to the present.
Unique Identifiers Within CCD
NCES uses a three-part ID system for public schools and districts: state-based Federal Information Processing Standards (FIPS) codes, district codes, and school codes. Using these three parts, several IDs can be generated:
- District IDs: 7-digit (FIPS + 5-digit District)
- School IDs:
- 12-digit (FIPS + District + School)
- 7-digit (FIPS + School) (unique from SY 2016‒17 on)

NCES IDs are assigned to districts and schools indefinitely, making them useful for analyzing data over time. For example, for a longitudinal school-level analysis, a school’s 7-digit ID should be used, as it remains the same even if the school changes districts. These IDs can also be used to link CCD district and school data to other ED databases.
Accessing CCD Data
There are three ways to access CCD data: the CCD District and School Locators, the Elementary/Secondary Information System (ElSi), and the raw data files. Each approach has different benefits and limitations.
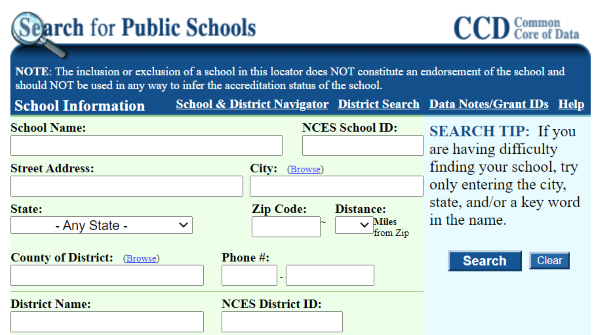
- CCD District and School locators
- Quick and easy to use
- Many ways to search for districts and schools (e.g., district/school name, street address, county, state)
- Provides the latest year of CCD data available for the selected district(s) or school(s)
- Tips for optimal use:
- If you are having difficulty finding a district or school, only enter a key word for the name (e.g., for PS 100 Glen Morris in New York City, only enter “Glen Morris” or “PS 100”)
- Export search results to Excel (including all CCD locator fields)
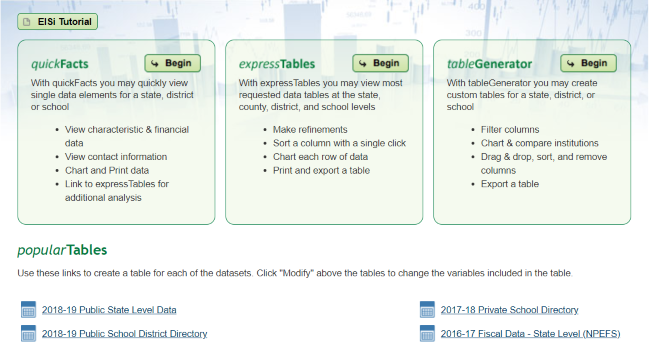
- Elementary/Secondary Information System (ElSi)
- quickFacts and expressTables: view most-requested CCD data elements at multiple levels
- tableGenerator: combine data across topic areas and years to create a single file
- Create “tables” that act like databases and include all of the roughly 100,000 public schools or 20,000 districts
- Export data to Excel or CSV
- Tips for optimal use:
- Save and edit queries using the navigation buttons at the top of the screen
- popularTables provide links to frequently requested data
Interested in learning more about CCD or accessing CCD data at the state, district, or school level? Check out the CCD website and use the District and School locators, ElSi, or the raw data files to find the data you are looking for.
By Patrick Keaton, NCES