IES Blog

Institute of Education Sciences

New Data Reveal Public School Enrollment Decreased 3 Percent in 2020–21 School Year

NCES recently released revised Common Core of Data (CCD) Preliminary Files, which are the product of the school year (SY) 2020–21 CCD data collection. CCD, the Department of Education’s primary database on public elementary and secondary education in the United States, provides comprehensive annual data on enrollment, school finances, and student graduation rates.

Here are a few key takeaways from the newly released data files:

Public school enrollment in SY 2020–21 was lower than it was in SY 2019–20.

Overall, the number of students enrolled in public schools decreased by 3 percent from SY 2019–20 to SY 2020–21. Note that Illinois did not submit data in time to be included in this preliminary report. The SY 2019–20 and SY 2020–21 total enrollment counts for California, Oregon, American Samoa, and the Bureau of Indian Education do not include prekindergarten counts.

The rate of decline in public school enrollment in SY 2020–21 was not consistent across all states.

Within states, the largest decreases were in Mississippi and Vermont (5 percent each), followed by Washington, New Mexico, Kentucky, New Hampshire, and Maine (each between 4 and 5 percent) (figure 1). Eighteen states had decreases of 3 percent or more; 29 states had decreases between 1 and 3 percent; and the District of Columbia, South Dakota, and Utah had changes of less than 1 percent.


Lower grade levels experienced a greater rate of decline in public school enrollment than did higher grade levels in SY 2020–21.

Public school enrollment decreased by 13 percent for prekindergarten and kindergarten and by 3 percent for grades 1–8. Public school enrollment increased by 0.4 percent for grades 9–12.

Most other jurisdictions experienced declines in public school enrollment in SY 2020–21.

Public school enrollment decreased in Puerto Rico (6 percent), Guam (5 percent), and American Samoa (2 percent). The Virgin Islands, however, experienced an increase of less than 1 percent.

To access the CCD preliminary data files and learn more about public school enrollment in SY 2020–21, visit the CCD data files webpage.

Announcing the Condition of Education 2021 Release

NCES is pleased to present the 2021 edition of the Condition of Education, an annual report mandated by the U.S. Congress that summarizes the latest data on education in the United States. This report uses data from across the center and from other sources and is designed to help policymakers and the public monitor educational progress.

Beginning in 2021, individual indicators can be accessed online on the newly redesigned Condition of Education Indicator System website. A synthesis of key findings from these indicators can be found in the Report on the Condition of Education, a more user-friendly PDF report.

A total of 86 indicators are included in this year’s Condition of Education, 55 of which were updated this year. As in prior years, these indicators present a range of topics from prekindergarten through postsecondary education, as well as labor force outcomes and international comparisons. Additionally, this year’s 55 updated indicators include 17 indicators on school crime and safety.

For the 2021 edition of the Condition of Education, most data were collected prior to 2020, either during the 2018–19 academic year or in fall 2019. Therefore, with some exceptions, this year’s report presents findings from prior to the coronavirus pandemic.

At the elementary and secondary level (prekindergarten through grade 12), the data show that 50.7 million students were enrolled in public schools fall 2018, the most recent year for which data were available at the time this report was written. Public charter school enrollment accounted for 7 percent (3.3 million students) of these public school enrollments, more than doubling from 3 percent (1.6 million students) in 2009. In 2019, U.S. 4th- and 8th-grade students scored above the scale centerpoint (500 out of 1000) on both the math and science assessments in the Trends in International Mathematics and Science Study (TIMSS).

In 2020, 95 percent of 25- to 29-year-olds had at least a high school diploma or equivalent, while 39 percent had a bachelor’s or higher degree. These levels of educational attainment are associated with economic outcomes, such as employment and earnings. For example, among those working full time, year round, annual median earnings in 2019 were 59 percent higher for 25- to 34-year-olds with a bachelor’s or higher degree than for those with a high school diploma or equivalent.

In addition to regularly updated annual indicators, this year’s two spotlight indicators highlight early findings on the educational impact of the coronavirus pandemic from the Household Pulse Survey (HPS).

  • The first spotlight examines distance learning at the elementary and secondary level at the beginning of the 2020–21 academic year. Overall, among adults with children under 18 in the home enrolled in school, two-thirds reported in September 2020 that classes had been moved to a distance learning format using online resources. In order to participate in these remote learning settings, students must have access to computers and the internet. More than 90 percent of adults with children in their household reported that one or both of these resources were always or usually available to children for educational purposes in September 2020. At the same time, 59 percent of adults reported that computers were provided by the child’s school or district, while 4 percent reported that internet access was paid for by the child’s school or district. Although higher percentages of lower income adults reported such assistance, this did not eliminate inequalities in access to these resources by household income.
  • The second spotlight examines changes in postsecondary education plans for fall 2020 in response to the coronavirus pandemic. Among adults 18 years old and over who had household members planning to take classes in fall 2020 from a postsecondary institution, 45 percent reported that the classes at least one household member planned would be in different formats in the fall (e.g., formats would change from in-person to online), 31 percent reported that all plans to take classes in the fall had been canceled for at least one household member, and 12 percent reported that at least one household member would take fewer classes in the fall. Some 28 percent reported no change in fall plans to take postsecondary classes for at least one household member. The two most frequently cited reasons for the cancellation of plans were having the coronavirus or having concerns about getting the coronavirus (46 percent), followed by not being able to pay for classes/educational expenses because of changes to income from the pandemic (42 percent).

The Condition of Education also includes an At a Glance section, a Reader’s Guide, a Glossary, and a Guide to Sources, all of which provide additional background information. Each indicator includes references to the source data tables used to produce the indicator.

As new data are released throughout the year, indicators will be updated and made available online.

In addition to publishing the Condition of Education, NCES produces a wide range of other reports and datasets designed to help inform policymakers and the public about significant trends and topics in education. More information about the latest activities and releases at NCES may be found on our website or by following us on Twitter, Facebook, and LinkedIn.


By James L. Woodworth, NCES Commissioner

Distance Education in College: What Do We Know From IPEDS?

Distance education (DE) is defined by the Integrated Postsecondary Education Data System (IPEDS) as “education that uses one or more technologies to deliver instruction to students who are separated from the instructor.” By allowing students to take classes online in their own locations and on their own schedules, DE has increased access to college. Since the beginning of the coronavirus pandemic in spring 2020, DE has become an important way to deliver college classes while helping to keep students safe.

IPEDS collects information on DE in four of its surveys: Institutional Characteristics, Fall Enrollment, Completions, and, most recently, 12-Month Enrollment. The figures below present key statistics on DE course/program offerings and enrollments at U.S. colleges.

How many colleges offer distance education courses and programs?

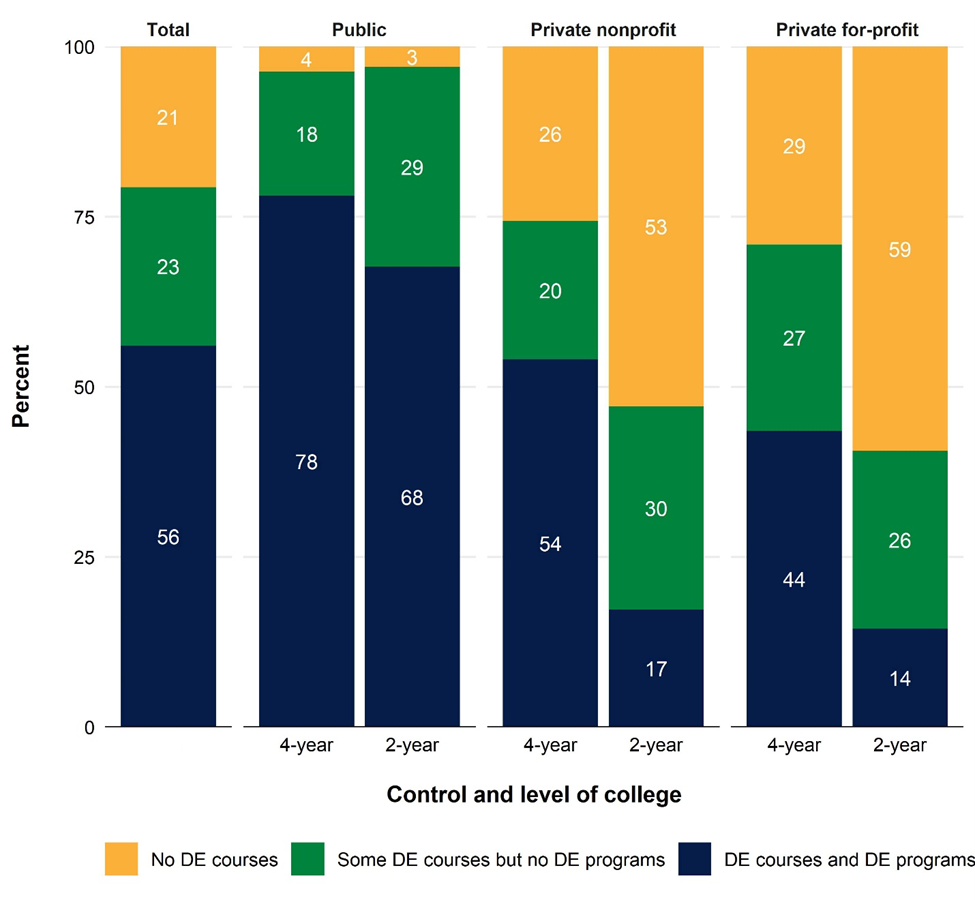
In 2018–19, most colleges (79 percent) offered either stand-alone DE courses or entire DE programs (e.g., 100% online degrees). DE course and program offerings differed by the control (public, private nonprofit, or private for-profit) and level (4-year or 2-year) of the college.

  • Almost all public 4- and 2-year colleges (96 and 97 percent, respectively) offered either DE courses or DE programs.
  • A majority of private nonprofit and for-profit 2-year colleges (53 and 59 percent, respectively) did not offer DE courses or DE programs, though they account for a small number of colleges.

Figure 1. Percentage distribution of colleges, by control, level, and distance education (DE) offerings of college: Academic year 2018–19
NOTE: Figure includes U.S. degree-granting institutions that participate in Title IV federal financial aid programs. Although rounded numbers are displayed, the figures are based on unrounded data. Detail may not sum to totals because of rounding.

SOURCE: U.S. Department of Education, National Center for Education Statistics, Integrated Postsecondary Education Data System (IPEDS) Institutional Characteristics component, Fall 2018.


How many students are enrolled in distance education courses?

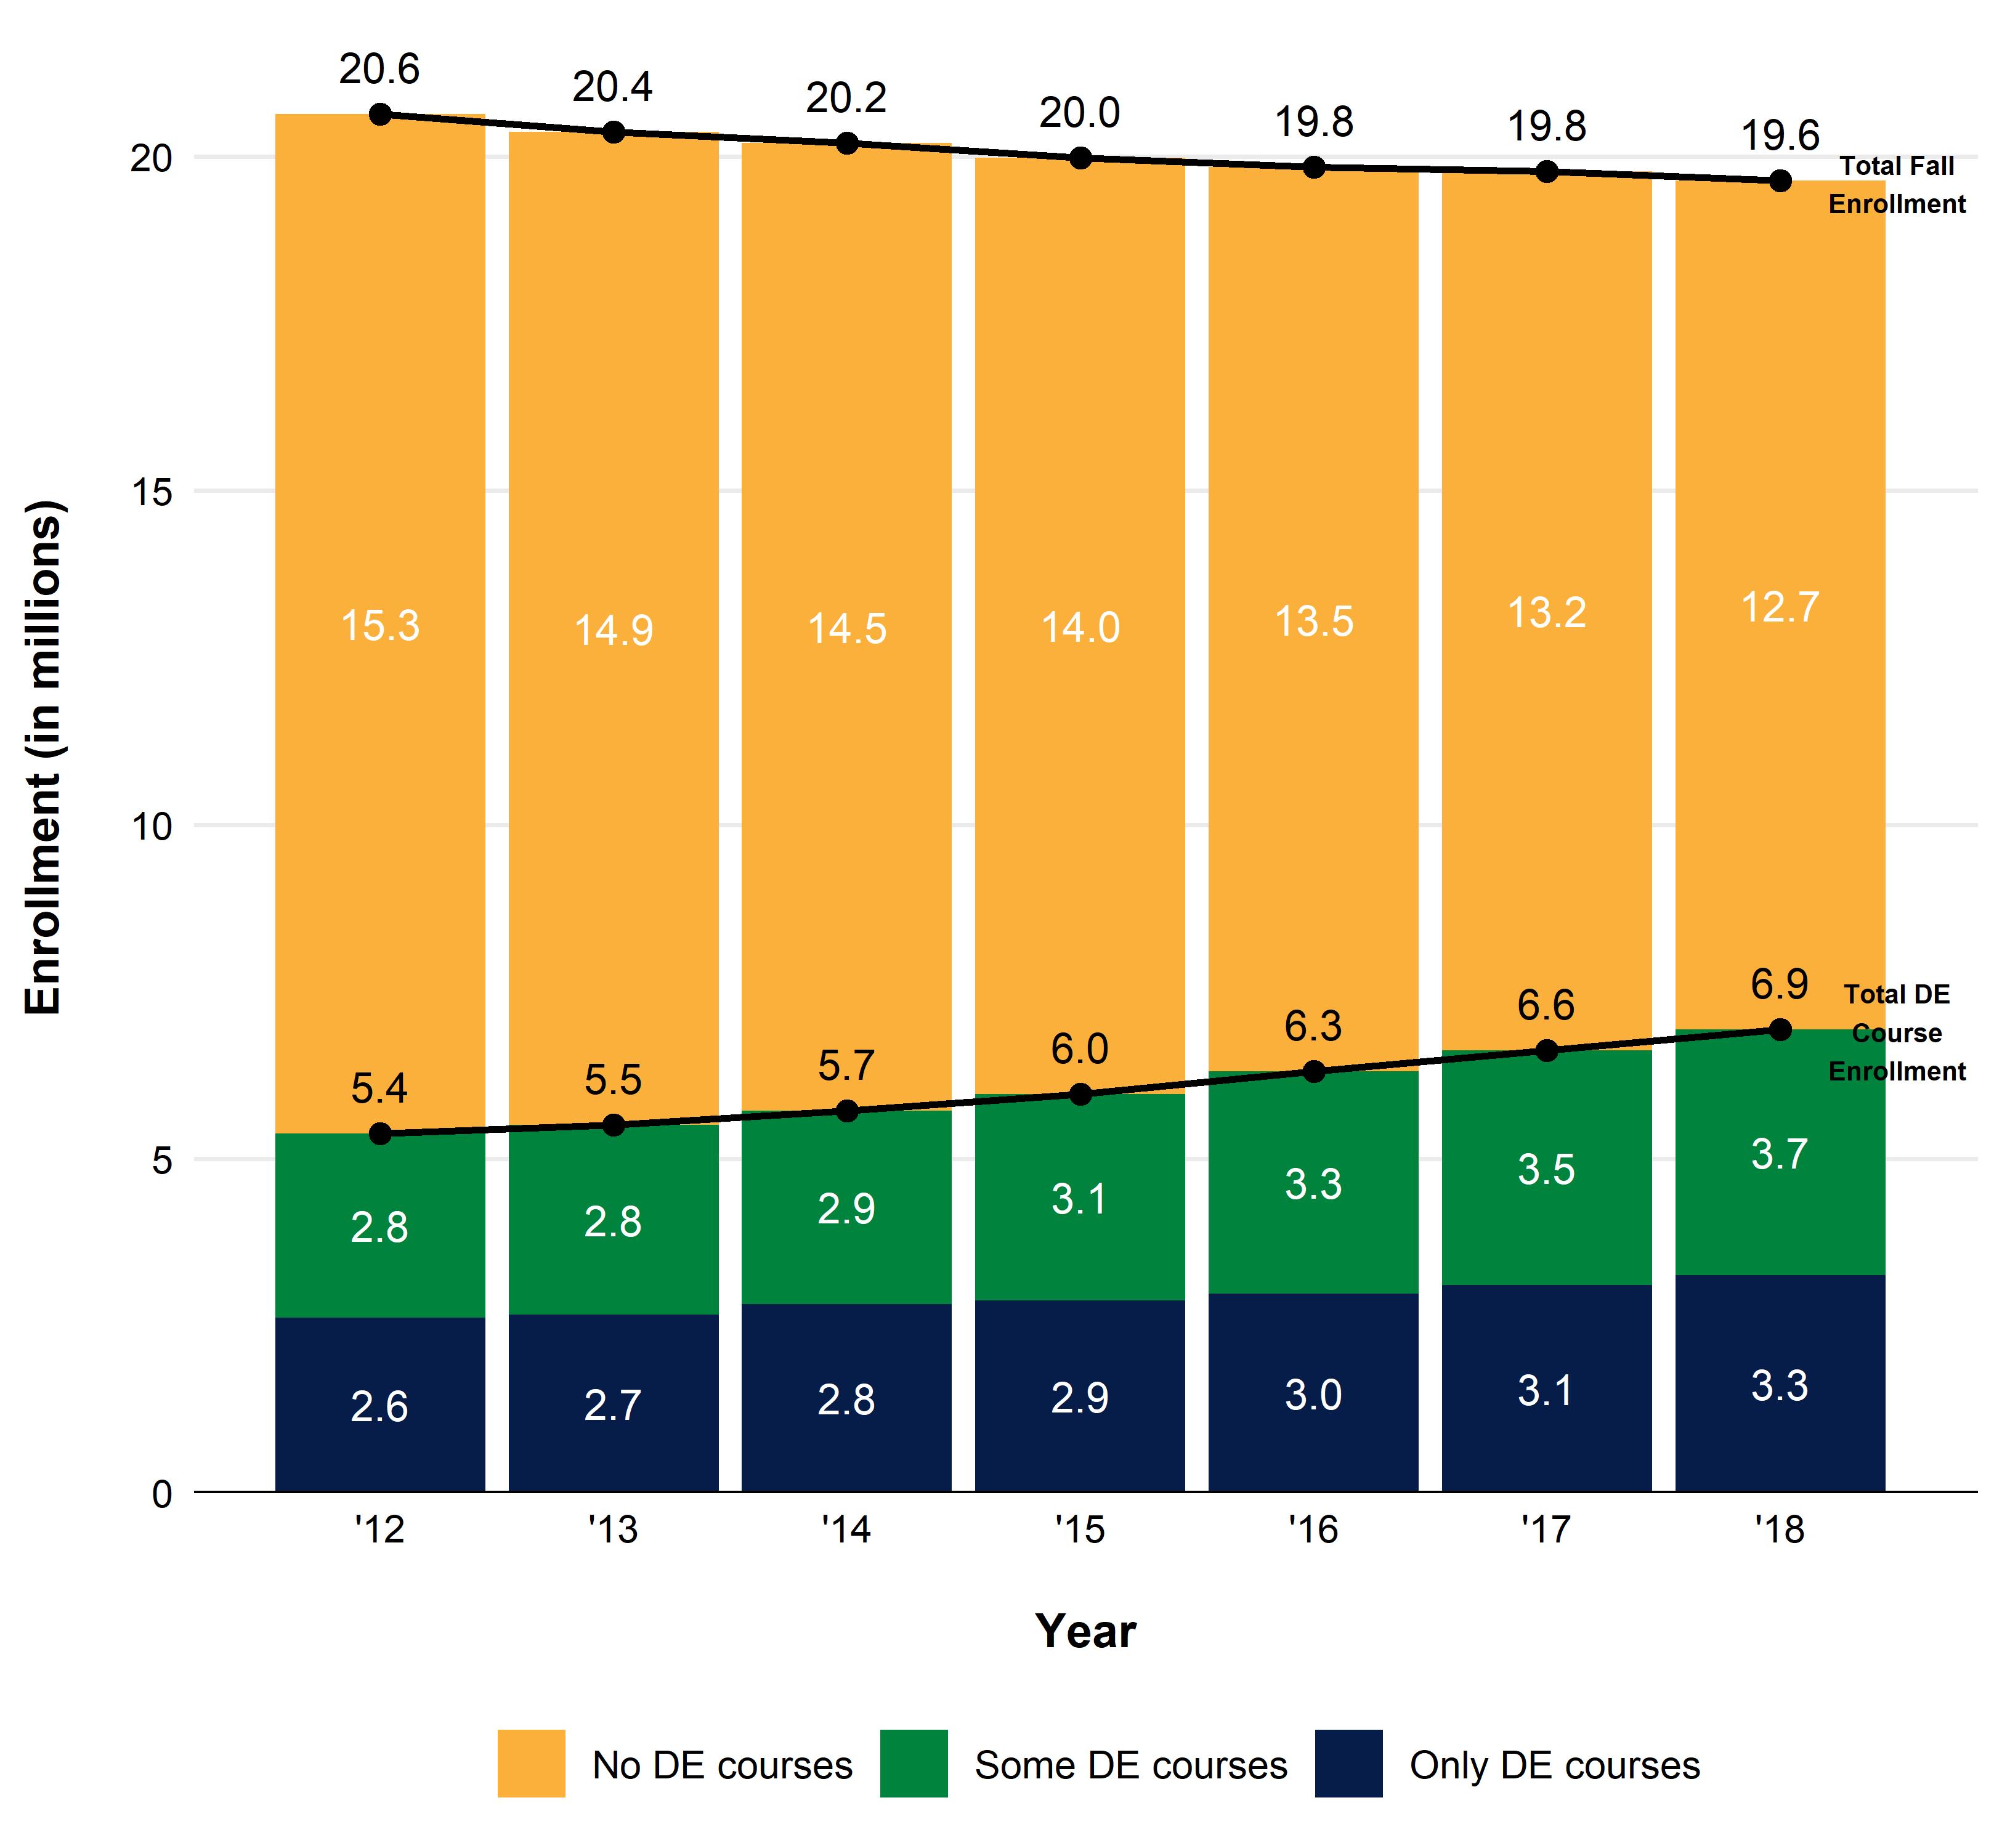
In fall 2018, about 6.9 million students enrolled in DE courses, or 35 percent of the total fall enrollment population (19.6 million).

  • Between fall 2012 and 2018, DE course enrollment increased 29 percent (from 5.4 to 6.9 million), while total fall enrollment declined by 5 percent (from 20.6 to 19.6 million).
  • The number of students enrolled in a mix of DE and face-to-face courses increased by 33 percent (from 2.8 to 3.7 million) between fall 2012 and 2018. The number of students enrolled in only DE courses also increased, but at a slower rate of 24 percent (from 2.6 to 3.3 million).

Figure 2. Total college enrollment, by distance education (DE) participation of students: Fall 2012 through fall 2018
NOTE: Figure includes U.S. degree-granting institutions that participate in Title IV federal financial aid programs. Although rounded numbers are displayed, the figures are based on unrounded data.

SOURCE: U.S. Department of Education, National Center for Education Statistics, Integrated Postsecondary Education Data System (IPEDS) Fall Enrollment component, Spring 2013 through Spring 2019.


How does enrollment in distance education courses vary by college control?

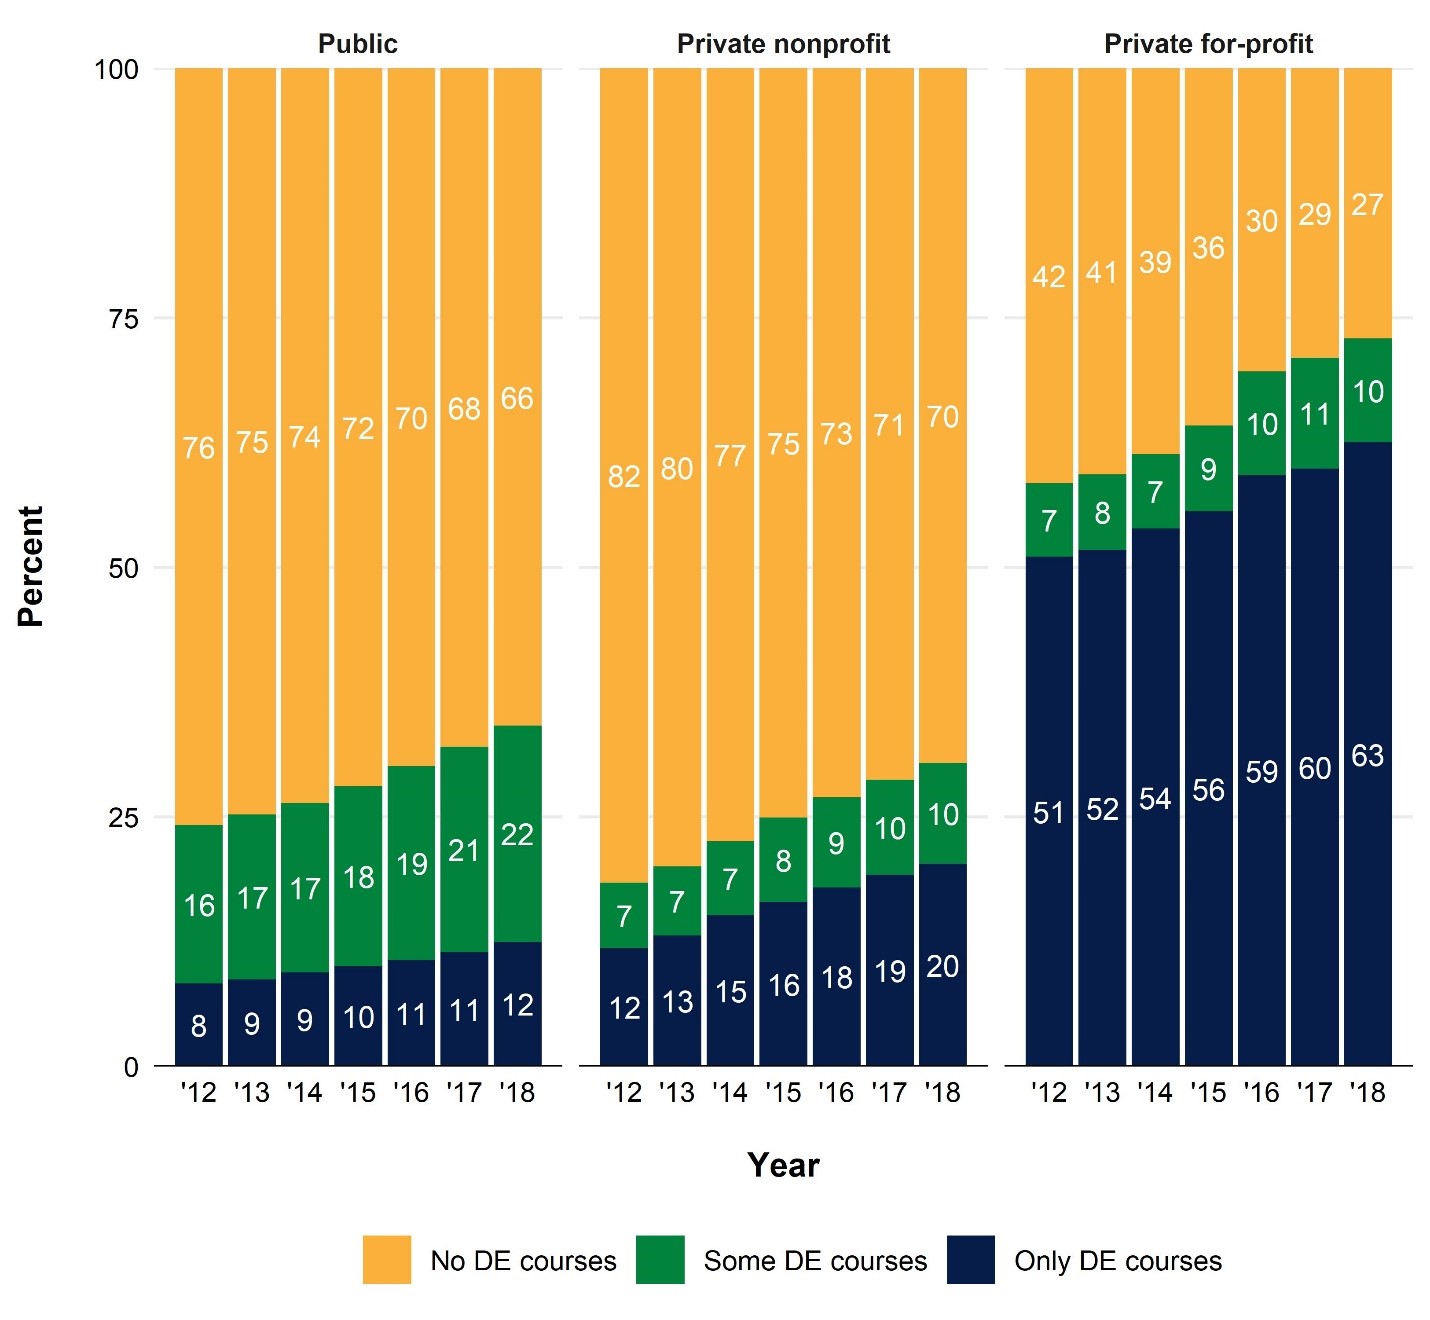
In fall 2018, the share of students enrolled in DE courses differed by control of the college.

  • About one-third of students at public and private nonprofit colleges enrolled in at least one DE course (34 and 30 percent, respectively).
  • At public colleges, students were more likely to enroll in a mix of DE and face-to-face courses (22 percent) than in only DE courses (12 percent). This trend reversed at private nonprofit colleges, with 10 percent of students enrolled in a mix of DE and face-to-face courses and 20 percent in only DE courses.
  • At private for-profit colleges, most students (73 percent) enrolled in at least one DE course (10 percent in a mix of DE and face-to-face courses and 63 percent in only DE courses).

Figure 3. Percentage distribution of college enrollment, by control of college and distance education (DE) participation of students: Fall 2012 through fall 2018
NOTES: Figure includes U.S. degree-granting institutions that participate in Title IV federal financial aid programs. Although rounded numbers are displayed, the figures are based on unrounded data. Detail may not sum to totals because of rounding.

SOURCE: U.S. Department of Education, National Center for Education Statistics, Integrated Postsecondary Education Data System (IPEDS) Fall Enrollment component, Spring 2013 through Spring 2019.


Among students enrolled in only DE courses, where do they live relative to their colleges?

Students taking only DE courses do not necessarily live far away from their colleges (even when physically coming to campus is generally not required), especially among students enrolled in public colleges.

  • In fall 2018, most (82 percent) of the 1.8 million students taking only DE courses at public colleges lived in the same state as their colleges. Only 15 percent lived in a different state.
  • At private nonprofit and for-profit colleges, students taking only DE courses were less likely to live in the same state as their colleges (35 percent and 17 percent, respectively) and more likely to live in a different state (63 percent and 81 percent, respectively) in fall 2018.

Figure 4. Percentage distribution of college enrollment for students enrolled in only distance education (DE) courses, by control of college and location of students: Fall 2018

NOTE: One square represents 1 percent. “State unknown” is reported by the institution when a student’s home state of residence cannot be determined; “Location unknown” is imputed by IPEDS to classify students when the institution does not report any residence status. Figure includes U.S. degree-granting institutions that participate in Title IV federal financial aid programs.

SOURCE: U.S. Department of Education, National Center for Education Statistics, Integrated Postsecondary Education Data System (IPEDS) Fall Enrollment component, Spring 2019.


The DE enrollment figures above use the most recent IPEDS data available, which is limited to a fall “snapshot” date. However, in 2020–21, IPEDS expanded the 12-Month Enrollment survey to collect DE course enrollment for the entire 12-month academic year, which will provide even more information on DE enrollments at U.S. colleges. The first 12-month DE enrollment data, representing the 2019–20 academic year, will be released in spring 2021. These will be the first IPEDS enrollment data to overlap with the coronavirus pandemic, and DE course enrollments are expected to increase.

To learn more about DE data collected in IPEDS, visit the Distance Education in IPEDS resource page. To explore IPEDS data through easy-to-use web tools or to access data files to conduct your own original analyses like the ones presented in this blog, visit the IPEDS Use the Data page.


By Roman Ruiz and Jie Sun, AIR

Bar Chart Race: Changing Demographics in Postsecondary Enrollment

Last month, we released a blog post showing the changes over time in public elementary and secondary school enrollment by race/ethnicity. Now, we’re taking a look at the changing demographics of postsecondary enrollment. The visuals below, which use data from an array of sources, depict the changes in fall enrollment of U.S. residents in degree-granting postsecondary institutions from 1976 to 2028 by race/ethnicity. It should be noted that the predicted enrollment does not take into account future impacts from the current coronavirus pandemic.


SOURCE: U.S. Department of Education, National Center for Education Statistics, Higher Education General Information Survey (HEGIS), “Fall Enrollment in Colleges and Universities” surveys, 1976 and 1980; Integrated Postsecondary Education Data System (IPEDS), “Fall Enrollment Survey” (IPEDS-EF:90-99); IPEDS Spring 2001 through Spring 2018, Fall Enrollment component; and Enrollment in Degree-Granting Institutions by Race/Ethnicity Projection Model, 1980 through 2028.


Here are some highlights from the data:

  • 1976: Of the 10.8 million U.S. residents enrolled in degree-granting postsecondary institutions, some 9.1 million, or 84 percent, identified as White. Lower percentages of postsecondary students identified as Black (10 percent), Hispanic (4 percent), Asian/Pacific Islander (2 percent), and American Indian/Alaska Native (1 percent).
  • 2002: The percentage of postsecondary enrollment made up of White students dropped below 70 percent.
  • 2003: Postsecondary enrollment of Black students surpassed 2.0 million for the first time in history.
  • 2006: About 17.2 million U.S. residents were enrolled in degree-granting postsecondary institutions, a 23 percent increase since 1996. Over this 10-year period, Hispanic and Black students had the largest increases (68 and 51 percent, respectively), compared with Asian/Pacific Islander, American Indian/Alaska Native, and White students (41, 32, and 13 percent, respectively). However, White students still accounted for 67 percent of total U.S. resident enrollment in 2006.
  • 2007: Postsecondary enrollment of Hispanic students surpassed 2.0 million for the first time in history.
  • 2010: U.S. resident enrollment in postsecondary degree-granting institutions peaked at 20.3 million.
  • 2012: Enrollment of Hispanic students surpassed enrollment of Black students, making Hispanic students the largest minority population enrolled in postsecondary education.
  • 2028: It is projected that enrollment of U.S. residents in postsecondary institutions will increase slightly between 2016 and 2028 (from 18.8 million to 18.9 million) but remain lower than the all-time high in 2010 (20.3 million). In 2028, it is projected that 52 percent of U.S. residents enrolled in postsecondary institutions will be White, 21 percent will be Hispanic, 15 percent will be Black, 7 percent will be Asian/Pacific Islander, 4 percent will be of Two or more races, and 1 percent will be American Indian/Alaska Native. The Census Bureau estimates that in 2030, roughly 56 percent of the population will identify as White, 14 percent as Black, 21 percent as Hispanic, 7 percent as Asian, and 4 percent as of Two or more races (https://www.census.gov/content/dam/Census/library/publications/2020/demo/p25-1144.pdf).


By Rachel Dinkes, AIR

Bar Chart Races: Changing Demographics in K–12 Public School Enrollment

Bar chart races are a useful tool to visualize long-term trend changes. The visuals below, which use data from an array of sources, depict the changes in U.S. public elementary and secondary school enrollment from 1995 to 2029 by race/ethnicity.


Source: U.S. Department of Education, National Center for Education Statistics, Common Core of Data (CCD), “State Nonfiscal Survey of Public Elementary and Secondary Education,” 1995–96 through 2017–18; and National Elementary and Secondary Enrollment by Race/Ethnicity Projection Model, 1972 through 2029.


Total enrollment in public elementary and secondary schools has grown since 1995, but it has not grown across all racial/ethnic groups. As such, racial/ethnic distributions of public school students across the country have shifted.

One major change in public school enrollment has been in the number of Hispanic students enrolled. Enrollment of Hispanic students has grown from 6.0 million in 1995 to 13.6 million in fall 2017 (the last year of data available). During that time period, Hispanic students went from making up 13.5 percent of public school enrollment to 26.8 percent of public school enrollment. NCES projects that Hispanic enrollment will continue to grow, reaching 14.0 million and 27.5 percent of public school enrollment by fall 2029.

While the number of Hispanic public school students has grown, the number of White public school students schools has steadily declined from 29.0 million in 1995 to 24.1 million in fall 2017. NCES projects that enrollment of White public school students will continue to decline, reaching 22.4 million by 2029. The percentage of public school students who were White was 64.8 percent in 1995, and this percentage dropped below 50 percent in 2014 (to 49.5 percent). NCES projects that in 2029, White students will make up 43.8 percent of public school enrollment.

The percentage of public school students who were Black decreased from 16.8 percent in 1995 to 15.2 percent in 2017 and is projected to remain at 15.2 percent in 2029. The number of Black public school students increased from 7.6 million in 1995 to a peak of 8.4 million in 2005 but is projected to decrease to 7.7 million by 2029. Between fall 2017 and fall 2029, the percentage of public school students who were Asian/Pacific Islander is projected to continue increasing (from 5.6 to 6.9 percent), as is the percentage who were of Two or more races (from 3.9 to 5.8 percent). American Indian/Alaska Native students account for about 1 percent of public elementary and secondary enrollment in all years.

For more information about this topic, see The Condition of Education indicator Racial/Ethnic Enrollment in Public Schools.


By Ke Wang and Rachel Dinkes, AIR