IES Blog

Institute of Education Sciences

Explore Transfer Student Data from the Integrated Postsecondary Education Data System (IPEDS)

Transfer students who attend full time complete a degree at higher rates than those attending part time. There were 2.1 million students who transferred into a 4-year institution during the 2009-10 academic year. At public institutions, which had the majority of transfer students (1.3 million) in 2009-10, 61 percent of full-time transfers completed their degree after 8 years of entering the institution, compared to 32 percent of part-time transfers (figure 1).


While NCES data users may be more familiar with the postsecondary transfer student data in the Beginning Postsecondary Study, NCES also collects data on this topic through the Integrated Postsecondary Education Data System (IPEDS) collection. IPEDS annually requires over 4,000 colleges and universities to report their transfer data starting from enrollment to completion. As defined by IPEDS, students who transfer into an institution with prior postsecondary experience–whether credit was earned or not–are considered transfer-in students. Students who leave an institution without completing their program of study and subsequently enrolled in another institution are defined as transfer-out students.

Below are some of the key data collected on student transfers through the different IPEDS survey components:

  • Fall Enrollment (EF): Transfer-in data

Collected since 2006-07, institutions report the fall census count and specific characteristics—i.e., gender, race/ethnicity, and attendance status (full and part time)—of transfer-in students.

  • Graduation Rates (GR): Transfer-out data

Collected since 1997-98, GR collects counts of students who are part of a specific first-time, full-time student cohort. Data users can calculate the transfer-out rates of first-time, full-time students by race/ethnicity and gender for each institution that reports transfer-out data. NCES requires the reporting of transfer-out data if the mission of the institution includes providing substantial preparation for students to enroll in another eligible institution without having completed a program. If it is not part of the institution’s mission, an institution has the option to report transfer-out data.

  • Outcome Measures (OM): Transfer-in and transfer-out data

Collected since 2015-16, OM collects information on entering students who are first-time students as well as non-first-time students (i.e., transfer-in students). Institutions report on the completions of transfer-in students at three points in time: at 4, 6, and 8 years. Also, any entering student who does not earn an award (i.e., certificate, associate’s degree, or bachelor’s degree), leaves the institution, and subsequently enrolls in another institution is reported as a transfer-out student. Click to learn more about OM. All institutions reporting to OM must report their transfer-out students regardless of mission.


NCES has been collecting IPEDS for several decades, which allows for trend analysis. Check out the IPEDS Trend Generator’s quick analysis of transfer-in students' fall enrollment. Also, the National Postsecondary Education Cooperative commissioned a 2018 paper that provides a high-level examination of the most common issues regarding U.S. postsecondary transfer students and presents suggestions on how NCES could enhance its student transfer data collection. For example, one caveat to using IPEDS transfer data is that information on where students transfer from or to is not collected. This means IPEDS data cannot be used to describe the various pathways of transfer students, such as reverse, swirling, and lateral transferring.[1]. While these nuances are important in today’s transfer research, they are out of the scope of the IPEDS collection. However, IPEDS data do provide a valuable national look at transfers and at the institutions that serve them. 


[1] A reverse transfer is defined as a student who transfers from a high-level institution to a low-level institution (e.g., transferring from a 4-year institution to a 2-year institution). Students who take a swirling pathway move back and forth between multiple institutions. A lateral transfer student is a student who transfers to another institution at a similar level (e.g., 4-year to 4-year or 2-year to 2-year). 


By Gigi Jones


What is the difference between the ACGR and the AFGR?

By Joel McFarland

NCES and the Department of Education have released national and state-level Average Cohort Graduation Rates for the 2015-16 school year. You can see the data on the NCES website (as well as data from 2010-11 through 2015-16).

In recent years, NCES has released two widely-used annual measures of high school completion: the Adjusted Cohort Graduation Rate (ACGR) and the Averaged Freshman Graduation Rate (AFGR). Both measure the percent of public school students who attain a regular high school diploma within 4 years of starting 9th grade. However, they also differ in important ways. This post provides an overview of how each measure is calculated and why they may result in different rates.

What is the Adjusted Cohort Graduation Rate (ACGR)?

The ACGR was first collected for 2010-11 and is a newer graduation rate measure. To calculate the ACGR, states identify the “cohort” of first-time 9th graders in a particular school year, and adjust this number by adding any students who transfer into the cohort after 9th grade and subtracting any students who transfer out, emigrate to another country, or pass away. The ACGR is the percentage of the students in this cohort who graduate within four years. States calculate the ACGR for individual schools and districts and for the state as a whole using detailed data that track each student over time. In many states, these student-level records have become available at a state level only in recent years. As an example, the ACGR formula for 2012-13 was calculated like this:

Average Cohort Graduation Rate calculation

What is the Averaged Freshman Graduation Rate (AFGR)?

The AFGR uses aggregate student enrollment data to estimate the size of an incoming freshman class, which is compared to the number of high school diplomas awarded 4 years later. The incoming freshman class size is estimated by summing 8th grade enrollment in year one, 9th grade enrollment for the next year, and 10th grade enrollment for the year after, and then dividing by three. The averaging of the enrollment counts helps to smooth out the enrollment bump typically seen in 9th grade. The AFGR estimate is less accurate than the ACGR, but it can be estimated as far back as the 1960s since it requires only aggregate annual counts of enrollment and graduate data. As an example, the AFGR formula for 2012-13 was:

Average Freshman Graduation Rate calculation

Why do they produce different rates?

There are several reasons the AFGR and ACGR do not match exactly.

  • The AFGR’s estimate of the incoming freshman class is fixed, and is not adjusted to account for students entering or exiting the cohort during high school. As a result it is very sensitive to migration trends. If there is net out-migration after the initial cohort size is estimated, the AFGR will understate the graduation rate relative to the ACGR. If there is net in-migration, the AFGR will overstate the graduation rate;
  • The diploma count used in the AFGR includes any students who graduate with a regular high school diploma in a given school year, which may include students who took more or less than four years to graduate. The ACGR includes only those students who graduate within four years of starting ninth grade. This can cause the AFGR to be inflated relative to the ACGR; and
  • The AFGR’s averaged enrollment base is sensitive to the presence of 8th and 9th grade dropouts. Students who drop out in the 8th grade in one year are not eligible to be first-time freshmen the next year, but are included in the calculation of the AFGR enrollment base. At the same time, 9th grade dropouts should be counted as first-time 9th graders, but are excluded from the 10th grade enrollment counts used in the AFGR enrollment base. Since more students typically drop out in 9th grade than in 8th grade, the overall impact is likely to underestimate the AFGR enrollment base relative to the true ACGR cohort.

At the national level, these factors largely balance out, and the AFGR closely tracks the ACGR. For instance, in 2012-13, there was less than one percentage point difference between the AFGR (81.9%) and the ACGR (81.4%). At the state level, especially for small population subgroups, there is often more variation between the two measures.

On the NCES website you can access the most recently available data for each measure, including 2016-17 adjusted cohort graduation rates and 2012-13 averaged freshman graduation rates. You can find more data on high school graduation and dropout rates in the annual report Trends in High School Dropout and Completion Rates in the United States.

This blog was originally posted on July 15, 2015 and was updated on February 2, 2016, December 4, 2017, and January 24, 2019.

Expanding Student Success Rates to Reflect Today’s College Students

By Gigi Jones

Since the 1990s, the Integrated Postsecondary Education Data System (IPEDS) has collected and published graduation rates for colleges and universities around the country. These rates were based on traditional college students—first-time, full-time degree- or certificate-seeking undergraduate students (FTFT) who, generally, enrolled right after high school.

While these data are insightful, some have argued the FTFT graduation rate only provides a part of the picture because it doesn’t consider non-traditional students, including those who are part-time students and transfers. This is an important point because, over the past decade, the number of non-traditional students has outpaced the increase in traditional students, mostly driven by growth in those who have transferred schools.  

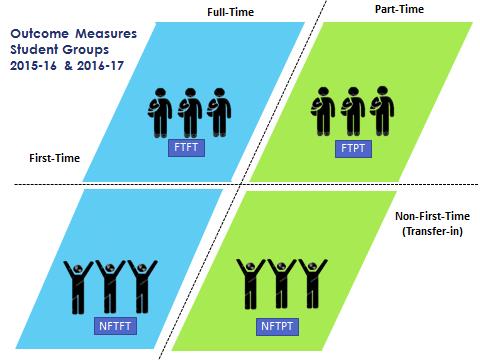
The new IPEDS Outcome Measures survey was designed to help answer these changes. Starting with the 2015-16 collection cycle, entering students at more than 4,000 degree-granting institutions must be reported in one of four buckets, also called cohorts (see Figure below).

The FTFT cohort is similar to what has been collected since the 1990s, but the Outcome Measures adds three new student groups to the equation: 

  • First-time, part-time students (FTPT), who attend less than a full-time credit workload each term (typically less than 12-credits) and who have no prior postsecondary attendance; 
  • Non-first-time students, also known as transfer-in students, who are enrolled at a full-time level (NFTFT); and
  • Non-first-time students, also known as transfer-in students, who are enrolled at a part-time level (NFTPT).

For these four cohorts, postsecondary institutions report the awards conferred at two points of time after the students entered the institution: 6 years and 8 years. If students did not receive an award, then institutions must report their enrollment status one of three ways: 1) Still enrolled at the same institution; 2) Transferred out of the institution; or 3) Enrollment status is unknown.

These changes help respond to those who feel that the FTFT graduation rates do not reflect the larger student population, in particular public 2-year colleges that serve a larger, non-traditional college student population. Since 2008, steps have been taken to construct and refine the data collection of non-traditional college students through a committee of higher education experts (PDF) and public Technical Review Panels (see summaries for panels 37, 40 and 45).

The 2016-17 preliminary Outcome Measures data were released on October 12, as part of a larger report on IPEDS winter data collection. The data for individual schools can be found on our College Navigator site.  The final data for 2015-16 will be released in early 2018. Sign up for the IES News Flash to be notified when the new data are released or follow IPEDS on Twitter. You can also visit the IPEDS Outcome Measures website for more information. 

While this is an important step in the process, we are continuing to improve the data collection process. Starting with the 2017-18 Outcome Measures collection, the survey includes more groups (i.e., Pell Grant v. Non-Pell Grant recipients), a third award status point (4-years after entry), and the identification of the type of award (i.e., certificates, Associate’s, and Bachelor’s). Watch for the release of these data in fall 2018. 

EDITOR'S NOTE: This post was updated on October 12 to reflect the release of Outcome Measures data.