IES Blog

Institute of Education Sciences

New Report Highlights Progress and Challenges in U.S. High School Dropout and Completion Rates

A new NCES report has some good news about overall high school dropout and completion rates, but it also highlights some areas of concern.

Using a broad range of data, the recently released Trends in High School Dropout and Completion Rates in the United States report shows that the educational attainment of young adults has risen in recent decades. The public high school graduation rate is up, and the status dropout rate (the percentage of 16- to 24-year-olds who are not enrolled in school and have not completed high school) is down. Despite these encouraging trends, there are significant disparities in educational attainment among young adults in the United States. The report shines new light on these disparities by analyzing detailed data from the U.S. Census Bureau.

For large population groups, the report provides status dropout rates calculated using annual data from the American Community Survey (ACS), administered by the U.S. Census Bureau. For example, in 2017, some 5.4 percent of 16- to 24-year-olds who were not enrolled in high school lacked a high school diploma or equivalent credential.

For smaller population groups, there are not enough ACS respondents during any given year to allow for precise and reliable estimates of the high school status dropout rate. For these demographic subgroups, NCES pools the data from 5 years of the ACS in order to obtain enough respondents to accurately describe patterns in the dropout rate.

For example, while the overall status dropout rate for Asian 16- to 24-year-olds was below the national average in 2017, the rates for specific subgroups of Asian young adults varied widely. Based on 5 years of ACS data, high school status dropout rates among Asian 16- to 24-year-olds ranged from 1.1 percent for individuals of Korean descent to 23.2 percent for individuals of Burmese descent. These rates represent the “average” status dropout rate for the period from 2013 to 2017. They offer greater precision than the 1-year estimates, but the 5-year time span might make them difficult to interpret at first glance. 


Figure 1. Percentage of high school dropouts among persons 16 through 24 years old (status dropout rate), by selected Asian subgroups: 2013–2017

‡ Reporting standards not met. Either there are too few cases for a reliable estimate or the coefficient of variation (CV) is 50 percent or greater.
If the estimation procedure were repeated many times, 95 percent of the calculated confidence intervals would contain the true status dropout rate for the population group.
NOTE: “Status” dropouts are 16- to 24-year-olds who are not enrolled in school and who have not completed a high school program, regardless of when they left school. People who received an alternative credential such as a GED are counted as high school completers. This figure presents 5-year average status dropout rates for the period from 2013 to 2017. Use of a 5-year average increases the sample size, thereby reducing the sampling error and producing more stable estimates. Data are based on sample surveys of the entire population of 16- to 24-year-olds residing within the United States, including both noninstitutionalized persons (e.g., those living in households, college housing, or military housing located within the United States) and institutionalized persons (e.g., those living in prisons, nursing facilities, or other healthcare facilities). Estimates may differ from those based on the Current Population Survey (CPS) because of differences in survey design and target populations. Asian subgroups exclude persons of Hispanic ethnicity.
SOURCE: U.S. Department of Commerce, Census Bureau, American Community Survey (ACS), 2013–2017.


The 5-year ACS data can also be used to describe status dropout rates for smaller geographic areas with more precision than the annual ACS data. For example, the average 2013–2017 status dropout rates ranged from 3.8 percent in Massachusetts to 9.6 percent in Louisiana. The 5-year ACS data allowed us to calculate more accurate status dropout rates for each state and, in many cases, for racial/ethnic subgroups within the state. Access the complete state-level dropout rates by race/ethnicity here.


Figure 2. Percentage of high school dropouts among persons 16 through 24 years old (status dropout rate), by state: 2013–2017

NOTE: “Status” dropouts are 16- to 24-year-olds who are not enrolled in school and who have not completed a high school program, regardless of when they left school. People who received an alternative credential such as a GED are counted as high school completers. This figure presents 5-year average status dropout rates for the period from 2013 to 2017. Use of a 5-year average increases the sample size, thereby reducing the sampling error and producing more stable estimates. Data are based on sample surveys of the entire population of 16- to 24-year-olds residing within the United States, including both noninstitutionalized persons (e.g., those living in households, college housing, or military housing located within the United States) and institutionalized persons (e.g., those living in prisons, nursing facilities, or other healthcare facilities). Estimates may differ from those based on the Current Population Survey (CPS) because of differences in survey design and target populations.
SOURCE: U.S. Department of Commerce, Census Bureau, American Community Survey (ACS), 2013–2017. See table 2.3.


For more information about high school dropout and completion rates, check out the recently released Trends in High School Dropout and Completion Rates in the United States report. For more information about the 5-year ACS datasets, visit https://www.census.gov/programs-surveys/acs/guidance/estimates.html.


By Joel McFarland

What is the difference between the ACGR and the AFGR?

By Joel McFarland

NCES and the Department of Education have released national and state-level Average Cohort Graduation Rates for the 2015-16 school year. You can see the data on the NCES website (as well as data from 2010-11 through 2015-16).

In recent years, NCES has released two widely-used annual measures of high school completion: the Adjusted Cohort Graduation Rate (ACGR) and the Averaged Freshman Graduation Rate (AFGR). Both measure the percent of public school students who attain a regular high school diploma within 4 years of starting 9th grade. However, they also differ in important ways. This post provides an overview of how each measure is calculated and why they may result in different rates.

What is the Adjusted Cohort Graduation Rate (ACGR)?

The ACGR was first collected for 2010-11 and is a newer graduation rate measure. To calculate the ACGR, states identify the “cohort” of first-time 9th graders in a particular school year, and adjust this number by adding any students who transfer into the cohort after 9th grade and subtracting any students who transfer out, emigrate to another country, or pass away. The ACGR is the percentage of the students in this cohort who graduate within four years. States calculate the ACGR for individual schools and districts and for the state as a whole using detailed data that track each student over time. In many states, these student-level records have become available at a state level only in recent years. As an example, the ACGR formula for 2012-13 was calculated like this:

Average Cohort Graduation Rate calculation

What is the Averaged Freshman Graduation Rate (AFGR)?

The AFGR uses aggregate student enrollment data to estimate the size of an incoming freshman class, which is compared to the number of high school diplomas awarded 4 years later. The incoming freshman class size is estimated by summing 8th grade enrollment in year one, 9th grade enrollment for the next year, and 10th grade enrollment for the year after, and then dividing by three. The averaging of the enrollment counts helps to smooth out the enrollment bump typically seen in 9th grade. The AFGR estimate is less accurate than the ACGR, but it can be estimated as far back as the 1960s since it requires only aggregate annual counts of enrollment and graduate data. As an example, the AFGR formula for 2012-13 was:

Average Freshman Graduation Rate calculation

Why do they produce different rates?

There are several reasons the AFGR and ACGR do not match exactly.

  • The AFGR’s estimate of the incoming freshman class is fixed, and is not adjusted to account for students entering or exiting the cohort during high school. As a result it is very sensitive to migration trends. If there is net out-migration after the initial cohort size is estimated, the AFGR will understate the graduation rate relative to the ACGR. If there is net in-migration, the AFGR will overstate the graduation rate;
  • The diploma count used in the AFGR includes any students who graduate with a regular high school diploma in a given school year, which may include students who took more or less than four years to graduate. The ACGR includes only those students who graduate within four years of starting ninth grade. This can cause the AFGR to be inflated relative to the ACGR; and
  • The AFGR’s averaged enrollment base is sensitive to the presence of 8th and 9th grade dropouts. Students who drop out in the 8th grade in one year are not eligible to be first-time freshmen the next year, but are included in the calculation of the AFGR enrollment base. At the same time, 9th grade dropouts should be counted as first-time 9th graders, but are excluded from the 10th grade enrollment counts used in the AFGR enrollment base. Since more students typically drop out in 9th grade than in 8th grade, the overall impact is likely to underestimate the AFGR enrollment base relative to the true ACGR cohort.

At the national level, these factors largely balance out, and the AFGR closely tracks the ACGR. For instance, in 2012-13, there was less than one percentage point difference between the AFGR (81.9%) and the ACGR (81.4%). At the state level, especially for small population subgroups, there is often more variation between the two measures.

On the NCES website you can access the most recently available data for each measure, including 2016-17 adjusted cohort graduation rates and 2012-13 averaged freshman graduation rates. You can find more data on high school graduation and dropout rates in the annual report Trends in High School Dropout and Completion Rates in the United States.

This blog was originally posted on July 15, 2015 and was updated on February 2, 2016, December 4, 2017, and January 24, 2019.

America’s Advanced Mathematics and Physics Students in a Global Context

By Dana Tofig, Communications Director, Institute of Education Sciences

In today’s increasingly global economy, there is a lot of interest in understanding how students in the United States (U.S.) are performing compared to their peers around the world. That is why the National Center for Education Statistics participates in and conducts several international assessments. One of those assessments—the Trends in International Mathematics and Science Study (TIMSS) Advanced—gives us a unique opportunity to see how our advanced students are performing in rigorous mathematics and physics classes as they complete high school. TIMSS Advanced is part of a broader data collection that also assesses the performance of 4th- and 8th-grade students in mathematics and science, the results of which are summarized in another blog entry.
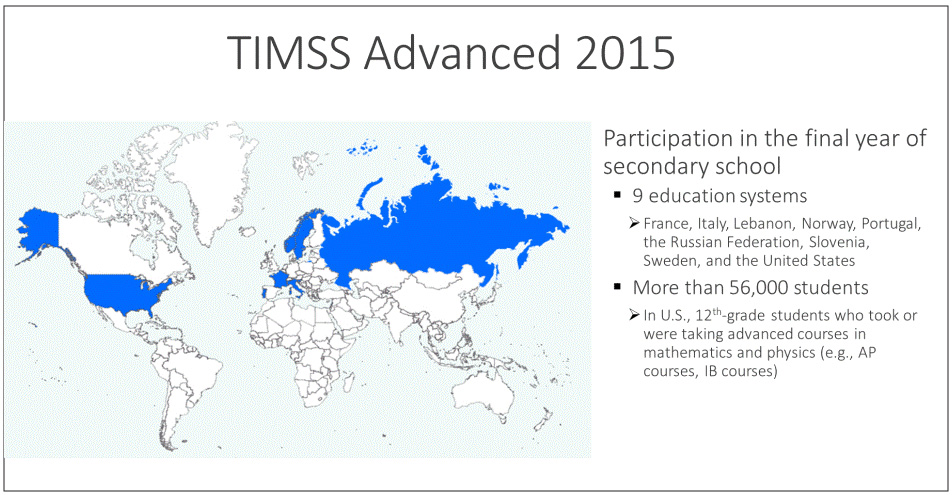
The TIMSS Advanced 2015 was administered to students from nine education systems that were in their final year of secondary school who had taken or were taking advanced mathematics or physics courses. In the U.S., the TIMSS Advanced was given to over 5,500 students in Grade 12 who were taking or had taken advanced mathematics courses covering topics in geometry, algebra and calculus, or a second-year physics course. The last time that the U.S. participated in TIMSS Advanced was 1995.

What Percentage of Students Take Advanced Mathematics and Physics?

Among the nine education systems participating in TIMSS Advanced 2015, the percentage of the corresponding age cohort (18-year-olds in the U.S.) taking advanced mathematics varies widely. This percentage, which TIMSS calls the “coverage index,” ranges from a low of 1.9 percent to a high of 34.4 percent. The U.S. falls in the middle, with 11.4 percent of 18-year-olds taking advanced mathematics courses.  The U.S. advanced mathematics coverage index in 2015 has nearly doubled since 1995, when it was 6.4 percent.
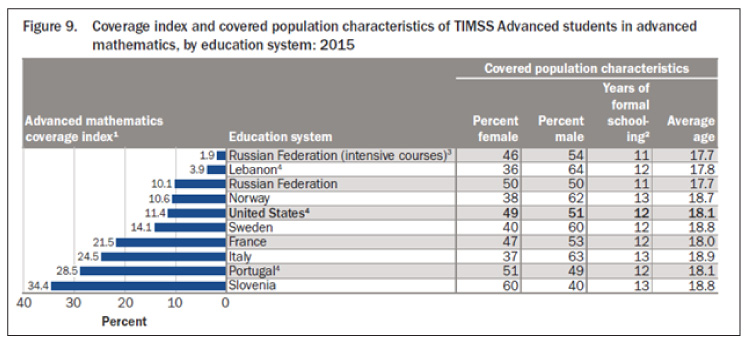
In the U.S. and two other participating systems—Portugal and Russian Federation—the students taking advanced mathematics were split fairly evenly between male and female. In the remaining systems, the students in the coverage index were majority male, except for Slovenia, where 60 percent were female. Interestingly, Slovenia had the highest coverage index, at 34.4 percent.

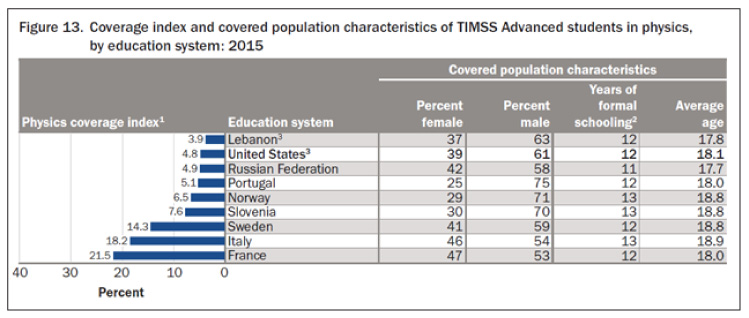
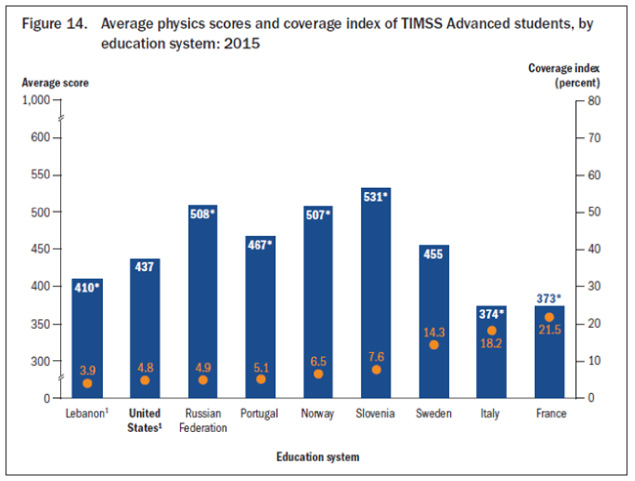
It’s a different story in science for the U.S. Among 18-year-olds in the U.S., 4.8 percent took Physics, which was among the lowest for the nine systems participating in TIMSS Advanced. Only Lebanon (3.9 percent) had a lower percentage, while France had the highest coverage index at 21.5 percent. Males made up a majority of physics students in all nine participating systems, including the U.S. 
How Did U.S. Students Perform in Advanced Mathematics?

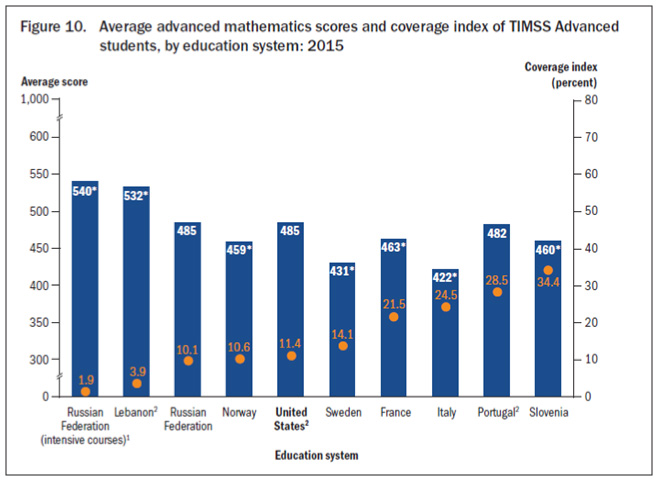
U.S. students scored 485 on TIMSS Advanced 2015 in advanced mathematics, which is not significantly different from the average U.S. score in 1995. It should be noted that on TIMSS 2015, given to a representative sample of fourth- and eighth-graders across the U.S., mathematics scores for both grades increased significantly from 1995 to 2015.

On TIMSS Advanced 2015 in advanced mathematics, two systems scored significantly higher than the U.S. (Lebanon and Russian Federation students who took intensive courses[1]) while five systems scored significantly lower (Norway, Sweden, France, Italy and Slovenia). The remaining two systems scored about the same as the U.S.
How Did U.S. Students Perform in Physics?

U.S. students scored 437 on TIMSS Advanced 2015 in physics, which was not statistically different than in 1995. No education system did better on physics in 2015 than 1995, but several did worse—four of the six systems that took the TIMSS Advanced in both 1995 and 2015 saw a significant drop in their scores.

Four of the nine countries participating in TIMSS Advanced 2015 in physics had a score that was significantly higher than the U.S. (Russian Federation, Portugal, Norway, and Slovenia) and three countries scored significantly lower than the U.S. (Lebanon, Italy and France). Sweden’s physics score was not significantly different than the U.S. 
A Note about Interpretation

It’s important to remember that there are differences in student characteristics and the structure of the various education systems that participated in TIMSS Advanced 2015. Those differences should be kept in mind when interpreting results. 


[1] Intensive courses are advanced mathematics courses that involve 6 or more hours per week. Results for students in these courses are reported separately from the results for other students from the Russian Federation taking courses that involve 4.5 hours per week. 

College and career readiness: Using ELS:2002 to study important educational outcomes

By Elise Christopher and Lauren Musu-Gillette

Researchers, educators, and policy makers are interested in knowing what makes students ready for college and careers, and the Department of Education has identified college and career readiness as a priority. In 2011, the Department announced that it would allow for Elementary/Secondary Education Act (ESEA) flexibility for states that developed plans for reforms in certain key areas of education, including college and career readiness.  In order to investigate what factors may be associated with college and career outcomes, several important questions arise. For example:

  • How do students’ high school experiences relate to whether or not they have to enroll in remedial courses in college?
  • How do these same experiences relate to whether or not they successfully complete college?
  • What high school and college experiences are associated with successful career choices?

Questions like these are best answered with longitudinal surveys, which track the paths of students as they transition from school to college and the work force.  The longitudinal surveys conducted by NCES contain a wide variety of survey components that enable researchers to address policy-related topics across disciplines.  Such longitudinal data can be expensive and time consuming to collect, particularly if they are nationally representative with sufficient sample sizes to analyze barriers faced by disadvantaged young adults. Building a sound statistical foundation for these important analyses is one of the key contributions NCES makes when producing datasets such as the Education Longitudinal Study of 2002 (ELS:2002) for the education and research community.

ELS:2002 began by collecting data from a nationally representative cohort of students who were in the 10th grade in 2002. Follow up surveys were collected from these same students in 2004, 2006, and 2012. Some students enrolled in postsecondary institutions after high school, while others entered the workforce. ELS:2002 can be used to examine the educational and occupational paths of students over time, as well as the different factors that are associated with those paths.

ELS:2002 collected a wide variety of information including students’ school experiences and activities, plans for the future, family circumstances, and beliefs about themselves. Many variables in the ELS:2002 dataset are available to the public with no restrictions. The data are easily accessible for individuals who may be interested in examining how a variety of different backgrounds and experiences may affect students’ college and career readiness. Some variables are not in the public datasets to ensure that identities of survey respondents are protected, but are available to researchers who apply for a restricted use license.

Use of datasets such as ELS:2002 can assist researchers, educators and policy makers in answering important questions about how to prepare our students for college and careers.  For more information on accessing and using ELS:2002 data, please refer to information about available data, see our detailed selection of users manuals, or email the ELS:2002 staff.

Dropout rates: Measuring high school non-completion

By Lauren Musu-Gillette

High school dropouts face increasingly high rates of unemployment and low annual earnings. Therefore, it is important to have an accurate representation of the number of high school dropouts in the U.S.


Median annual earnings of full-time year-round wage and salary workers ages 25-34, by educational attainment: 2013

Figure. Median annual earnings of full-time year-round workers ages 25-34, by educational attainment: 2013

1 Total represents median annual earnings of all full-time year-round wage and salary workers ages 25–34.
2 Total represents median annual earnings of young adults with a bachelor's degree or higher.
NOTE: Full-time year-round workers are those who worked 35 or more hours per week for 50 or more weeks per year.
SOURCE: U.S. Department of Commerce, Census Bureau, Current Population Survey (CPS), See Digest of Education Statistics 2014, table 502.30.


There are several different ways to measure the number and percentage of high school dropouts. The status dropout rate measures the percentage of individuals who are not in school and have not earned a high school diploma or alternative credential. The Condition of Education uses the Census Bureau’s Current Population Survey (CPS) to provide an annual update on the percentage of 16- through 24-year-olds who meet these criteria.

Another way of looking at high school non-completion is to examine the event dropout rate. This rate estimates the percentage of high school students who left high school between the beginning of one school year and the beginning of the next without earning a high school diploma or alternative credential. While the definition of dropout is similar in both these measures, the populations are different. The event dropout rate only includes students who left high school over the course of a given year whereas the status dropout rate can include those who dropped out over many years and who may not have attended high school at all. The event dropout rate can be calculated from the CPS or from data reported by state education agencies to NCES through the CCD collection.

As an example of how these rates can differ, the CCD event dropout rate from October 2011 to October 2012 was 3.4 percent, while the 2012 CPS status dropout rate was 6.6 percent for 16- to 24-year-olds. The broader age range and related time period captured in the status dropout rate captures a larger percentage of high school non-completers. Both rates are important because they offer different types of information about high school dropouts. However, they can also offer complementary information. For example, both the event dropout rate and the status dropout rate have declined since the 90s.

See Trends in High School Dropout and Completion Rates in the United States for more information on current dropout statistics.