IES Blog

Institute of Education Sciences

IES Honors Dominic Gibson as Outstanding Predoctoral Fellow

Each year, IES recognizes an outstanding fellow from its Predoctoral Interdisciplinary Research Training Programs in the Education Sciences for academic accomplishments and contributions to education research. The 2018 winner, Dr. Dominic Gibson completed his Ph.D. in Developmental Psychology at the University of Chicago. He is currently a Postdoctoral Researcher at the University of Washington where he specializes in understanding how children learn words and mathematical concepts. In this blog, Dominic discusses his research and his experience as an IES fellow.  

What inspired you to focus your research on early mathematics?

So many everyday activities as well as many of humanity’s greatest achievements rely on math. Simple math becomes so second nature to us that it is often difficult for older students to conceptualize what it would be like to not have a basic understanding of numbers. But children take months and often years to learn the meanings of just the first few number words (one, two, three) and to learn how the counting procedure really works. Children’s acquisition of other math terms (angle, proportion, unit of measurement) is similarly marked by misconceptions and slow, difficult learning.  

Overcoming these learning challenges relies on an interesting mixture of uniquely human abilities (like language) and skills we share with other animals. Moreover, children’s ability to master early math concepts predicts their future academic success. Therefore, by studying how children learn about math, we can better understand the sources of humanity’s unique achievements and apply this knowledge to reducing early achievement gaps and maximizing our potential.

Based on your research, what advice would you give parents of pre-kindergartners on how to help their children develop math skills?

My biggest piece of advice is to talk to children about numbers and other basic math concepts. Children benefit from abundant language input in general, and “math talk” is no different. Even simply talking about different numbers of things seems to be particularly important for acquiring early math concepts. Numbers can be easily incorporated into a variety of activities, like taking a walk (“let’s count the birds we see”) or going to the grocery store (“how many oranges should we buy?”). Likewise, good jumping off points for using other types of early math talk such as relational language are activities like puzzles (“this one is too curvy to fit here—we need to find a piece with a flat edge”) and block building (“can you put this small block on top of the bigger one?”).

It also may be useful to note that even when a child can say a word, they may not fully understand what it means. For instance, two- to four-year-old children can often recite a portion of the count list (for example, the numbers one through ten) but if you ask them to find a certain number of items (“can you give me three blocks?”) they may struggle when asked for sets greater than two or three. Therefore, in addition to counting, it is important to connect number words to specific quantities (“look there are three ducks”). It may be especially helpful to connect counting to the value of a set (“let’s count the ducks—one, two, three—there are three!”).

My last piece of advice is to be careful about the types of messages we send our children about math. Many people experience “math anxiety,” and if we are not careful, children can pick up on these signals and become anxious about math themselves or internalize negative stereotypes about the types of people who are and are not good at math. Ensuring that children feel empowered to excel in math is an important ingredient for their success.

How has being an IES predoctoral fellow helped your development as a researcher?

The diverse group of people and perspectives I encountered as an IES predoctoral fellow made a huge impact on my development as a researcher. As an IES predoctoral fellow pursuing a degree in psychology, I met many students and faculty members who were interested in the same questions that interest me but who approached these questions from a variety of other disciplines, such as economics, public policy, and sociology. I also connected with networks of educators and policymakers outside of academia who alerted me to important issues that I may have missed if I had only worked within my own discipline. Through these experiences, I gained new tools for conducting my research and learned to avoid the types of blind spots that often develop when approaching a problem from a single perspective. In particular, I gained an appreciation for the challenges of translating basic science to educational practice and the number of interesting research questions that emerge when attempting to do this work.

Compiled by Katina Rae Stapleton, Education Research Analyst and Program Officer for the Predoctoral Interdisciplinary Research Training Programs in the Education Sciences, National Center for Education Research

New International Comparisons of Reading, Mathematics, and Science Literacy Assessments

The Program for International Student Assessment (PISA) is a study of 15-year-old students’ performance in reading, mathematics, and science literacy that is conducted every 3 years. The PISA 2018 results provide us with a global view of U.S. students’ performance compared with their peers in nearly 80 countries and education systems. In PISA 2018, the major domain was reading literacy, although mathematics and science literacy were also assessed.

In 2018, the U.S. average score of 15-year-olds in reading literacy (505) was higher than the average score of the Organization for Economic Cooperation and Development (OECD) countries (487). Compared with the 76 other education systems with PISA 2018 reading literacy data, including both OECD and non-OECD countries, the U.S. average reading literacy score was lower than in 8 education systems, higher than in 57 education systems, and not measurably different in 11 education systems. The U.S. percentage of top performers in reading was larger than in 63 education systems, smaller than in 2 education systems, and not measurably different in 11 education systems. The average reading literacy score in 2018 (505) was not measurably different from the average score in 2000 (504), the first year PISA was administered. Among the 36 education systems that participated in both years, 10 education systems reported higher average reading literacy scores in 2018 compared with 2000, and 11 education systems reported lower scores.

The U.S. average score of 15-year-olds in mathematics literacy in 2018 (478) was lower than the OECD average score (489). Compared with the 77 other education systems with PISA 2018 mathematics literacy data, the U.S. average mathematics literacy score was lower than in 30 education systems, higher than in 39 education systems, and not measurably different in 8 education systems. The average mathematics literacy score in 2018 (478) was not measurably different from the average score in 2003 (483), the earliest year with comparable data. Among the 36 education systems that participated in both years, 10 systems reported higher mathematics literacy scores in 2018 compared with 2003, 13 education systems reported lower scores, and 13 education systems reported no measurable changes in scores.  

The U.S. average score of 15-year-olds in science literacy (502) was higher than the OECD average score (489). Compared with the 77 other education systems with PISA 2018 science literacy data, the U.S. average science literacy score was lower than in 11 education systems, higher than in 55 education systems, and not measurably different in 11 education systems. The average science literacy score in 2018 (502) was higher than the average score in 2006 (489), the earliest year with comparable data. Among the 52 education systems that participated in both years, 7 education systems reported higher average science literacy scores in 2018 compared with 2006, 22 education systems reported lower scores, and 23 education systems reported no measurable changes in scores.

PISA is conducted in the United States by NCES and is coordinated by OECD, an intergovernmental organization of industrialized countries. Further information about PISA can be found in the technical notes, questionnaires, list of participating OECD and non-OECD countries, released assessment items, and FAQs.


By Thomas Snyder

New 2019 Reading and Mathematics Assessment Data on 4th- and 8th-Grade Students

The average reading score for U.S. 4th- and 8th-grade students decreased between 2017 and 2019. Changes in mathematics scores were mixed during this period, with an increase at grade 4 and a decrease at grade 8. These data are from the National Assessment of Educational Progress (NAEP)—also known as The Nation’s Report Card. NAEP is the largest nationally representative and continuing assessment of what students in the United States know and can do in various subject areas and is frequently referred to as the “gold standard” of student assessments.

In 4th-grade reading, the average scale score in 2019 was 220, one point lower than in 2017 (figure 1). In 8th-grade reading, the average scale score was 263, three points lower than in 2017 (figure 2). Compared with a decade ago in 2009, the 2019 average reading scale scores at each grade were not significantly different, but they were higher than the scale scores in 1992, the first time the reading assessment was administered.


Figure 1. Average National Assessment of Educational Progress (NAEP) reading scale scores of 4th-grade students: Selected years, 1992–2019
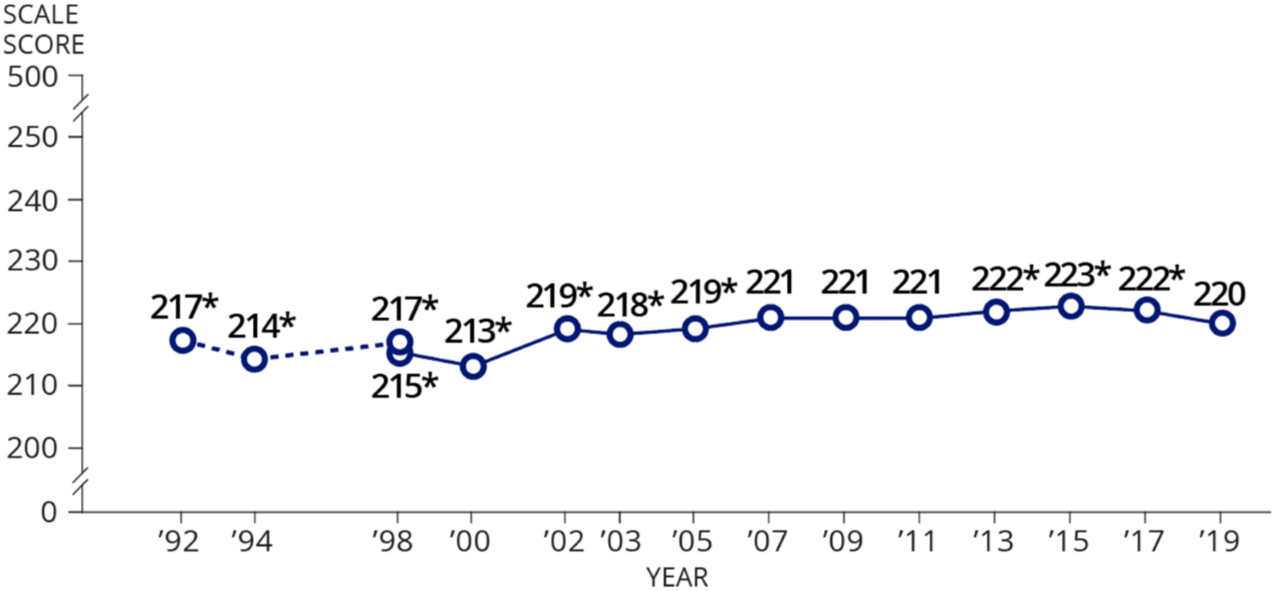
* Significantly different (p < .05) from 2019

--- Accommodations not permitted

— Accommodations permitted


Figure 2. Average National Assessment of Educational Progress (NAEP) reading scale scores of 8th-grade students: Selected years, 1992–2019
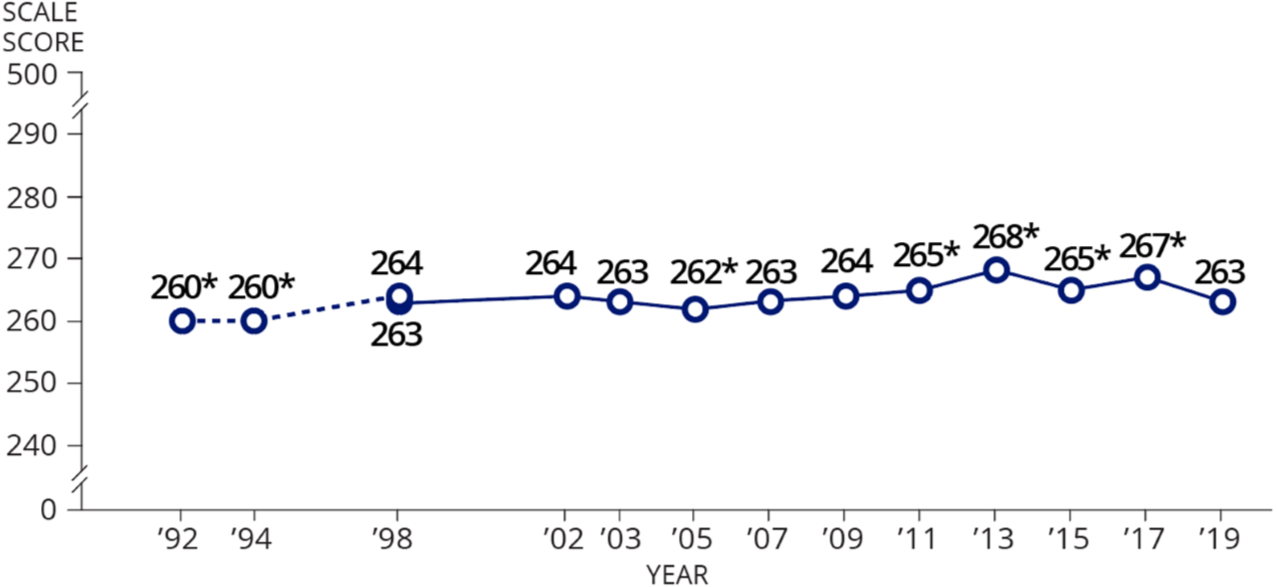
* Significantly different (p < .05) from 2019

--- Accommodations not permitted

— Accommodations permitted


In 4th-grade mathematics, the average scale score in 2019 was 241, one point higher than in 2017 (figure 3). In 8th-grade mathematics, the average scale score in 2019 was 282, one point lower than in 2017 (figure 4). Like reading, average scale scores for mathematics at both grades in 2019 were not significantly different than in 2009. Mathematics scale scores for both grade were higher in 2019 than in 1990, the first time the mathematics assessments were administered.


Figure 3. Average National Assessment of Educational Progress (NAEP) mathematics scale scores of 4th-grade students: Selected years, 1990–2019
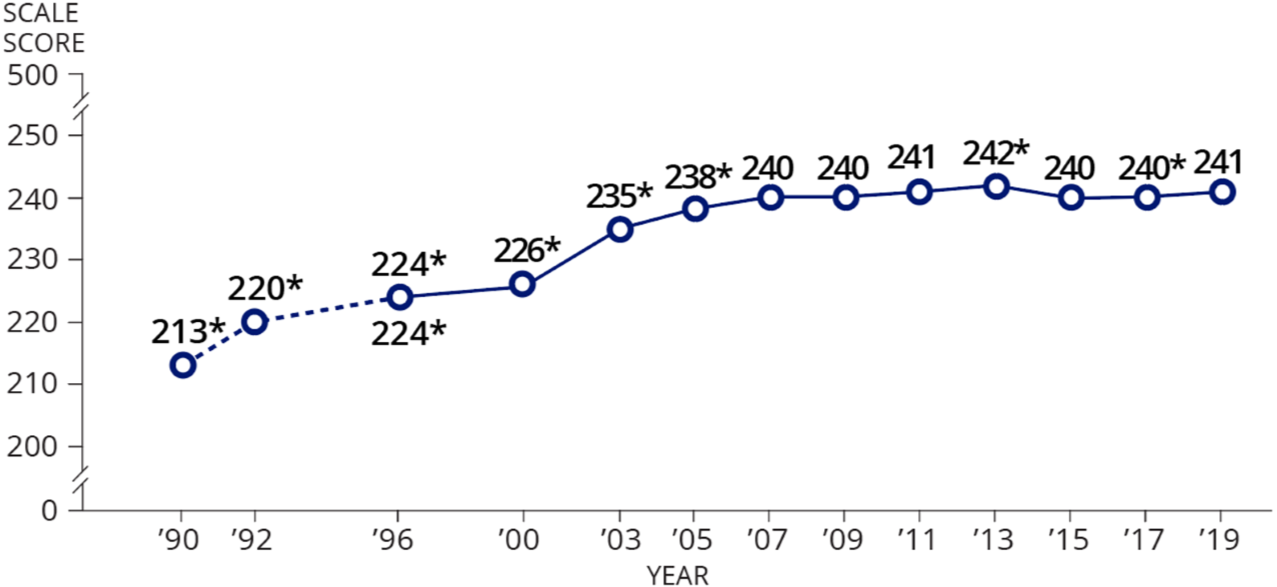
* Significantly different (p < .05) from 2019

--- Accommodations not permitted

— Accommodations permitted


Figure 4. Average National Assessment of Educational Progress (NAEP) mathematics scale scores of 8th-grade students: Selected years, 1990–2019
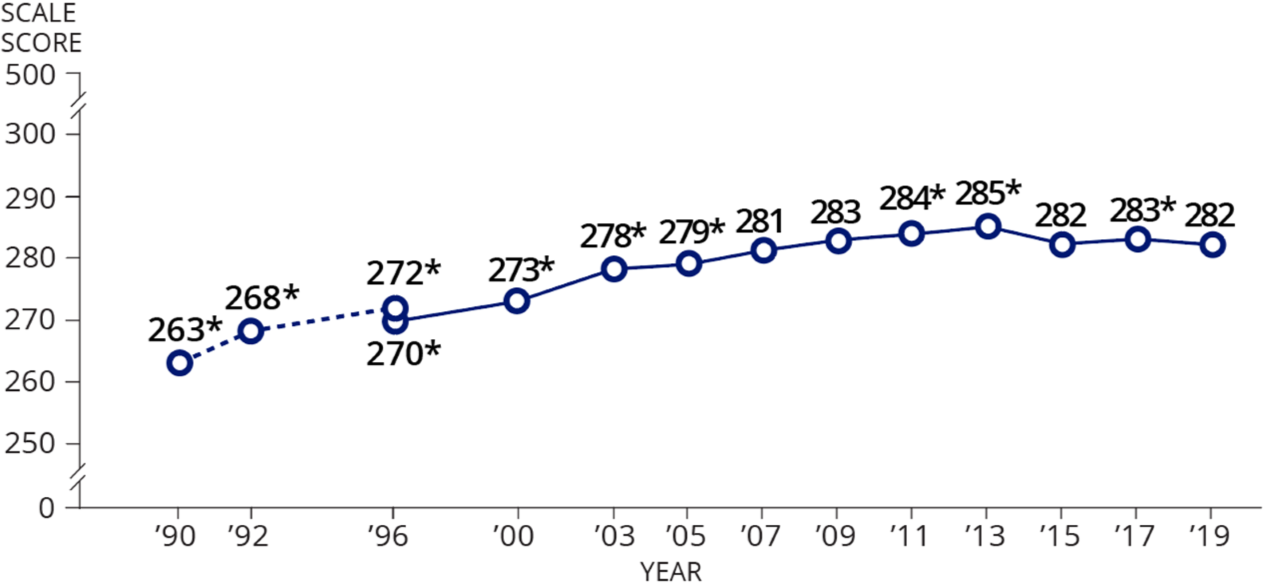
* Significantly different (p < .05) from 2019

--- Accommodations not permitted

— Accommodations permitted


The Nation’s Report Card also presents data by different demographic groups—such as race/ethnicity—gender, school type, and region. White and Black 4th- and 8th-grade students scored lower in reading in 2019 than in 2017. Hispanic and American Indian/Alaska Native 8th-grade students also scored lower in reading in 2019 than in 2017. In mathematics, 4th-grade Hispanic students scored higher in 2019 than in 2017, and 8th-grade American Indian/Alaska Native students scored lower in 2019 than in 2017. From 2017 to 2019, males’ scores increased in mathematics at grade 4 but decreased in reading at both grades.

NCES administered the 2019 NAEP mathematics and reading assessments to almost 600,000 4th- and 8th-graders in public and private schools in all 50 states, the District of Columbia, the U.S. Department of Defense schools, and 27 urban districts. Samples of schools and students are drawn from each state and from the District of Columbia and Department of Defense schools.

Visit https://nces.ed.gov/nationsreportcard/ to view the report.

New Data Tell the Story of Public and Private Schools and Their Leaders

Which schools would you guess, on average, spend more instructional time on English, reading, and language arts—public schools or private schools? How about on mathematics?

These questions and many others are answered in recently released reports on U.S. public and private schools and principals. The data in these reports are from the 2017–18 National Teacher and Principal Survey (NTPS), which is administered by the National Center for Education Statistics (NCES). NTPS previously collected data from public schools, principals, and teachers during the 2015–16 school year, but this is the first private school collection since the 2011–12 school year. (The latest NTPS data on public and private school teachers will be released later this year.)

The NTPS collects data about principals’ educational backgrounds and goals, as well as the climate of their schools and other general information about their schools and special programs and services provided. These data serve as a resource for researchers, policymakers, and the general public who are interested in understanding the current experiences and conditions of U.S. public and private schools.

The 2017–18 NTPS featured several new topic areas, such as the following:

  • School instruction time. Overall, schools reported that third-graders spent a weekly average of 500 minutes on instruction in English, reading, and language arts; 350 minutes on instruction in arithmetic or mathematics; and 170 minutes each on instruction in science and social studies or history. Here are some data to answer the questions from the beginning of this post:
    • Public schools reported that third-graders spent a weekly average of 540 minutes on instruction in English, reading, and language arts; 370 minutes on instruction in arithmetic or mathematics; 170 minutes on instruction in science; and 160 minutes on instruction in social studies or history.
    • Private schools reported that third-graders spent a weekly average of 400 minutes on instruction in English, reading, and language arts; 280 minutes on instruction in arithmetic or mathematics; and 170 minutes each on instruction in science and social studies or history.
       

Figure 1. Average minutes reported by public and private schools that third-grade students spend on selected subjects per week: 2017–18

NOTE: Schools that reported 0 minutes per week for a subject were excluded from the calculations of average minutes per week.
SOURCE: U.S. Department of Education, National Center for Education Statistics, National Teacher and Principal Survey (NTPS), “Public School and Private School Documentation Data Files,” 2017–18. Please see Characteristics of Public and Private Elementary and Secondary Schools in the United States: Results From the 2017–18 National Teacher and Principal Survey First Look, table 7.


  • ​Principals’ professional development. Overall, 83 percent of all principals reported participating in any professional development activities in the 2016–17 school year. Specifically, 85 percent of public school principals and 77 percent of private school principals reported doing so.
  • Evaluation of principals. Among public school principals, relatively more principals in traditional public schools were evaluated during the last school year than were principals in public charter schools (79 and 69 percent, respectively). Relatively more private school principals in Catholic and nonsectarian schools (63 and 58 percent, respectively) were evaluated during the last school year than were principals in other religious schools (41 percent).

Data files for the 2017–18 school and principal questionnaires will be released later this year. In order to protect the identities of responding schools and principals, researchers must apply for a restricted-use license to access the full restricted-use data files. Data will also be available through NCES’ online data tool, DataLab, where users can create custom tables and regressions without a restricted-use license.


By Maura Spiegelman

Inequity Persists in Gifted Programs

The National Center for Research on Gifted Education (NCRGE) at the University of Connecticut, in Phase I of a rigorous research agenda, examined how academically-gifted students are identified and served in three states in order to provide systematic information for the field. The research team focused especially on the representation of historically underserved groups in gifted education.

NCER recently spoke with the Center’s Principal Investigator, Del Siegle, a nationally-recognized expert on gifted education. 

What is the biggest challenge facing gifted educators today?

Unfortunately, many of our nation’s brightest students from underserved populations (e.g., Black, Hispanic, English Learner, and/or free and reduced-price lunch eligible) are not being identified as gifted and do not receive gifted education services. About 80% of states that completed the most recent National Association for Gifted Children’s State of the States survey indicated that underrepresentation of students from underserved populations was an important or very important issue in their state.

What did you find in your study of identification of underserved students for gifted programs?

During Phase I of our work, we analyzed standardized student achievement test data from three states that mandate gifted identification and programming. We found that schools were less likely to identify students from underserved groups as gifted—even in cases where the underserved child had similar achievement test scores. For example, students with similar test scores who received free and reduced price lunch were less than half as likely to be identified as gifted as students who didn’t receive free or reduced price lunch.

What identification practices are schools using?

Cognitive tests and teacher nominations were the most common identification tools across the three states we studied. The majority (90% to 96%) of the districts in all three states used these practices to select students. Identification for gifted services occurs most often in third grade. Districts seldom reassess identified students once they are identified and only about half reassess non-identified students in elementary schools at regular intervals. Screening all children and using a variety of identification criteria showed promise for reducing under-identification in one of our states.

How are students being serviced in gifted programs?

In the three states we studied, schools primarily focused on critical thinking and creativity followed by communication skills, research skills, and self-directed projects.  Mathematics and reading language arts acceleration was much less of a focus and were ranked among the bottom third of focus areas. Gifted students seldom receive gifted programming in core academic areas. Only 29% of the schools provided a separate gifted curriculum in reading/language arts. Only 24% of the schools had a separate gifted curriculum in mathematics. Gifted students spent 5 hours or more each week in regular education mathematics and reading/language arts classrooms. Of the 74% of schools reporting using pull-out services, only 32% offered separate gifted curriculum in reading/language arts and 28% offered separate gifted curriculum in math. 

What about gifted student growth in mathematics and reading?

In 3rd grade, gifted students are approximately 2 grade levels ahead of students not identified as gifted, but gifted students grow more slowly than non-gifted students between 3rd and 5th grade. Most grouping arrangements for gifted students had no impact on the growth of academic achievement. We believe much of this has to do with the limited advanced mathematics and reading instruction gifted students receive in their classrooms and gifted programs.

What is the next step in your research?

We are examining the effect of attending dedicated gifted classes in core content areas on academic achievement in reading/language arts and mathematics in a large, ethnically, economically, and linguistically diverse urban school district. Our research will compare the reading/language arts and mathematics achievement of gifted students in three different settings: schools offering a full-time gifted-only program with gifted classes in all subject areas, schools offering a part-time gifted-only program with gifted classes in mathematics, and schools offering a part-time gifted-only program with gifted classes in reading/language arts.