May is Asian American and Pacific Islander Heritage Month, which celebrates the achievements of Asian/Pacific Islander Americans and immigrants and the many ways they have contributed to the United States.
In honor of Asian and Native Hawaiian/Pacific Islander1 educators who help students learn every day, here are some selected facts and figures from the 2017–18 National Teacher and Principal Survey (NTPS). The NTPS collects data about public and private K–12 schools in the United States from the perspective of the teachers and principals who staff them. These data were collected in 2017–18, prior to the coronavirus pandemic.
Composition of U.S. K–12 Public and Private Schools: 2017–18
- Although Native Hawaiian/Pacific Islander teachers and principals are important members of school communities, they comprise a relatively small percentage of public and private school educators overall. Less than 1 percent of either public or private school teachers (0.2 and 0.1 percent,2 respectively) and principals (0.2 percent and 0.3 percent,3 respectively) were Native Hawaiian/Pacific islander.
Figure 1. Percentage distribution of all teachers and principals who are Asian and Native Hawaiian/Pacific Islander, by school type: 2017–18
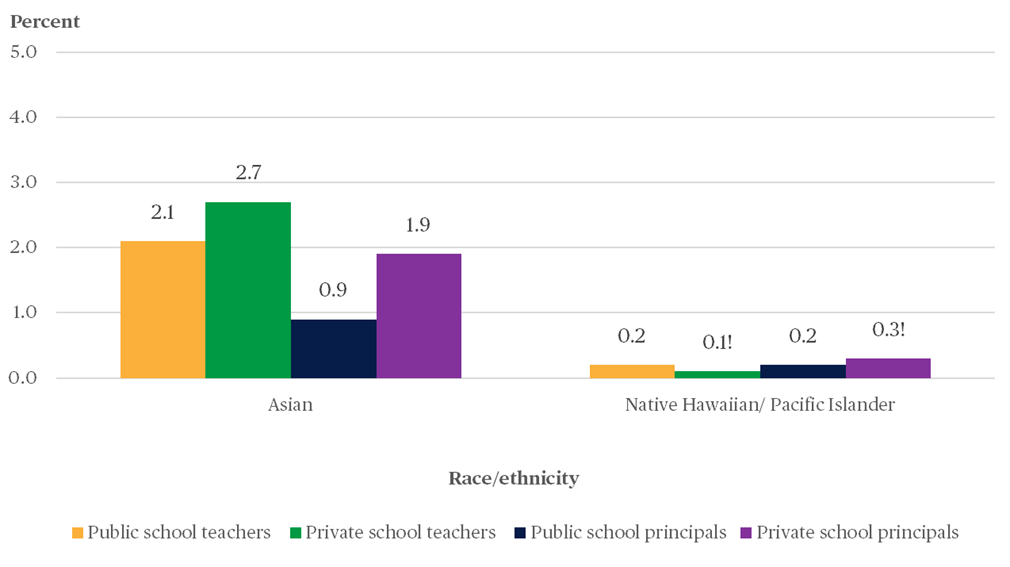
! Interpret data with caution. The coefficient of variation (CV) for this estimate is between 30 and 50 percent.
NOTE: Race categories exclude persons of Hispanic ethnicity.
SOURCE: U.S. Department of Education, National Center for Education Statistics, National Teacher and Principal Survey (NTPS), "Public School Teacher and Private School Teacher Data File, Public School Principal and Private School Principal Data File," 2017–18
Community and K–12 School Characteristics: 2017–18
- A higher percentage of Asian teachers worked in city schools than in most other community types (i.e., suburb, town, and rural) in 2017–18. There were some differences by school type (i.e., public vs. private).4 For example, teacher employment patterns in both school types were similar at rural schools and city schools but different at suburban schools.
- Higher percentages of Asian teachers worked in both public and private city schools (3.1 and 3.8 percent, respectively) than in public and private rural schools (0.5 and 0.8 percent, respectively) (figure 2).
- Although a lower percentage of Asian private school teachers worked in suburban schools (2.3 percent) than in city schools (3.8 percent), there was no significant difference in the percentage of Asian public school teachers who worked in suburban versus city schools.
Figure 2. Percentage distribution of all teachers who are Asian and Native Hawaiian/Pacific Islander, by school type and community type: 2017–18
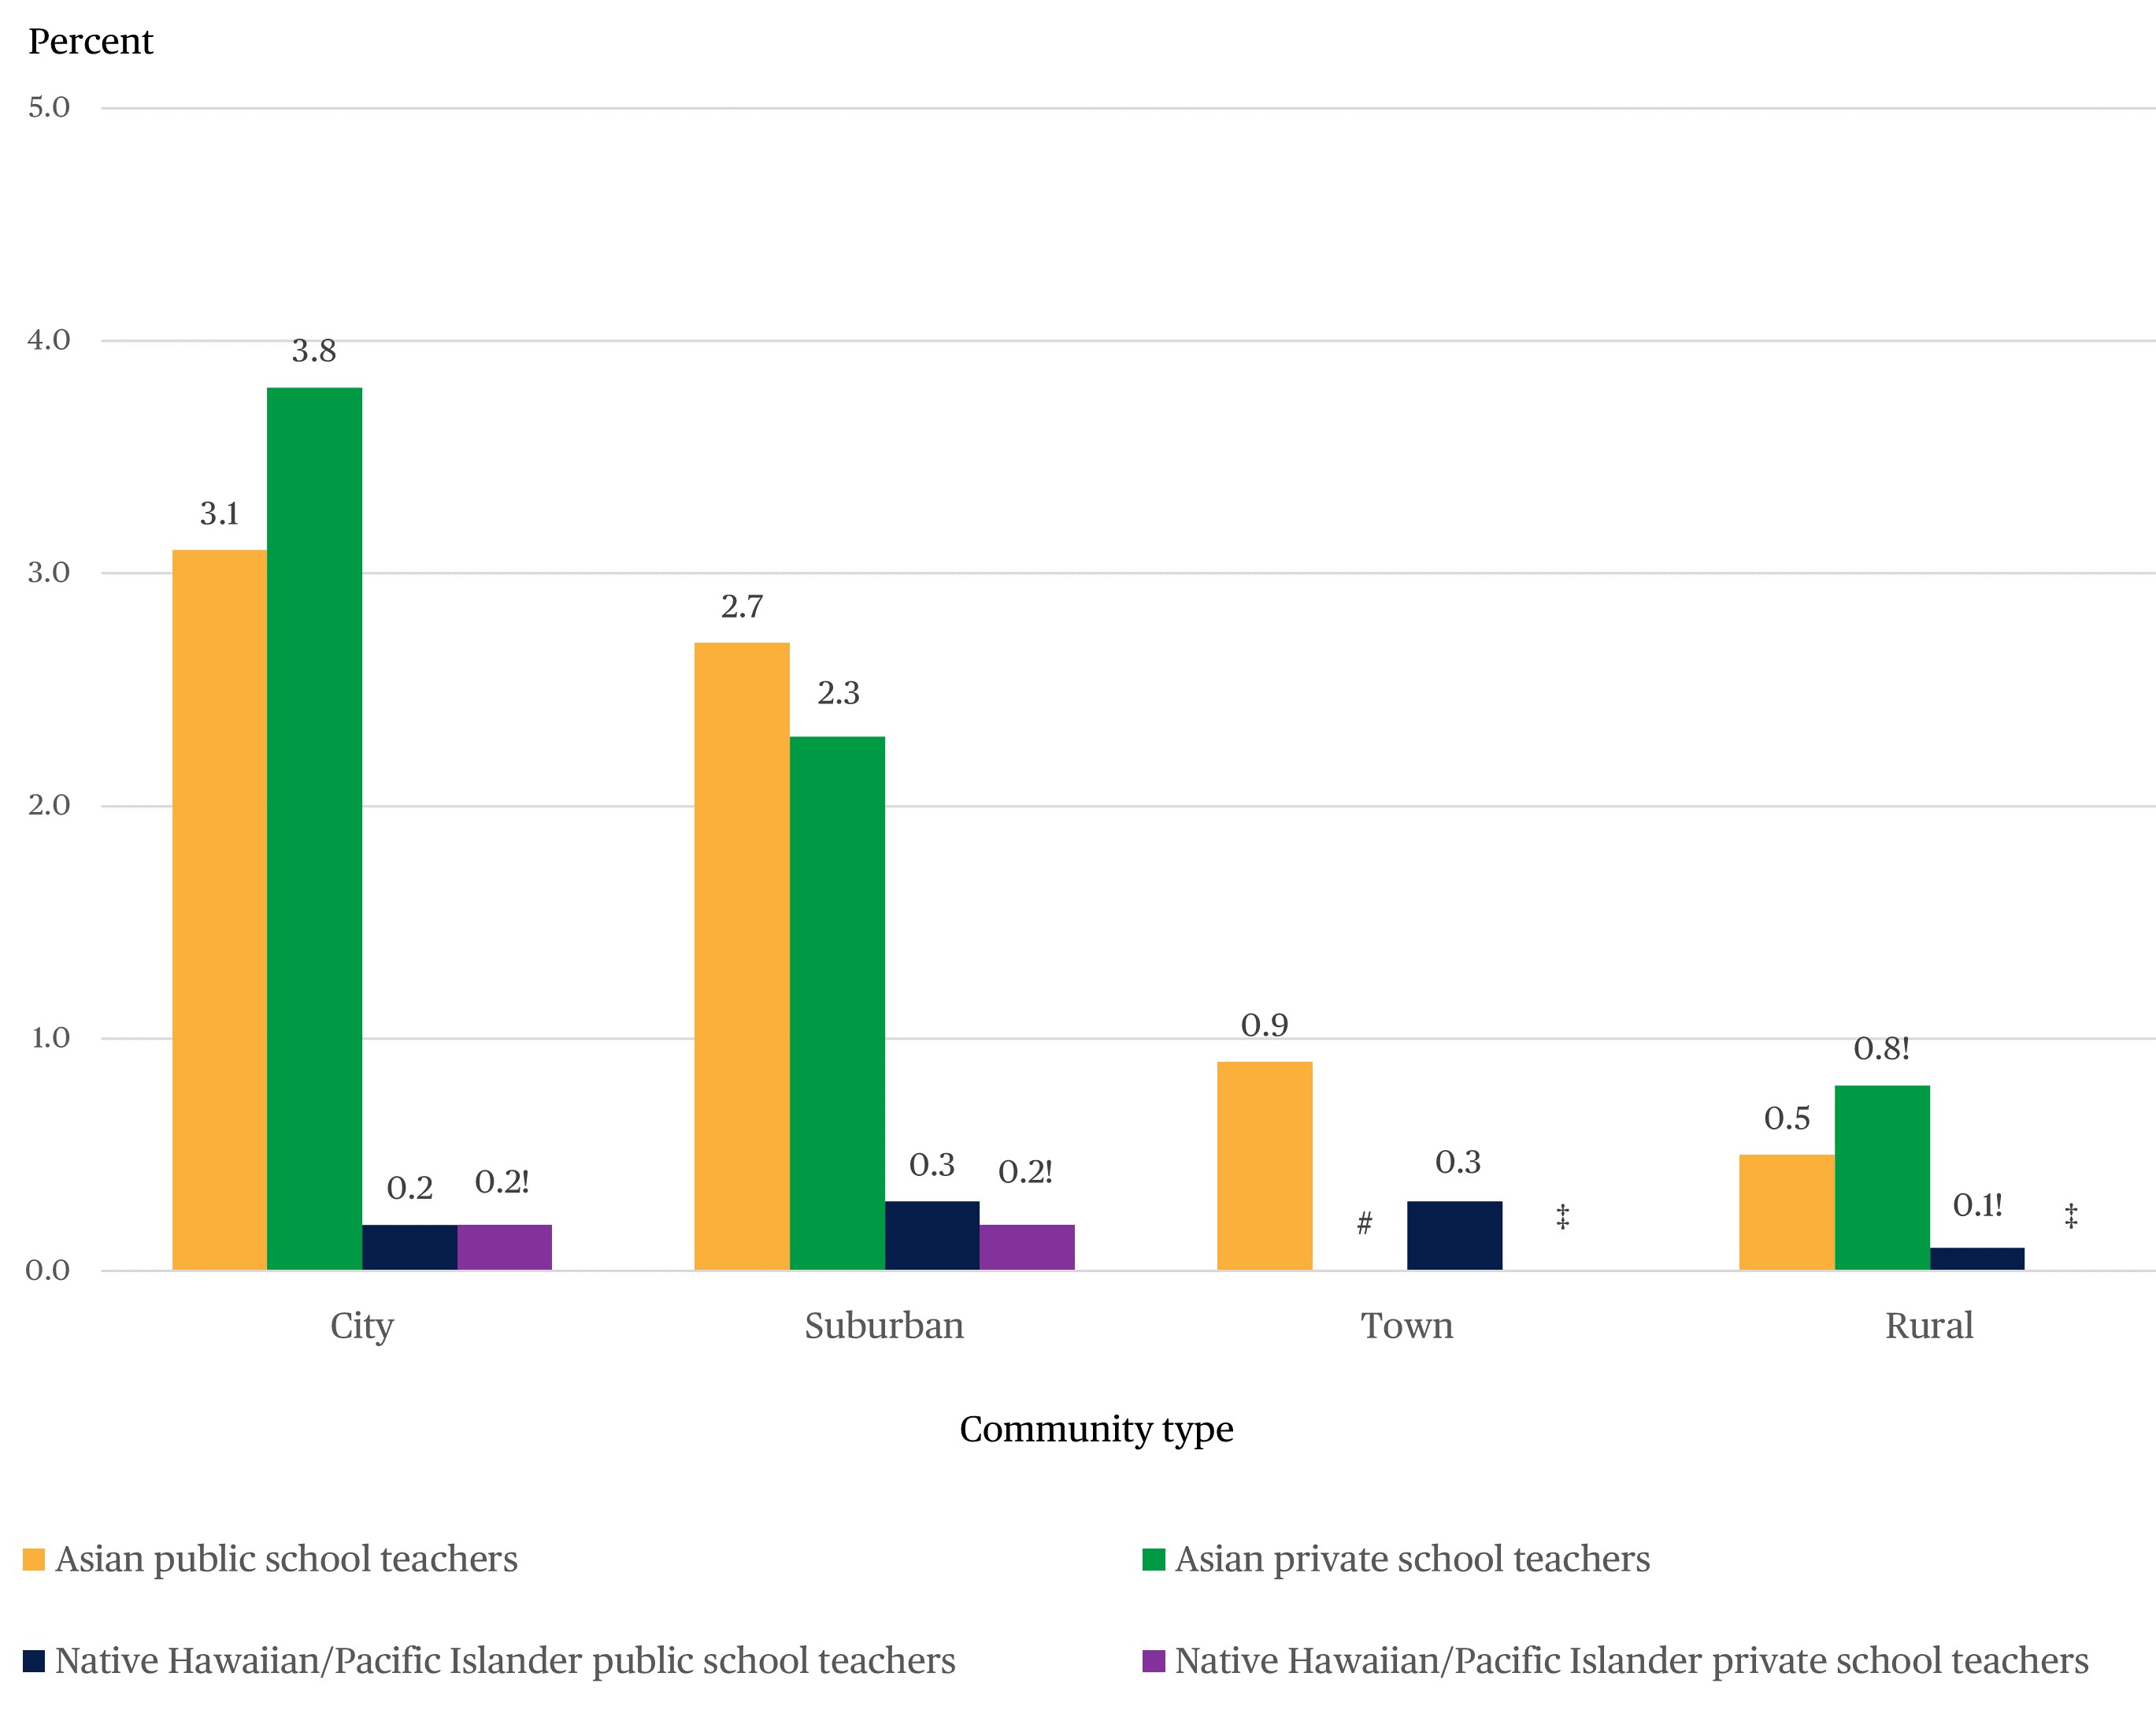
# Rounds to zero
! Interpret data with caution. The coefficient of variation (CV) for this estimate is between 30 and 50 percent.
‡ Reporting standards not met. The coefficient of variation (CV) for this estimate is 50 percent or greater (i.e., the standard error is 50 percent or more of the estimate) or the response rate is below 50 percent.
NOTE: Race categories exclude persons of Hispanic ethnicity.
SOURCE: U.S. Department of Education, National Center for Education Statistics, National Teacher and Principal Survey (NTPS), "Public School Teacher and Private School Teacher Data File," 2017–18
In honor of Asian American and Pacific Islander Heritage Month, NCES would like to thank Asian and Pacific Islander educators nationwide who play vital roles in our education system.
The data in this blog would not be possible without the participation of teachers, principals, and school staff in the NTPS. We are currently conducting the 2020–21 NTPS to learn more about teaching experiences during the pandemic. If you were contacted about participating in the 2020–21 NTPS and have questions, please email ntps@census.gov or call 1-888-595-1338.
For more information about the National Teacher and Principal Survey (NTPS), please visit https://nces.ed.gov/surveys/ntps/. More findings and details are available in the NTPS school, teacher, and principal reports.
[1] The NTPS definition of “Asian American or Native Hawaiian/Pacific Islander” is synonymous with the Library of Congress’ term “Asian/Pacific Islander.” The Library of Congress, one of the sponsors of the heritage month, states that Asian/Pacific encompasses all of the Asian continent and the Pacific islands of Melanesia (New Guinea, New Caledonia, Vanuatu, Fiji and the Solomon Islands), Micronesia (Marianas, Guam, Wake Island, Palau, Marshall Islands, Kiribati, Nauru and the Federated States of Micronesia) and Polynesia (New Zealand, Hawaiian Islands, Rotuma, Midway Islands, Samoa, American Samoa, Tonga, Tuvalu, Cook Islands, French Polynesia and Easter Island). Note that the Hawaiian Islands are included as “Pacific islands” in their definition but are named independently in the NTPS definition, and that only Asian or Native Hawaiian/Pacific Islander respondents who also indicated that they were not Hispanic, which includes Latino, are included in this definition.
[2] Interpret data with caution. The coefficient of variation (CV) for this estimate is between 30 percent and 50 percent (i.e., the standard error is at least 30 percent and less than 50 percent of the estimate).
[3] Interpret data with caution. The coefficient of variation (CV) for this estimate is between 30 percent and 50 percent (i.e., the standard error is at least 30 percent and less than 50 percent of the estimate).
[4] Given the size of the Native Hawaiian/Pacific Islander teacher and principal populations in the NTPS, granular differences about where Native Hawaiian/Pacific Islander teachers and principals were more often employed is difficult to produce from a sample survey because of sample sizes.
By Julia Merlin, NCES