IES Blog

Institute of Education Sciences

Revenues and Expenditures for Public Schools Rebound for Third Consecutive Year in School Year 2015–16

Revenues and expenditures per pupil on elementary and secondary education increased in school year 2015–16 (fiscal year [FY] 2016), continuing a recent upward trend in the amount of money spent on public preK–12 education. This is the third consecutive year that per pupil revenues and expenditures have increased, reversing three consecutive years of declines in spending between FY 10 and FY 13 after adjusting for inflation. The findings come from the recently released Revenues and Expenditures for Public Elementary and Secondary School Districts: School Year 2015–16 (Fiscal Year 2016).


The national median of total revenues across all school districts was $12,953 per pupil in FY 16, reflecting an increase of 3.2 percent from FY 15, after adjusting for inflation.[1] This increase in revenues per pupil follows an increase of 2.0 percent for FY 15 and 1.6 percent for FY 14. These increases in revenues per pupil between FY 14 and FY 16 contrast with the decreases from FY 10 to FY 13. The national median of current expenditures per pupil was $10,881 in FY 16, reflecting an increase of 2.4 percent from FY 15. Current expenditures per pupil also increased in FY 15 (1.7 percent) and FY 14 (1.0 percent). These increases in median revenues and current expenditures per pupil between FY 14 and FY 16 represent a full recovery in education spending following the decreases from FY 10 to FY 13.

The school district finance data can help us understand differences in funding levels for various types of districts. For example, median current expenditures per pupil in independent charter school districts were lower than in noncharter and mixed charter/noncharter school districts in 21 out of the 25 states that were able to report finance data for independent charter school districts. Three of the 4 states where median current expenditures were higher for independent charter school districts had policies that affected charter school spending. The new School District Finance Survey (F-33) data offer researchers extensive opportunities to investigate local patterns of revenues and expenditures and how they relate to conditions for other districts across the country.


By Stephen Q. Cornman, NCES; Malia Howell, Stephen Wheeler, and Osei Ampadu, U.S. Census Bureau; and Lei Zhou, Activate Research


[1] In order to compare from one year to the next, revenues are converted to constant dollars, which adjusts figures for inflation. Inflation adjustments use the Consumer Price Index (CPI) published by the U.S. Department of Labor, Bureau of Labor Statistics. For comparability to fiscal education data, NCES adjusts the CPI from a calendar year basis to a school fiscal year basis (July through June). See Digest of Education Statistics 2016, table 106.70, https://nces.ed.gov/programs/digest/d16/tables/dt16_106.70.asp.

A Look at How Title I Funds Are Allocated in the U.S.

More than 50 years ago, Congress established Title I, Part A funding (generally just called Title I) to support school districts in educating the nation’s economically disadvantaged students. Today, billions of dollars in Title I funding are distributed to school districts across the country through four grants, using a complex set of formulas.

A new report from the National Center for Education Statistics (NCES) provides a look at how Title I funds are allocated and how the current formulas affect school districts of various sizes, socioeconomic status, and geographic locales, such as rural or urban. The Study of the Title I, Part A Grant Program Mathematical Formulas was conducted in response to a congressional mandate under the Every Student Succeeds Act (ESSA), which was passed in 2015.

In fiscal year 2015 (FY 15), the total Title I allocation per formula-eligible child in the United States was $1,227.[1],[2] However, states varied in their total Title I final allocation per formula-eligible child, ranging from $984 in Idaho to $2,590 in Vermont, a difference of $1,606. (NOTE: A child is "formula eligible" if he or she is ages 5–17 and living in a family below the national poverty level or one that is receiving Temporary Assistance for Needy Families [TANF], a neglected and delinquent child located in a locally funded institution, or a foster child.)

Total Title I allocations per formula-eligible child also differed by geographic locale, district poverty level, and district size:

  • The locales with the highest total Title I final allocations were the most densely and least densely populated areas: large cities ($1,466) and remote rural areas ($1,313);
  • The poorest districts (i.e., those in the highest poverty quarter) had the highest total Title I allocations ($1,381), and the least-poor districts (i.e., those in the lowest poverty quarter) had the lowest total Title I allocations ($1,023); and
  • The smallest districts (those with a 5- to 17-year-old population of less than 300) had the highest total Title I final allocation ($1,442) compared with districts of all other population sizes. The largest districts (those with a population of 25,000 or more) had the second-highest allocation ($1,323). The allocation was lowest ($1,107) for districts with a population of 5,000 to 9,999.  


Because each of the federal allocation formulas use a series of provisions, there is not a direct link between the percentage of formula-eligible children in a district or state and the percentage of federal funds allocated to that district or state. It is also important to note that there is no direct link between the formula-eligible children upon whom the distribution of funds is based and the children who receive services from Title I. Today, 95 percent of children served by Title I receive services in schoolwide programs that serve all children in the school, regardless of whether they are formula eligible or not. Altogether, about 11.6 million children are counted as formula eligible in the United States, but more than twice that amount (about 25 million students) receive Title I services.

The 250-page report includes a number of other findings, including

  • An overview of the Title I funding formula process;
  • Detailed analyses for each of the grant programs (Basic, Concentration, Targeted, and Education Finance Incentive Grants);
  • Alternative analyses that isolate components of each grant program;
  • American Community Survey-Comparable Wage Index (CWI) adjusted allocations; and
  • A table of Title I, Part A total allocations by grant type and school district.

To access the full report, please visit the NCES website at https://nces.ed.gov/pubs2019/titlei/.


By Tom Snyder and Rachel Dinkes


[1] The analytic metric used in the report is the amount of funding allocated for the designated Title I grant divided by the number of formula-eligible children used in the computation for that specific grant.

[2] Detailed information on the Title I formula grant process and the components of the mathematical formulas can be found in the report’s introduction.

New Report on Crime and Safety in Schools and College Campuses

Crime in the nation’s schools and college campuses has declined overall during the past two decades, according to a report released on April 17, 2019. Indicators of School Crime and Safety 2018 highlights new information on a wide array of data points, including youth opioid use, perceptions of bullying, and active shooter incidents in educational settings. The report also covers topics such as victimization, school conditions, school environment, safety and security measures at school, and criminal incidents at postsecondary institutions.

In 2017, students ages 12–18 experienced 827,000 total victimizations (i.e., theft and nonfatal violent victimization) at school and 503,800 total victimizations away from school. These figures represent a rate of 33 victimizations per 1,000 students at school, compared to 20 victimizations per 1,000 students away from school. From 1992 to 2017, the total victimization rate and rates of specific crimes—thefts, violent victimizations, and serious violent victimizations—declined for students ages 12–18, both at school and away from school.

This edition of Indicators of School Crime and Safety includes an analysis of active shooter incidents, which represent a small subset of the possible violent incidents that occur at schools. While rare, these events are of high concern to all those interested in the safety of our nation’s students. From 2000 to 2017, there were 37 active shooter incidents at elementary and secondary schools and 15 active shooter incidents at postsecondary institutions. During this period, there were 153 casualties (67 killed and 86 wounded) in active shooter incidents at elementary and secondary schools, and 143 casualties (70 killed and 73 wounded) in active shooter incidents at postsecondary institutions.

Between July 1, 2015 and June 30, 2016, the most recent period available, there were 18 homicides of school-age youth (ages 5–18) at a school out of the 1,478 homicides of school-age youth in the United States. During the same period, 3 of the 1,941 total suicides of school-age youth occurred at school.

In 2017, about 20 percent of students ages 12–18 reported being bullied at school during the school year. Between 2005 and 2017, the percentage of students who reported being bullied at school declined overall and for most of the student and school characteristics examined.


Of the students who were bullied in 2017, about 56 percent felt that those who had bullied them had the ability to influence what other students thought of them. A higher percentage of female students (62 percent) than male students (48 percent) reported that those who bullied them had the ability to influence what other students thought of them.


The new report included a special analysis that shows that the percentage of 8th-graders who reported using heroin during the past 12 months decreased from 1.4 percent in 1995 to 0.3 percent in 2017. The percentage also decreased from 1.1 to 0.2 percent for 10th-graders and from 1.1 to 0.4 percent for 12th-graders during the same period. This 0.4 percent of 12th graders reflects 15,900 students, who were recent users of heroin. The use of OxyContin and Vicodin during the past 12 months also generally decreased for 8th-, 10th-, and 12th-graders between 2005 (the first year of data collection for these survey items) and 2017.


There were also decreases for other types of substance abuse. The percentage of students in grades 9–12 who reported using alcohol at least once during the previous 30 days decreased from 47 to 30 percent between 2001 and 2017. Also, the percentage of students in grades 9–12 reporting marijuana use at least 1 time during the previous 30 days in 2017 (20 percent) was lower than the percentage for 2001 (24 percent).

Other findings – elementary and secondary schools

  • About 99 percent of students ages 12–18 reported that they observed the use of at least one of the selected safety and security measures at their schools in 2017. The three most commonly observed safety and security measures were a written code of student conduct (95 percent), a requirement that visitors sign in and wear visitor badges or stickers (90 percent), and the presence of school staff (other than security guards or assigned police officers) or other adults supervising the hallway (88 percent).
  • About 6 percent of students ages 12–18 reported being called hate-related words at school during the school year in 2017, representing a decrease from 12 percent in 2001. This percentage also decreased between 2001 and 2017 for male and female students as well as for White, Black, and Hispanic students.
  • The percentage of students in grades 9–12 who reported having been in a physical fight anywhere in the previous 12 months decreased between 2001 and 2017 (from 33 to 24 percent), as did the percentage of students in these grades who reported having been in a physical fight on school property (from 13 to 9 percent).


Other findings – postsecondary Institutions

  • The number of on-campus crimes reported in 2016 was lower than the number reported in 2001 for every category except forcible sex offenses and negligent manslaughter offenses. The number of reported forcible sex crimes on campus increased from 2,200 in 2001 to 8,900 in 2016 (a 305 percent increase).
  • Race, religion, and sexual orientation were the categories of motivating bias most frequently associated with the 1,070 hate crimes reported on college campuses in 2016.

To view the full report, please visit https://nces.ed.gov/pubsearch/pubsinfo.asp?pubid=2019047.

New Data Available on Prevalence of Recognized Student Acceptance Groups

Schools can help to foster students’ understanding of diversity and create environments where students feel safe and welcome. One way to do this is by organizing student groups whose purpose is to promote acceptance of other students. The School Survey on Crime and Safety (SSOCS) collected data on the presence of recognized student acceptance groups during the 2015–16 school year from a nationally representative sample of 3,500 K–12 public schools. The questionnaire asked whether schools had student groups that promote acceptance of students’ sexual orientations[i] and gender identities,[ii] of students with disabilities, and of cultural diversity.

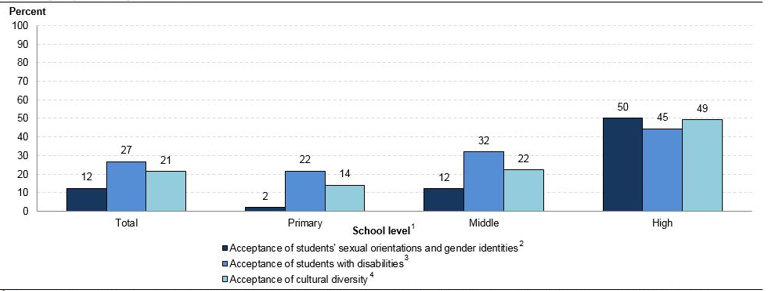
Among all public schools, groups that promote acceptance of students with disabilities were most common. Some 27 percent of schools reported having a student group that promotes acceptance of students with disabilities during the 2015­–16 school year, compared with 21 percent that reported having a student group that promotes acceptance of cultural diversity and 12 percent that reported having a student group that promotes acceptance of students’ sexual orientations and gender identities.


Figure 1. Percentage of public schools reporting the presence of recognized student acceptance groups, by school level and purpose of student group: School year 2015–16

1Primary schools are defined as schools in which the lowest grade is not higher than grade 3 and the highest grade is not higher than grade 8. Middle schools are defined as schools in which the lowest grade is not lower than grade 4 and the highest grade is not higher than grade 9. High schools are defined as schools in which the lowest grade is not lower than grade 9 and the highest grade is not higher than grade 12. The total also includes combined schools. Combined schools are schools that have a combination of grades that cannot be categorized as primary, middle, or high schools, including K–12 schools. 
2Sexual orientation was defined for respondents as one’s emotional or physical attraction to the same and/or opposite sex. Gender identity was defined for respondents as one’s inner sense of one’s own gender, which may or may not match the sex assigned at birth. Different people choose to express their gender identity differently. For some, gender may be expressed through, for example, dress, grooming, mannerisms, speech patterns, and social interactions. Gender expression usually ranges between masculine and feminine, and some transgender people express their gender consistent with how they identify internally, rather than in accordance with the sex they were assigned at birth. An example of a student group to promote acceptance of students' sexual orientations and gender identities provided to respondents was a Gay-Straight Alliance.
3An example of a student group to promote acceptance of students with disabilities provided to respondents was Best Buddies.
4An example of a student group to promote acceptance of cultural diversity provided to respondents was a Cultural Awareness Club.
NOTE: Responses were provided by the principal or the person most knowledgeable about school crime and policies to provide a safe environment. Although rounded numbers are displayed, the figures are based on unrounded data. 
SOURCE: U.S. Department of Education, National Center for Education Statistics (NCES), 2015–16 School Survey on Crime and Safety (SSOCS), 2016. See table 37.


All three types of acceptance groups were more common in high schools than in middle or primary schools. The most common type of student acceptance group varied by school level. For example, among middle schools, the percentage of schools that reported having a student group that promotes acceptance of students with disabilities (32 percent) was higher than the percentage that reported having a student group that promotes acceptance of cultural diversity (22 percent) or acceptance of students’ sexual orientations and gender identities (12 percent). This pattern was similar for primary schools. Among high schools, the percentage of schools that reported having a student group that promotes acceptance of students’ sexual orientations and gender identities (50 percent) was higher than the percentage that reported having a student group that promotes acceptance of students with disabilities (45 percent).

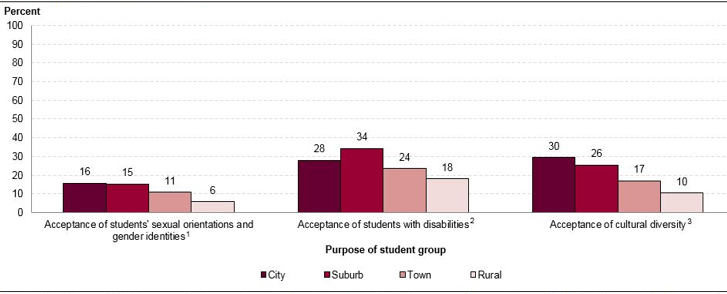
During the 2015–16 school year, all three types of student acceptance groups were more commonly found in schools in cities and suburbs than in schools in rural areas. For example, 30 percent of schools in cities and 26 percent of schools in suburbs reported having a student group that promotes acceptance of cultural diversity, compared with 10 percent of schools in rural areas.


Figure 2. Percentage of public schools reporting the presence of recognized student acceptance groups, by purpose of student group and school locale: School year 2015–16

1Sexual orientation was defined for respondents as one's emotional or physical attraction to the same and/or opposite sex. Gender identity was defined for respondents as one's inner sense of one's own gender, which may or may not match the sex assigned at birth. Different people choose to express their gender identity differently. For some, gender may be expressed through, for example, dress, grooming, mannerisms, speech patterns, and social interactions. Gender expression usually ranges between masculine and feminine, and some transgender people express their gender consistent with how they identify internally, rather than in accordance with the sex they were assigned at birth. An example of a student group to promote acceptance of students' sexual orientations and gender identities provided to respondents was a Gay-Straight Alliance.
2An example of a student group to promote acceptance of students with disabilities provided to respondents was Best Buddies.
3An example of a student group to promote acceptance of cultural diversity provided to respondents was a Cultural Awareness Club.
NOTE: Responses were provided by the principal or the person most knowledgeable about school crime and policies to provide a safe environment.
SOURCE: U.S. Department of Education, National Center for Education Statistics (NCES), 2015–16 School Survey on Crime and Safety (SSOCS), 2016. See table 37.


You can find more information on school crime and safety in NCES publications, including Crime, Violence, Discipline, and Safety in U.S. Public Schools: Findings From the School Survey on Crime and Safety: 2015–16 and the 2017 Indicators of School Crime and Safety.


By Rachel Hansen, NCES, and Melissa Diliberti, AIR


[i]Sexual orientation was defined for respondents as one’s emotional or physical attraction to the same and/or opposite sex.

[ii]Gender identity was defined for respondents as one’s inner sense of one’s own gender, which may or may not match the sex assigned at birth. Different people choose to express their gender identity differently. For some, gender may be expressed through, for example, dress, grooming, mannerisms, speech patterns, and social interactions. Gender expression usually ranges between masculine and feminine, and some transgender people express their gender consistent with how they identify internally, rather than in accordance with the sex they were assigned at birth.

Learning about Schools from Teachers and Principals

In the 2015-16 school year, there were approximately 90,400 principals and 3,827,100 teachers in public elementary and secondary schools in the United States. Knowledge about the characteristics and experiences of these key school staff can help inform decisions about education.  The National Teacher and Principal Survey (NTPS) supports these decisions by providing data on a variety of topics from the perspective of teachers, principals and other school staff. Results from these questionnaires provide information such as:

  • Principals’ education. Among public schools, a majority of principals held a master’s degree (61 percent) as their highest degree, compared to an education specialist/professional diploma at least one year beyond the master’s level (27 percent), a doctorate/first professional degree (10 percent), or a bachelor’s degree or less (2 percent).
  • Hours worked by teachers. On average, regular full-time teachers in public schools spent 53 hours per week on all school-related activities. That includes 27 hours that they were paid to deliver instruction to students during a typical full week. Public school teachers were required to work an average of 38 hours per week to receive their base pay.
  • Online courses. Nationwide, about 21 percent of public schools offered at least one course entirely online. This was more common among public charter schools (29 percent) than it was among traditional public schools (20 percent). A greater percentage of high (58 percent) and combined (64 percent) schools offered one or more courses entirely online than all public schools. It was also more common for schools with fewer than 100 students (45 percent) and schools with 1,000 or more students (44 percent). Among schools offering online courses, relatively more public charter schools offered all of their classes online (14 percent) than traditional public schools (5 percent).

More examples of the type of information collected in the 2015-16 NTPS can be seen in the video below:

More information is available in the NTPS online table library. In addition, analysts can access the data using DataLab or obtain a restricted-use license to conduct their own analyses of NTPS restricted-use data files.


By Maura Spiegelman