IES Blog

Institute of Education Sciences

Changes in Children’s Nonparental Care Arrangements From 2001 to 2012

By Lauren Musu-Gillette

While the percentage of children in nonparental care arrangements remained unchanged between 2001 and 2012, the cost of those arrangements increased significantly. These findings come from a recently released report from NCES, The Years Before School: Children’s Nonparental Care Arrangements From 2001 to 2012. Childcare arrangements are influential in children’s early education, and can often be where children learn early literacy and numeracy skills that are important for kindergarten entry.[1]

While the percentage of children who participated in a nonparental care arrangement remained statistically unchanged from 2001 to 2012, there were shifts in the patterns of relative,[2] nonrelative,[3] and center-based care arrangements.[4] For instance, from 2001 to 2012, the percentage of children who had a relative care arrangement increased (from 22 percent to 26 percent) as did the percentage of children who had multiple arrangements (from 10 percent to 12 percent). In both 2001 and 2012, the greatest percentage of children participated in center-based care.


Percentage of children from birth to age 5 who are not yet in kindergarten, by type of nonparental care arrangement: 2001, 2005, and 2012

SOURCE: U.S. Department of Education, National Center for Education Statistics, National Household Education Surveys Program (NHES), Early Childhood Program Participation (ECPP) Survey, 2001, 2005, and 2012.


There were higher out-of-pocket hourly expenses for care in 2012 than in 2001 for children in all types of care arrangements. The expense for center-based care increased by 58 percent and that of relative care by 57 percent, while the expense for nonrelative care increased by 25 percent.


Percentage of children from birth to age 5 who are not yet in kindergarten, by type of weekly nonparental care arrangement and child’s age: 2001, 2005, and 2012

SOURCE: U.S. Department of Education, National Center for Education Statistics, National Household Education Surveys Program (NHES), Early Childhood Program Participation (ECPP) Survey, 2001, 2005, and 2012.


In 2012, out-of-pocket hourly expenses for children in center-based programs were the most expensive for families, averaging $6.70 per hour—60 percent higher than relative care ($4.18 per hour) and 27 percent higher than nonrelative care ($5.28 per hour).

Data used for this report come from the National Household Education Surveys Program (NHES) Early Childhood Program Participation Surveys (ECPP) collected every several years. This study is different from most NCES data collections in that it focuses on children before they enter formal schooling. In addition to collecting information on children’s early care and education arrangements, parents are also asked about early learning, such as how high the child can count and whether the child can recognize the letters of the alphabet. Learn more about the variables included in the study by visiting the website or accessing the First Look report.


[1] Flanagan, K.D., and McPhee, C. (2009). The Children Born in 2001 at Kindergarten Entry: First Findings From the Kindergarten Data Collections of the Early Childhood Longitudinal Study, Birth Cohort (ECLS-B) (NCES 2010-005). U.S. Department of Education. Washington, DC: Institute of Education Sciences, National Center for Education Statistics.

[2] Relative care: care provided by a relative (e.g., grandparent, aunt/uncle, brother/sister, or another relative) in either the child’s home or another home. Relative care does not include the child’s parents or guardians (e.g., a father or mother caring for the child).

[3] Nonrelative care: care provided by a nonrelative, either in the child’s home or another home. It includes care provided by home child care providers or neighbors, but not day care centers or preschools.

[4] Center-based care: care provided by day care centers, preschools, prekindergarten programs, Head Start programs, and other early childhood programs.


Get to Know NCES in Just Five Minutes!

By Lauren Musu-Gillette

Have you ever read one of our reports and wondered where the data came from? Are you familiar with NAEP, but have never heard of IPEDS? Are you curious about the history of NCES? If so, our new video is perfect for you!

The full scope of NCES activities can be daunting for those not familiar with the Center. Our data collections include samples from early childhood to postsecondary education, and cover such diverse topics as math and reading achievement, the experiences of teachers and principals, and school crime. In addition, the Center has a rich history both within the Department of Education and as a federal statistical agency. To make our data, reports, and tools more accessible to the public, we’ve created a new video to help introduce you to who we are and what we do.

To learn more about the Center’s work, watch the video below and follow us on Twitter and Facebook.

Provide Input on Proposed Changes to Statistical Standards for Federal Collection of Race and Ethnicity Data

By Jill Carlivati McCarroll and Tom Snyder

Each Federal agency is responsible for collecting and disseminating different types of data on topics of interest and importance to the American public. In order to look across data sources to get a more complete picture of any one topic, it is important that those datasets are comparable.

Federal agencies that collect and report race and ethnicity data use the Office of Management and Budget (OMB) Standards for Maintaining, Collecting, and Presenting Federal Data on Race and Ethnicity to promote uniformity and comparability.  The standards guide information collected and presented for the decennial census, household surveys, administrative forms (e.g., school registration and mortgage lending applications), and numerous other statistical collections, as well as for civil rights enforcement and program administrative reporting.

Periodically, these standards are reviewed. The Federal Interagency Working Group for Research on Race and Ethnicity has been tasked with reviewing the standards on race and ethnicity. A March 1st Federal Register Notice and associated interim report by the Working Group communicates the current status of this work and requests public feedback on the following four areas:


  1. The use of separate questions versus a combined question to measure race and Hispanic origin, and question phrasing as a solution to race/ethnicity question nonresponse;
  2. The classification of a Middle Eastern and North African (MENA) group and distinct reporting category;
  3. The description of the intended use of minimum reporting categories (e.g., requiring or encouraging more detailed reporting within each minimum reporting category); and
  4. The terminology used for race and ethnicity classifications and other language in the standard.


Additional details on each of these four areas are available in the full notice, posted on the regulations.gov website. All members of the public are encouraged to provide feedback on these topics.  OMB will use all the public comments, along with recommendations from the Federal Interagency Working Group, to determine if any proposed revisions to the standards are warranted. According to established practice, OMB plans to notify the public of its final decision, along with its rationale.

Comments on the Federal Register Notice are due by April 30, 2017 and can be submitted electronically to Race-Ethnicity@omb.eop.gov or via the Federal E-Government website. Comments may also be sent by mail to U.S. Chief Statistician, Office of Management and Budget, 1800 G St., 9th Floor, Washington, DC 20503. All public feedback will be considered by the Federal Interagency Working Group as they write their final report, which will be used by OMB as they decide on any possible revisions to the standards.  

Additional information on how federal agenices use race and ethnicity data as well as more a more detailed description of the potential changes to the current standards are available in this webinar:

Measuring the Achievement and Experiences of American Indian and Alaska Native Youth: National Indian Education Study 2015

By Lauren Musu-Gillette and James Deaton

In order to measure the progress of education in the United States, it is important to examine equity and growth for students from many different demographic groups. The educational experiences of American Indian and Alaska Native (AI/AN) youth are of particular interest to educators and policymakers because of the prevalence of academic risk factors for this group. For example, the percentage of students served under the Individuals with Disabilities Education Act (IDEA) in 2013-14 was highest for AI/AN students,[1] and in 2013 a higher percentage of American Indian/Alaska Native 8th-grade students than of Hispanic, White, or Asian 8th-grade students were absent more than 10 days in the last month.[2]  

Although NCES attempts to collect data from AI/AN students in all of our surveys, disaggregated data for this group are sometimes not reportable due to their relatively small population size. Therefore, data collections that specifically target this group of students can be particularly valuable in ensuring the educational research and policy community has the information they need. The National Indian Education Survey is one of the primary resources for data on AI/AN youth.

The National Indian Education Study (NIES) is administered as part of the National Assessment of Educational Progress (NAEP) to allow more in-depth reporting on the achievement and experiences of AI/AN students in grade 4 and 8. NIES provides data at the national level and for select states with relatively high percentages of American Indians and/or Alaska Natives.[3] It also provides data by the concentration of AI/AN students attending schools in three mutually exclusive categories: Low density public schools (less than 25 percent AI/AN);[4] High density public schools (more than 25 percent AI/AN);[5] and Bureau of Indian Education (BIE) schools.[6]

In a recently released report on the results of the 2015 NIES, differences in performance on the reading and mathematics assessments emerged across school type. In 2015, students in low density public schools had higher scores in both subjects than those in high density public or BIE schools, and scores for students in high density public schools were higher than for those in BIE schools. Additionally, there were some score differences over time. For example, at grade 8, average reading scores in 2015 for students in BIE schools were higher than scores in 2009 and 2007, but were not significantly different from scores in 2011 and 2005 (Figure 2). 


* Significantly different (p < .05) from 2015.
NOTE: AI/AN = American Indian/Alaska Native. BIE = Bureau of Indian Education. School density indicates the proportion of AI/AN students enrolled. Low density public schools have less than 25 percent AI/AN students. High density public schools have 25 percent or more. All AI/AN students (public) includes only students in public and BIE schools. Performance results are not available for BIE schools at fourth grade in 2015 because school participation rates did not meet the 70 percent criteria.
SOURCE: U.S. Department of Education, Institute of Education Sciences, National Center for Education Statistics, National Assessment of Educational Progress (NAEP), various years, 2005-15 National Indian Education Studies.


The characteristics of students attending low density, high density, and BIE schools differed at both grades. For example, BIE schools had a significantly higher percentage of students who were English language learners (ELL) and eligible for the National School Lunch Program (NSLP). Additionally, high density schools had a significantly higher percentage of ELL students and NSLP-eligible students than low density schools.

The report also explored to what extent AI/AN culture and language are part of the school curricula. AI/AN students in grades 4 and 8 reported that family members taught them the most about Native traditions. Differences by school type and density were observed in responses to other questions about the knowledge AI/AN students had of their family’s Native culture, the role AI/AN languages played in their lives, and their involvement in Native cultural ceremonies and gatherings in the community. For example, 28 percent of 4th-grade students in BIE schools reported they knew “a lot” about the history, traditions, or arts and crafts of their tribe compared to 22 percent of their AI/AN peers in high density schools, and 18 percent of those in low density schools. Similarly, 52 percent of 8th-grade students at BIE schools participated several times a year in ceremonies and gatherings of their AI/AN tribe or group, compared to 28 percent of their peers at high density public schools, and 20 percent of their peers at low density public schools.

If you’re interested in learning more about NIES, including what the study means for American Indian and Alaska Native students and communities, you can view the video below. Access the compete report and find out more about the study here: https://nces.ed.gov/nationsreportcard/nies/


[1] See https://nces.ed.gov/programs/coe/indicator_cgg.asp

[2] See https://nces.ed.gov/programs/raceindicators/indicator_rcc.asp

[3] American Indian and Alaska Native state-specific 2015 NIES results are available for the following 14 states:  Alaska, Arizona, Minnesota, Montana, New Mexico, North Carolina, North Dakota, Oklahoma, Oregon, South Dakota, Utah, Washington, Wisconsin, and Wyoming. 

[4] Less than 25 percent of the student body is American Indian or Alaska Native. In low density schools, AI/AN students represented 1 percent of the students at grades 4 and 8.

[5] 25 percent or more of the student body is American Indian or Alaska Native. In high density schools, 53 percent of 4th-graders and 54 percent of 8th-graders were AI/AN students.

[6] In BIE schools, 97 percent of 4th-graders and 99 percent of 8th-graders were AI/AN students. 

America’s Advanced Mathematics and Physics Students in a Global Context

By Dana Tofig, Communications Director, Institute of Education Sciences

In today’s increasingly global economy, there is a lot of interest in understanding how students in the United States (U.S.) are performing compared to their peers around the world. That is why the National Center for Education Statistics participates in and conducts several international assessments. One of those assessments—the Trends in International Mathematics and Science Study (TIMSS) Advanced—gives us a unique opportunity to see how our advanced students are performing in rigorous mathematics and physics classes as they complete high school. TIMSS Advanced is part of a broader data collection that also assesses the performance of 4th- and 8th-grade students in mathematics and science, the results of which are summarized in another blog entry.

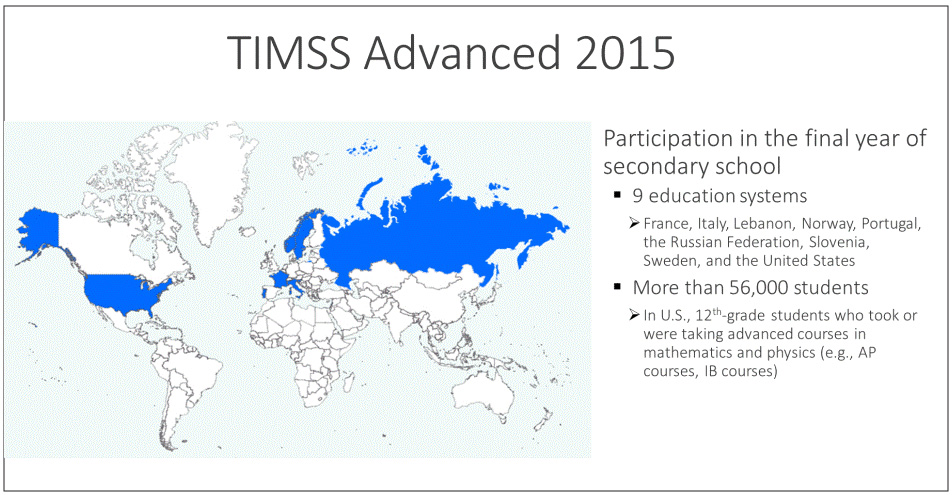
The TIMSS Advanced 2015 was administered to students from nine education systems that were in their final year of secondary school who had taken or were taking advanced mathematics or physics courses. In the U.S., the TIMSS Advanced was given to over 5,500 students in Grade 12 who were taking or had taken advanced mathematics courses covering topics in geometry, algebra and calculus, or a second-year physics course. The last time that the U.S. participated in TIMSS Advanced was 1995.

What Percentage of Students Take Advanced Mathematics and Physics?

Among the nine education systems participating in TIMSS Advanced 2015, the percentage of the corresponding age cohort (18-year-olds in the U.S.) taking advanced mathematics varies widely. This percentage, which TIMSS calls the “coverage index,” ranges from a low of 1.9 percent to a high of 34.4 percent. The U.S. falls in the middle, with 11.4 percent of 18-year-olds taking advanced mathematics courses.  The U.S. advanced mathematics coverage index in 2015 has nearly doubled since 1995, when it was 6.4 percent.

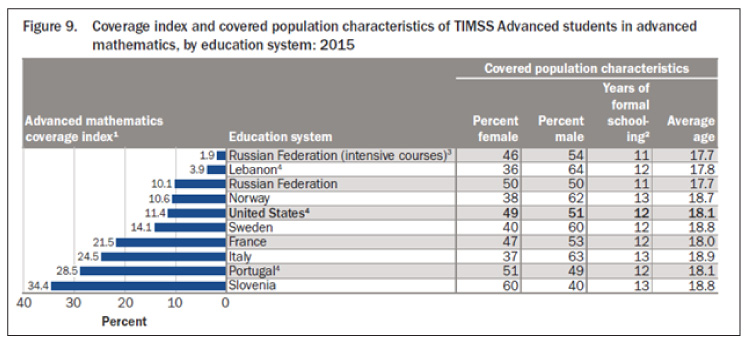
In the U.S. and two other participating systems—Portugal and Russian Federation—the students taking advanced mathematics were split fairly evenly between male and female. In the remaining systems, the students in the coverage index were majority male, except for Slovenia, where 60 percent were female. Interestingly, Slovenia had the highest coverage index, at 34.4 percent.

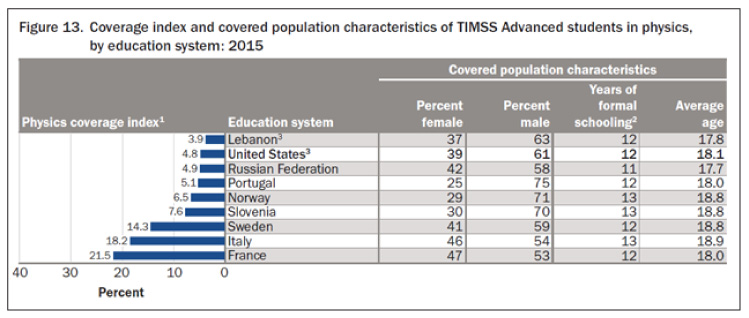
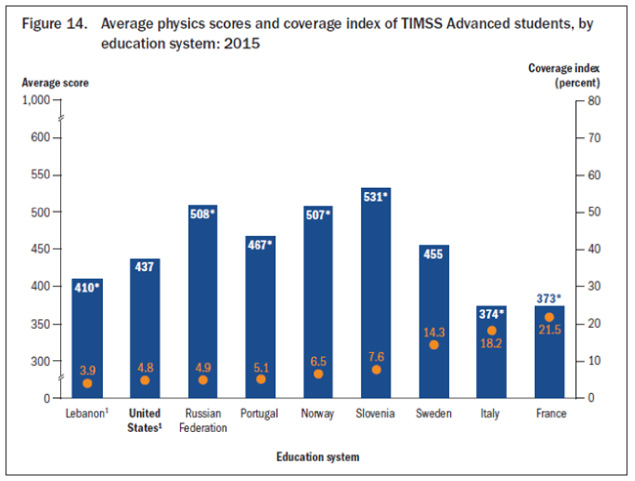
It’s a different story in science for the U.S. Among 18-year-olds in the U.S., 4.8 percent took Physics, which was among the lowest for the nine systems participating in TIMSS Advanced. Only Lebanon (3.9 percent) had a lower percentage, while France had the highest coverage index at 21.5 percent. Males made up a majority of physics students in all nine participating systems, including the U.S. 

How Did U.S. Students Perform in Advanced Mathematics?

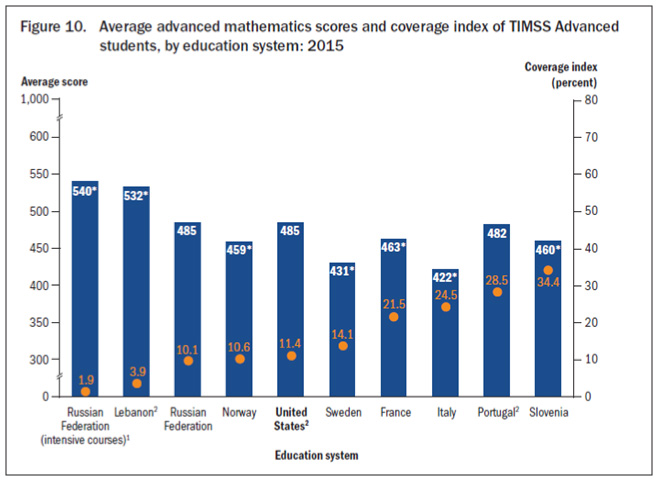
U.S. students scored 485 on TIMSS Advanced 2015 in advanced mathematics, which is not significantly different from the average U.S. score in 1995. It should be noted that on TIMSS 2015, given to a representative sample of fourth- and eighth-graders across the U.S., mathematics scores for both grades increased significantly from 1995 to 2015.

On TIMSS Advanced 2015 in advanced mathematics, two systems scored significantly higher than the U.S. (Lebanon and Russian Federation students who took intensive courses[1]) while five systems scored significantly lower (Norway, Sweden, France, Italy and Slovenia). The remaining two systems scored about the same as the U.S.

How Did U.S. Students Perform in Physics?

U.S. students scored 437 on TIMSS Advanced 2015 in physics, which was not statistically different than in 1995. No education system did better on physics in 2015 than 1995, but several did worse—four of the six systems that took the TIMSS Advanced in both 1995 and 2015 saw a significant drop in their scores.

Four of the nine countries participating in TIMSS Advanced 2015 in physics had a score that was significantly higher than the U.S. (Russian Federation, Portugal, Norway, and Slovenia) and three countries scored significantly lower than the U.S. (Lebanon, Italy and France). Sweden’s physics score was not significantly different than the U.S. 

A Note about Interpretation

It’s important to remember that there are differences in student characteristics and the structure of the various education systems that participated in TIMSS Advanced 2015. Those differences should be kept in mind when interpreting results. 


[1] Intensive courses are advanced mathematics courses that involve 6 or more hours per week. Results for students in these courses are reported separately from the results for other students from the Russian Federation taking courses that involve 4.5 hours per week.