IES Blog

Institute of Education Sciences

New Data Available on Prevalence of Recognized Student Acceptance Groups

Schools can help to foster students’ understanding of diversity and create environments where students feel safe and welcome. One way to do this is by organizing student groups whose purpose is to promote acceptance of other students. The School Survey on Crime and Safety (SSOCS) collected data on the presence of recognized student acceptance groups during the 2015–16 school year from a nationally representative sample of 3,500 K–12 public schools. The questionnaire asked whether schools had student groups that promote acceptance of students’ sexual orientations[i] and gender identities,[ii] of students with disabilities, and of cultural diversity.

Among all public schools, groups that promote acceptance of students with disabilities were most common. Some 27 percent of schools reported having a student group that promotes acceptance of students with disabilities during the 2015­–16 school year, compared with 21 percent that reported having a student group that promotes acceptance of cultural diversity and 12 percent that reported having a student group that promotes acceptance of students’ sexual orientations and gender identities.


Figure 1. Percentage of public schools reporting the presence of recognized student acceptance groups, by school level and purpose of student group: School year 2015–16

1Primary schools are defined as schools in which the lowest grade is not higher than grade 3 and the highest grade is not higher than grade 8. Middle schools are defined as schools in which the lowest grade is not lower than grade 4 and the highest grade is not higher than grade 9. High schools are defined as schools in which the lowest grade is not lower than grade 9 and the highest grade is not higher than grade 12. The total also includes combined schools. Combined schools are schools that have a combination of grades that cannot be categorized as primary, middle, or high schools, including K–12 schools. 
2Sexual orientation was defined for respondents as one’s emotional or physical attraction to the same and/or opposite sex. Gender identity was defined for respondents as one’s inner sense of one’s own gender, which may or may not match the sex assigned at birth. Different people choose to express their gender identity differently. For some, gender may be expressed through, for example, dress, grooming, mannerisms, speech patterns, and social interactions. Gender expression usually ranges between masculine and feminine, and some transgender people express their gender consistent with how they identify internally, rather than in accordance with the sex they were assigned at birth. An example of a student group to promote acceptance of students' sexual orientations and gender identities provided to respondents was a Gay-Straight Alliance.
3An example of a student group to promote acceptance of students with disabilities provided to respondents was Best Buddies.
4An example of a student group to promote acceptance of cultural diversity provided to respondents was a Cultural Awareness Club.
NOTE: Responses were provided by the principal or the person most knowledgeable about school crime and policies to provide a safe environment. Although rounded numbers are displayed, the figures are based on unrounded data. 
SOURCE: U.S. Department of Education, National Center for Education Statistics (NCES), 2015–16 School Survey on Crime and Safety (SSOCS), 2016. See table 37.


All three types of acceptance groups were more common in high schools than in middle or primary schools. The most common type of student acceptance group varied by school level. For example, among middle schools, the percentage of schools that reported having a student group that promotes acceptance of students with disabilities (32 percent) was higher than the percentage that reported having a student group that promotes acceptance of cultural diversity (22 percent) or acceptance of students’ sexual orientations and gender identities (12 percent). This pattern was similar for primary schools. Among high schools, the percentage of schools that reported having a student group that promotes acceptance of students’ sexual orientations and gender identities (50 percent) was higher than the percentage that reported having a student group that promotes acceptance of students with disabilities (45 percent).

During the 2015–16 school year, all three types of student acceptance groups were more commonly found in schools in cities and suburbs than in schools in rural areas. For example, 30 percent of schools in cities and 26 percent of schools in suburbs reported having a student group that promotes acceptance of cultural diversity, compared with 10 percent of schools in rural areas.


Figure 2. Percentage of public schools reporting the presence of recognized student acceptance groups, by purpose of student group and school locale: School year 2015–16

1Sexual orientation was defined for respondents as one's emotional or physical attraction to the same and/or opposite sex. Gender identity was defined for respondents as one's inner sense of one's own gender, which may or may not match the sex assigned at birth. Different people choose to express their gender identity differently. For some, gender may be expressed through, for example, dress, grooming, mannerisms, speech patterns, and social interactions. Gender expression usually ranges between masculine and feminine, and some transgender people express their gender consistent with how they identify internally, rather than in accordance with the sex they were assigned at birth. An example of a student group to promote acceptance of students' sexual orientations and gender identities provided to respondents was a Gay-Straight Alliance.
2An example of a student group to promote acceptance of students with disabilities provided to respondents was Best Buddies.
3An example of a student group to promote acceptance of cultural diversity provided to respondents was a Cultural Awareness Club.
NOTE: Responses were provided by the principal or the person most knowledgeable about school crime and policies to provide a safe environment.
SOURCE: U.S. Department of Education, National Center for Education Statistics (NCES), 2015–16 School Survey on Crime and Safety (SSOCS), 2016. See table 37.


You can find more information on school crime and safety in NCES publications, including Crime, Violence, Discipline, and Safety in U.S. Public Schools: Findings From the School Survey on Crime and Safety: 2015–16 and the 2017 Indicators of School Crime and Safety.


By Rachel Hansen, NCES, and Melissa Diliberti, AIR


[i]Sexual orientation was defined for respondents as one’s emotional or physical attraction to the same and/or opposite sex.

[ii]Gender identity was defined for respondents as one’s inner sense of one’s own gender, which may or may not match the sex assigned at birth. Different people choose to express their gender identity differently. For some, gender may be expressed through, for example, dress, grooming, mannerisms, speech patterns, and social interactions. Gender expression usually ranges between masculine and feminine, and some transgender people express their gender consistent with how they identify internally, rather than in accordance with the sex they were assigned at birth.

Learning about Schools from Teachers and Principals

In the 2015-16 school year, there were approximately 90,400 principals and 3,827,100 teachers in public elementary and secondary schools in the United States. Knowledge about the characteristics and experiences of these key school staff can help inform decisions about education.  The National Teacher and Principal Survey (NTPS) supports these decisions by providing data on a variety of topics from the perspective of teachers, principals and other school staff. Results from these questionnaires provide information such as:

  • Principals’ education. Among public schools, a majority of principals held a master’s degree (61 percent) as their highest degree, compared to an education specialist/professional diploma at least one year beyond the master’s level (27 percent), a doctorate/first professional degree (10 percent), or a bachelor’s degree or less (2 percent).
  • Hours worked by teachers. On average, regular full-time teachers in public schools spent 53 hours per week on all school-related activities. That includes 27 hours that they were paid to deliver instruction to students during a typical full week. Public school teachers were required to work an average of 38 hours per week to receive their base pay.
  • Online courses. Nationwide, about 21 percent of public schools offered at least one course entirely online. This was more common among public charter schools (29 percent) than it was among traditional public schools (20 percent). A greater percentage of high (58 percent) and combined (64 percent) schools offered one or more courses entirely online than all public schools. It was also more common for schools with fewer than 100 students (45 percent) and schools with 1,000 or more students (44 percent). Among schools offering online courses, relatively more public charter schools offered all of their classes online (14 percent) than traditional public schools (5 percent).

More examples of the type of information collected in the 2015-16 NTPS can be seen in the video below:

More information is available in the NTPS online table library. In addition, analysts can access the data using DataLab or obtain a restricted-use license to conduct their own analyses of NTPS restricted-use data files.


By Maura Spiegelman

Explore Data on Mental Health Services in K–12 Public Schools for Mental Health Awareness Month

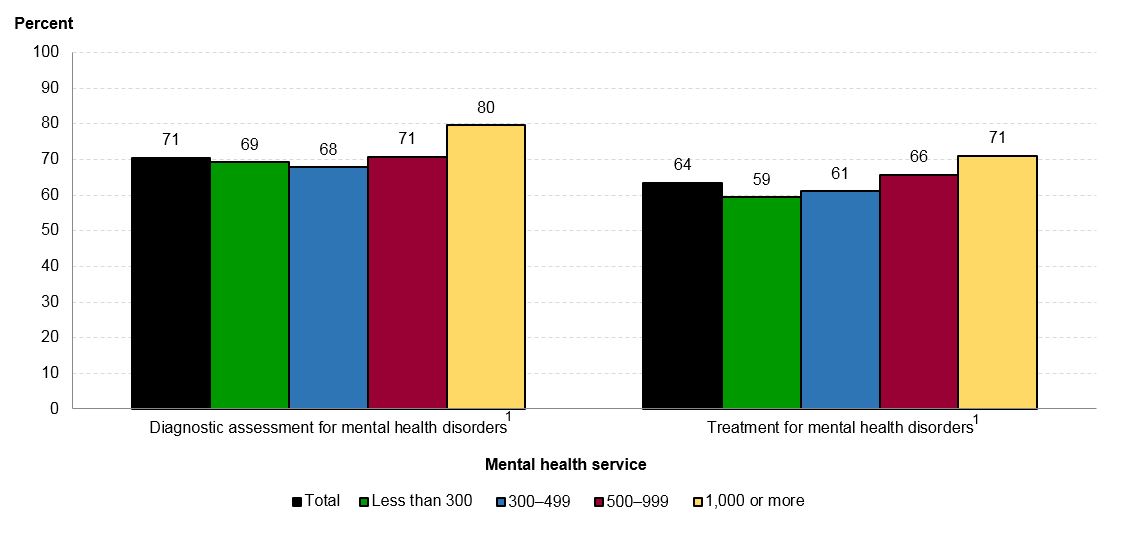
It’s important for schools to help ensure students are safe and healthy, both physically and mentally, so that learning can occur. In addition to implementing security measures on school campuses, there has been a growing focus on whether schools provide mental health services. In school year 2015–16, some 71 percent of public schools reported having diagnostic assessments for mental health disorders available to students, and 64 percent of schools reported having treatment available. [i]

These data come from the School Survey on Crime and Safety (SSOCS). The 2015–16 SSOCS questionnaire added new questions asking principals to report whether diagnostic assessment and treatment services for mental health were available to students under the official responsibilities of a licensed mental health professional.[ii] Diagnostic assessments are used to identify whether a student has one or more medical and/or mental health diagnoses. Treatment is a clinical service, such as psychotherapy, medication, or counseling, which is intended to lessen or eliminate the symptoms of a disorder.

The prevalence of mental health services varied by school characteristics. In both middle and high schools, diagnostic assessment services were more common than treatment services: 74 percent of middle schools and 79 percent of high schools reported diagnostic assessments were available, compared with 66 percent of middle schools and 69 percent of high schools reporting treatment services were available. Compared to primary schools, a higher percentage of high schools reported that both types of mental health services were available.


Figure 1. Percentage of public schools reporting the availability of mental health services under the official responsibilities of a licensed mental health professional, by type of mental health service and school enrollment size: School year 2015–16
1Mental health disorders were defined for respondents as, collectively, all diagnosable mental disorders or health conditions that are characterized by alterations in thinking, mood, or behavior (or some combination thereof) associated with distress and/or impaired functioning.
NOTE: Mental health services are provided by several different types of mental health professionals, each of which have their own training and areas of expertise. The types of professionals who may provide mental health services include psychiatrists, psychologists, psychiatric/mental health nurse practitioners, psychiatric/mental health nurses, clinical social workers, and professional counselors. Responses were provided by the principal or the person most knowledgeable about school crime and policies to provide a safe environment.
SOURCE: U.S. Department of Education, National Center for Education Statistics, 2015–16 School Survey on Crime and Safety (SSOCS), 2016. See table 40.


The percentage of schools with 1,000 or more students that reported having diagnostic assessment services available (80 percent) was higher than the percentages of schools with fewer than 300 students (69 percent), 300–499 students (68 percent), and 500–999 students (71 percent).

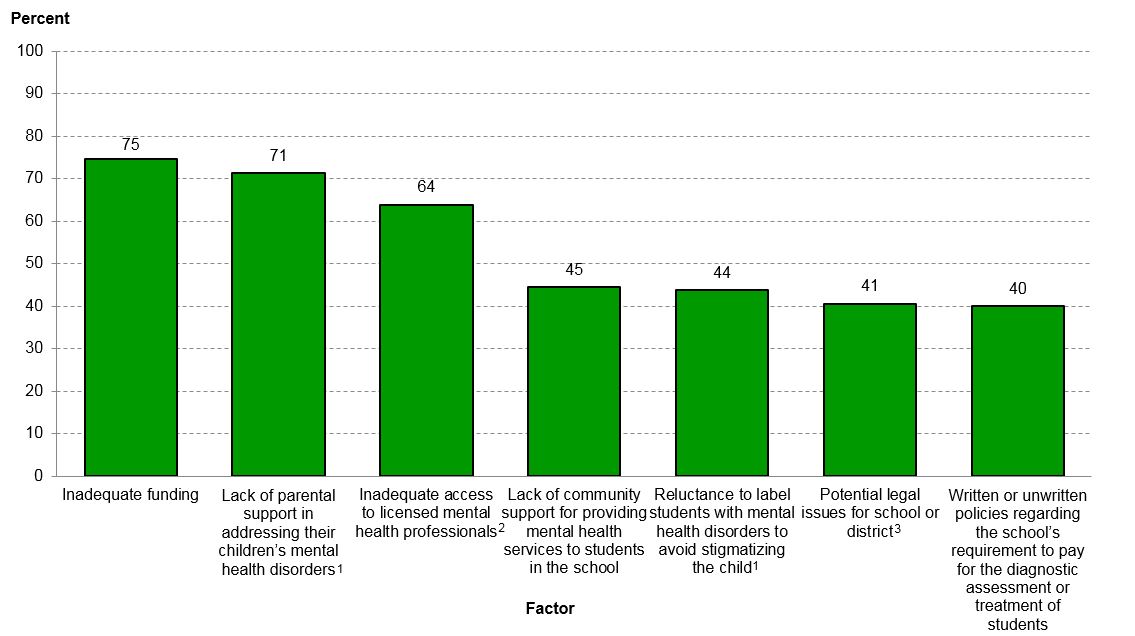
The questionnaire also asked principals to report to what extent certain factors limited the school’s efforts to provide mental health services to students. The most common limiting factors reported by schools were inadequate funding (75 percent) and lack of parental support (71 percent).


Figure 2. Percentage of public schools reporting that their efforts to provide mental health services to students were limited in a major or minor way due to specified non-school-level factors: School year 2015–16
1Mental health disorders were defined for respondents as, collectively, all diagnosable mental disorders or health conditions that are characterized by alterations in thinking, mood, or behavior (or some combination thereof) associated with distress and/or impaired functioning.
2Mental health services are provided by several different types of mental health professionals, each of which have their own training and areas of expertise. The types of professionals who may provide mental health services include psychiatrists, psychologists, psychiatric/mental health nurse practitioners, psychiatric/mental health nurses, clinical social workers, and professional counselors. 
3Examples of legal issues provided to respondents were malpractice and insufficient supervision.
NOTE: Respondents were asked to rate the level of limitation in their school’s efforts to provide mental health services to students for each factor. Survey response options included “limits in major way,” “limits in minor way,” or “does not limit." Responses were provided by the principal or the person most knowledgeable about school crime and policies to provide a safe environment.
SOURCE: U.S. Department of Education, National Center for Education Statistics, 2015–16 School Survey on Crime and Safety (SSOCS), 2016. See table 39.


You can find more information on school crime and safety in NCES publications, including Crime, Violence, Discipline, and Safety in U.S. Public Schools: Findings From the School Survey on Crime and Safety: 2015–16 and the 2017 Indicators of School Crime and Safety.


By Rachel Hansen, NCES and Melissa Diliberti, AIR


[i] Includes services available at school by a mental health professional employed by the school or district; services available at school by a mental health professional other than a school or district employee, funded by the school or district; and services available outside of school by a mental health professional other than a school or district employee, funded by the school or district.

[ii] The 2015–16 questionnaire provided formal definitions for many terms, including at school, diagnostic assessment, mental health disorders, mental health professionals, and treatment.


New Data from the 2015–16 National Postsecondary Student Aid Study

Seventy-two percent of all undergraduate students received some type of financial aid, including loans, in the 2015–16 academic year. For those who received aid, the average was about $12,300 per student. If you want to explore more statistics on student financial aid, you can! NCES has released new data from the 2015–16 National Postsecondary Student Aid Study (NPSAS:16). Data users have the ability to generate estimates and perform their own analyses using our online data analysis tools available in DataLab. Users can select the tool that best meets their needs, including PowerStats, QuickStats, and TrendStats.

NPSAS is the most comprehensive nationally representative study of how students and their families finance postsecondary education in the United States. The NPSAS:16 sample consisted of approximately 113,000 undergraduate and graduate students attending 1,800 postsecondary institutions in the 50 states, the District of Columbia, and Puerto Rico.

In addition to information on financial aid, the study collects data on many other topics, such as student demographics, total and net prices of attendance, education-related debt, major field of study, employment while enrolled, and participation in remedial education.

To enhance the data and address emerging policy issues, NCES has also included new and expanded items on these topics in NPSAS:16:

  • Financial literacy, including questions to measure understanding of key financial concepts such as inflation, interest rates, and investment, plus questions on the possible consequences for failing to repay federal student loans;
  • Alternative repayment options for federal loans, including awareness of and plans to use income-driven repayment and public service loan forgiveness;
  • Student veterans and military students, including an oversample of student veterans, measures of federal veterans’ education benefits derived from administrative sources, indicators of whether institutions offer programs targeted to veterans and military students, and new measures of state and institution aid specifically for student veterans; and
  • Study abroad, including the location and duration of time spent abroad.

A First Look report, which was released in January, highlighted key findings from the study. For more information on how the study was planned and conducted, including extensive details on sampling, data collection, response rates, weighting, and other topics, we encourage you to see the 2015–16 National Postsecondary Student Aid Study (NPSAS:16) Data File Documentation report.

By Tracy Hunt-White

CTE Statistics: New Information on How Adults Prepare for Work

By Lisa Hudson

Education provides students with the knowledge and skills needed to be informed citizens, productive workers, and responsible community members. Meeting one of these goals—preparing students for work—is the main goal of career and technical education (CTE, formerly known as vocational education). To monitor CTE in the United States, the National Center for Education Statistics (NCES) produces a comprehensive set of statistical data on CTE at the secondary and postsecondary levels, as well as on adult preparation for work. These statistics, and related reports, are available on the CTE Statistics website.

NCES recently released data related to preparation for work, which was collected as part of the 2016 Adult Education and Training Survey (ATES).  The ATES asked a nationally-representative sample of adults about their attainment of two often-overlooked work credentials—licenses and certifications—and about their completion of work experience programs (such as internships and apprenticeships).  The survey also examined the role of education in helping adults attain these credentials and complete these programs.

The data show that 21 percent of adults have a currently active license or certification, with 18 percent reporting they have a license and 6 percent reporting they have a certification (some adults have both). Additionally, completion of degree programs is related to the attainment of these work credentials. For example, having a certification or license is more common among adults who have a college degree than among adults with lower levels of education (see figure).  In addition, about two-thirds of the adults who have completed a certification or licensing program (67 percent) did so in conjunction with coursetaking after high school.


Findings are similar for work experience programs. Overall, 21 percent of adults have completed a work experience program, and 14 percent of adults have completed a work experience program that was part of an educational program after high school.

Finally, the ATES showed that work credentials and work experience programs are particularly common in the health care field. In fact, health care was the most common field in which both licenses and certifications were held (31 percent of credentialed adults), and the most common field in which adults had completed a work experience program (26 percent of program completers) .

The information discussed in this blog is drawn from the ATES “First Look” report. The CTE Statistics website also includes a summary of these key findings, and within the next year additional ATES statistics will be added to the website.  To sign up for automatic email notifications on when new material is added to the CTE Statistics website, visit the IES newsflash (under National Center for Education Statistics, check the box for “Adult and Career Education”).  We look forward to sharing future results with you!