IES Blog

Institute of Education Sciences

New International Comparisons of Reading, Mathematics, and Science Literacy Assessments

The Program for International Student Assessment (PISA) is a study of 15-year-old students’ performance in reading, mathematics, and science literacy that is conducted every 3 years. The PISA 2018 results provide us with a global view of U.S. students’ performance compared with their peers in nearly 80 countries and education systems. In PISA 2018, the major domain was reading literacy, although mathematics and science literacy were also assessed.

In 2018, the U.S. average score of 15-year-olds in reading literacy (505) was higher than the average score of the Organization for Economic Cooperation and Development (OECD) countries (487). Compared with the 76 other education systems with PISA 2018 reading literacy data, including both OECD and non-OECD countries, the U.S. average reading literacy score was lower than in 8 education systems, higher than in 57 education systems, and not measurably different in 11 education systems. The U.S. percentage of top performers in reading was larger than in 63 education systems, smaller than in 2 education systems, and not measurably different in 11 education systems. The average reading literacy score in 2018 (505) was not measurably different from the average score in 2000 (504), the first year PISA was administered. Among the 36 education systems that participated in both years, 10 education systems reported higher average reading literacy scores in 2018 compared with 2000, and 11 education systems reported lower scores.

The U.S. average score of 15-year-olds in mathematics literacy in 2018 (478) was lower than the OECD average score (489). Compared with the 77 other education systems with PISA 2018 mathematics literacy data, the U.S. average mathematics literacy score was lower than in 30 education systems, higher than in 39 education systems, and not measurably different in 8 education systems. The average mathematics literacy score in 2018 (478) was not measurably different from the average score in 2003 (483), the earliest year with comparable data. Among the 36 education systems that participated in both years, 10 systems reported higher mathematics literacy scores in 2018 compared with 2003, 13 education systems reported lower scores, and 13 education systems reported no measurable changes in scores.  

The U.S. average score of 15-year-olds in science literacy (502) was higher than the OECD average score (489). Compared with the 77 other education systems with PISA 2018 science literacy data, the U.S. average science literacy score was lower than in 11 education systems, higher than in 55 education systems, and not measurably different in 11 education systems. The average science literacy score in 2018 (502) was higher than the average score in 2006 (489), the earliest year with comparable data. Among the 52 education systems that participated in both years, 7 education systems reported higher average science literacy scores in 2018 compared with 2006, 22 education systems reported lower scores, and 23 education systems reported no measurable changes in scores.

PISA is conducted in the United States by NCES and is coordinated by OECD, an intergovernmental organization of industrialized countries. Further information about PISA can be found in the technical notes, questionnaires, list of participating OECD and non-OECD countries, released assessment items, and FAQs.


By Thomas Snyder

New Study on U.S. Eighth-Grade Students’ Computer Literacy

In the 21st-century global economy, computer literacy and skills are an important part of an education that prepares students to compete in the workplace. The results of a recent assessment show us how U.S. students compare to some of their international peers in the areas of computer information literacy and computational thinking.

In 2018, the U.S. participated for the first time in the International Computer and Information Literacy Study (ICILS), along with 13 other education systems around the globe. The ICILS is a computer-based international assessment of eighth-grade students that measures outcomes in two domains: computer and information literacy (CIL)[1] and computational thinking (CT).[2] It compares U.S. students’ skills and experiences using technology to those of students in other education systems and provides information on teachers’ experiences, school resources, and other factors that may influence students’ CIL and CT skills.

ICILS is sponsored by the International Association for the Evaluation of Educational Achievement (IEA) and is conducted in the United States by the National Center for Education Statistics (NCES).

The newly released U.S. Results from the 2018 International Computer and Information Literacy Study (ICILS) web report provides information on how U.S. students performed on the assessment compared with students in other education systems and describes students’ and teachers’ experiences with computers.


U.S. Students’ Performance

In 2018, U.S. eighth-grade students’ average score in CIL was higher than the average of participating education systems[3] (figure 1), while the U.S. average score in CT was not measurably different from the average of participating education systems.


Figure 1. Average computer and information literacy (CIL) scores of eighth-grade students, by education system: 2018p < .05. Significantly different from the U.S. estimate at the .05 level of statistical significance.

¹ Met guidelines for sample participation rates only after replacement schools were included.

² National Defined Population covers 90 to 95 percent of National Target Population.

³ Did not meet the guidelines for a sample participation rate of 85 percent and not included in the international average.

⁴ Nearly met guidelines for sample participation rates after replacement schools were included.

⁵ Data collected at the beginning of the school year.

NOTE: The ICILS computer and information literacy (CIL) scale ranges from 100 to 700. The ICILS 2018 average is the average of all participating education systems meeting international technical standards, with each education system weighted equally. Education systems are ordered by their average CIL scores, from largest to smallest. Italics indicate the benchmarking participants.

SOURCE: International Association for the Evaluation of Educational Achievement (IEA), the International Computer and Information Literacy Study (ICILS), 2018.


Given the importance of students’ home environments in developing CIL and CT skills (Fraillon et al. 2019), students were asked about how many computers (desktop or laptop) they had at home. In the United States, eighth-grade students with two or more computers at home performed better in both CIL and CT than their U.S. peers with fewer computers (figure 2). This pattern was also observed in all participating countries and education systems.


Figure 2. Average computational thinking (CT) scores of eighth-grade students, by student-reported number of computers at home and education system: 2018

p < .05. Significantly different from the U.S. estimate at the .05 level of statistical significance.

¹ Met guidelines for sample participation rates only after replacement schools were included.

² National Defined Population covers 90 to 95 percent of National Target Population.

³ Did not meet the guidelines for a sample participation rate of 85 percent and not included in the international average.

⁴ Nearly met guidelines for sample participation rates after replacement schools were included.

NOTE: The ICILS computational thinking (CT) scale ranges from 100 to 700. The number of computers at home includes desktop and laptop computers. Students with fewer than two computers include students reporting having “none” or “one” computer. Students with two or more computers include students reporting having “two” or “three or more” computers. The ICILS 2018 average is the average of all participating education systems meeting international technical standards, with each education system weighted equally. Education systems are ordered by their average scores of students with two or more computers at home, from largest to smallest. Italics indicate the benchmarking participants.

SOURCE: International Association for the Evaluation of Educational Achievement (IEA), the International Computer and Information Literacy Study (ICILS), 2018.


U.S. Students’ Technology Experiences

Among U.S. eighth-grade students, 72 percent reported using the Internet to do research in 2018, and 56 percent reported completing worksheets or exercises using information and communications technology (ICT)[4] every school day or at least once a week. Both of these percentages were higher than the respective ICILS averages (figure 3). The learning activities least frequently reported by U.S eighth-grade students were using coding software to complete assignments (15 percent) and making video or audio productions (13 percent).


Figure 3. Percentage of eighth-grade students who reported using information and communications technology (ICT) every school day or at least once a week, by activity: 2018

p < .05. Significantly different from the U.S. estimate at the .05 level of statistical significance.

¹ Did not meet the guidelines for a sample participation rate of 85 percent and not included in the international average.

NOTE: The ICILS 2018 average is the average of all participating education systems meeting international technical standards, with each education system weighted equally. Activities are ordered by the percentages of U.S. students reporting using information and communications technology (ICT) for the activities, from largest to smallest.

SOURCE: International Association for the Evaluation of Educational Achievement (IEA), the International Computer and Information Literacy Study (ICILS), 2018.


Browse the full U.S. Results from the 2018 International Computer and Information Literacy Study (ICILS) web report to learn more about how U.S. students compare with their international peers in their computer literacy skills and experiences.


By Yan Wang, AIR, and Linda Hamilton, NCES


[1] CIL refers to “an individual's ability to use computers to investigate, create, and communicate in order to participate effectively at home, at school, in the workplace, and in society” (Fraillon et al. 2019).

[2] CT refers to “an individual’s ability to recognize aspects of real-world problems which are appropriate for computational formulation and to evaluate and develop algorithmic solutions to those problems so that the solutions could be operationalized with a computer” (Fraillon et al. 2019). CT was an optional component in 2018. Nine out of 14 ICILS countries participated in CT in 2018.

[3] U.S. results are not included in the ICILS international average because the U.S. school level response rate of 77 percent was below the international requirement for a participation rate of 85 percent.

[4] Information and communications technology (ICT) can refer to desktop computers, notebook or laptop computers, netbook computers, tablet devices, or smartphones (except when being used for talking and texting).


Reference

Fraillon, J., Ainley, J., Schulz, W., Duckworth, D., and Friedman, T. (2019). IEA International Computer and Information Literacy Study 2018: Assessment Framework. Cham, Switzerland: Springer. Retrieved October 7, 2019, from https://link.springer.com/book/10.1007%2F978-3-030-19389-8.

New 2019 Reading and Mathematics Assessment Data on 4th- and 8th-Grade Students

The average reading score for U.S. 4th- and 8th-grade students decreased between 2017 and 2019. Changes in mathematics scores were mixed during this period, with an increase at grade 4 and a decrease at grade 8. These data are from the National Assessment of Educational Progress (NAEP)—also known as The Nation’s Report Card. NAEP is the largest nationally representative and continuing assessment of what students in the United States know and can do in various subject areas and is frequently referred to as the “gold standard” of student assessments.

In 4th-grade reading, the average scale score in 2019 was 220, one point lower than in 2017 (figure 1). In 8th-grade reading, the average scale score was 263, three points lower than in 2017 (figure 2). Compared with a decade ago in 2009, the 2019 average reading scale scores at each grade were not significantly different, but they were higher than the scale scores in 1992, the first time the reading assessment was administered.


Figure 1. Average National Assessment of Educational Progress (NAEP) reading scale scores of 4th-grade students: Selected years, 1992–2019

* Significantly different (p < .05) from 2019

--- Accommodations not permitted

— Accommodations permitted


Figure 2. Average National Assessment of Educational Progress (NAEP) reading scale scores of 8th-grade students: Selected years, 1992–2019

* Significantly different (p < .05) from 2019

--- Accommodations not permitted

— Accommodations permitted


In 4th-grade mathematics, the average scale score in 2019 was 241, one point higher than in 2017 (figure 3). In 8th-grade mathematics, the average scale score in 2019 was 282, one point lower than in 2017 (figure 4). Like reading, average scale scores for mathematics at both grades in 2019 were not significantly different than in 2009. Mathematics scale scores for both grade were higher in 2019 than in 1990, the first time the mathematics assessments were administered.


Figure 3. Average National Assessment of Educational Progress (NAEP) mathematics scale scores of 4th-grade students: Selected years, 1990–2019

* Significantly different (p < .05) from 2019

--- Accommodations not permitted

— Accommodations permitted


Figure 4. Average National Assessment of Educational Progress (NAEP) mathematics scale scores of 8th-grade students: Selected years, 1990–2019

* Significantly different (p < .05) from 2019

--- Accommodations not permitted

— Accommodations permitted


The Nation’s Report Card also presents data by different demographic groups—such as race/ethnicity—gender, school type, and region. White and Black 4th- and 8th-grade students scored lower in reading in 2019 than in 2017. Hispanic and American Indian/Alaska Native 8th-grade students also scored lower in reading in 2019 than in 2017. In mathematics, 4th-grade Hispanic students scored higher in 2019 than in 2017, and 8th-grade American Indian/Alaska Native students scored lower in 2019 than in 2017. From 2017 to 2019, males’ scores increased in mathematics at grade 4 but decreased in reading at both grades.

NCES administered the 2019 NAEP mathematics and reading assessments to almost 600,000 4th- and 8th-graders in public and private schools in all 50 states, the District of Columbia, the U.S. Department of Defense schools, and 27 urban districts. Samples of schools and students are drawn from each state and from the District of Columbia and Department of Defense schools.

Visit https://nces.ed.gov/nationsreportcard/ to view the report.

Cost Considered “Very Important” to Parents Who Chose Relatives as Caregivers for Young Children

When it comes to choosing a child care arrangement, cost is a big factor in the choices parents make, according to recently released data from the National Center for Education Statistics (NCES).

Every 3 years, NCES conducts the Early Childhood Program Participation (ECPP) component of the National Household Education Surveys Program (NHES) to answer questions about young children’s care and education before starting kindergarten. The ECPP survey reported that 60 percent of children under age 5 who were not yet in kindergarten participated in at least one weekly nonparental care arrangement in 2016. Of those receiving nonparental care,

  • 42 percent received only center-based care;
  • 25 percent received only relative care;
  • 20 percent received multiple types of care; and
  • 12 percent received only nonrelative care.

When asked what factors influenced their choice of child care arrangements, 51 percent of parents ranked the cost as “very important” when selecting an arrangement in 2016. This percentage was higher among parents of children in relative care (63 percent) than among parents of children in multiple types of care arrangements (50 percent) and parents of children only in center-based care (47 percent).

Overall, in 2016, some 39 percent of parents with children in nonparental care reported that they had difficulty finding child care. This rate was lowest for parents of children only in relative care (23 percent) and highest for parents of children only in nonrelative care (53 percent). However, among parents who had difficulty trying to find child care, cost was a larger concern for those with children only in relative care than it was for those with children in other arrangements (see figure 1).


Figure 1. Percentage of children under age 5 whose parents reported that cost was the primary reason for difficulty finding child care arrangements, by type of arrangement: 2016

NOTE: Data are for children participating in at least one weekly nonparental care arrangement. Excludes children enrolled in kindergarten.

SOURCE: U.S. Department of Education, National Center for Education Statistics, The Costs of Child Care: Results From the 2016 Early Childhood Program Participation Survey (ECPP-NHES:2016).


In 2016, fees were less common and costs were generally lower for parents with children in relative care than for parents with children in other types of nonparental care arrangements. Thirty-two percent of parents with children in at least one care arrangement were not charged fees for care, and 58 percent of those children were in relative care. Among children in relative care, 80 percent were cared for by grandparents. When parents paid grandparents for their children’s care, they paid an average of $4.86 per hour, less than the average across all types of care arrangements ($6.93 per hour).

For more detailed information about costs of child care, see The Costs of Child Care: Results From the 2016 Early Childhood Program Participation Survey (ECPP-NHES:2016).


By Tracae McClure and Sarah Grady

New Data Support Connection Between Hate-Related Words, Fear, Avoidance, and Absenteeism

Research shows that absenteeism is related to a number of negative outcomes for students, such as lower test scores and higher dropout rates, and often occurs when students feel unsafe, especially for those who experience hate-related harassment. Victims of prejudice or discrimination, including those who are called hate-related words, also experience poorer mental health and higher substance use compared with students who experience other types of harassment (Baams, Talamage, and Russell 2017).

The School Crime Supplement (SCS) defines hate-related words as insulting or bad names having to do with the victim’s race, religion, ethnic background or national origin, disability, gender, or sexual orientation. According to the 2017 SCS, 6 percent of students overall were called a hate-related word while at school. Of students who reported being called a hate-related word, a lower percentage of White students (26 percent) reported that the hate-related word was related to their race than did students who were Black (68 percent), Hispanic (52 percent), Asian (85 percent), and of All other races (64 percent). Additionally, female students were more likely than male students to be called a hate-related word related to their gender (23 vs. 7 percent).

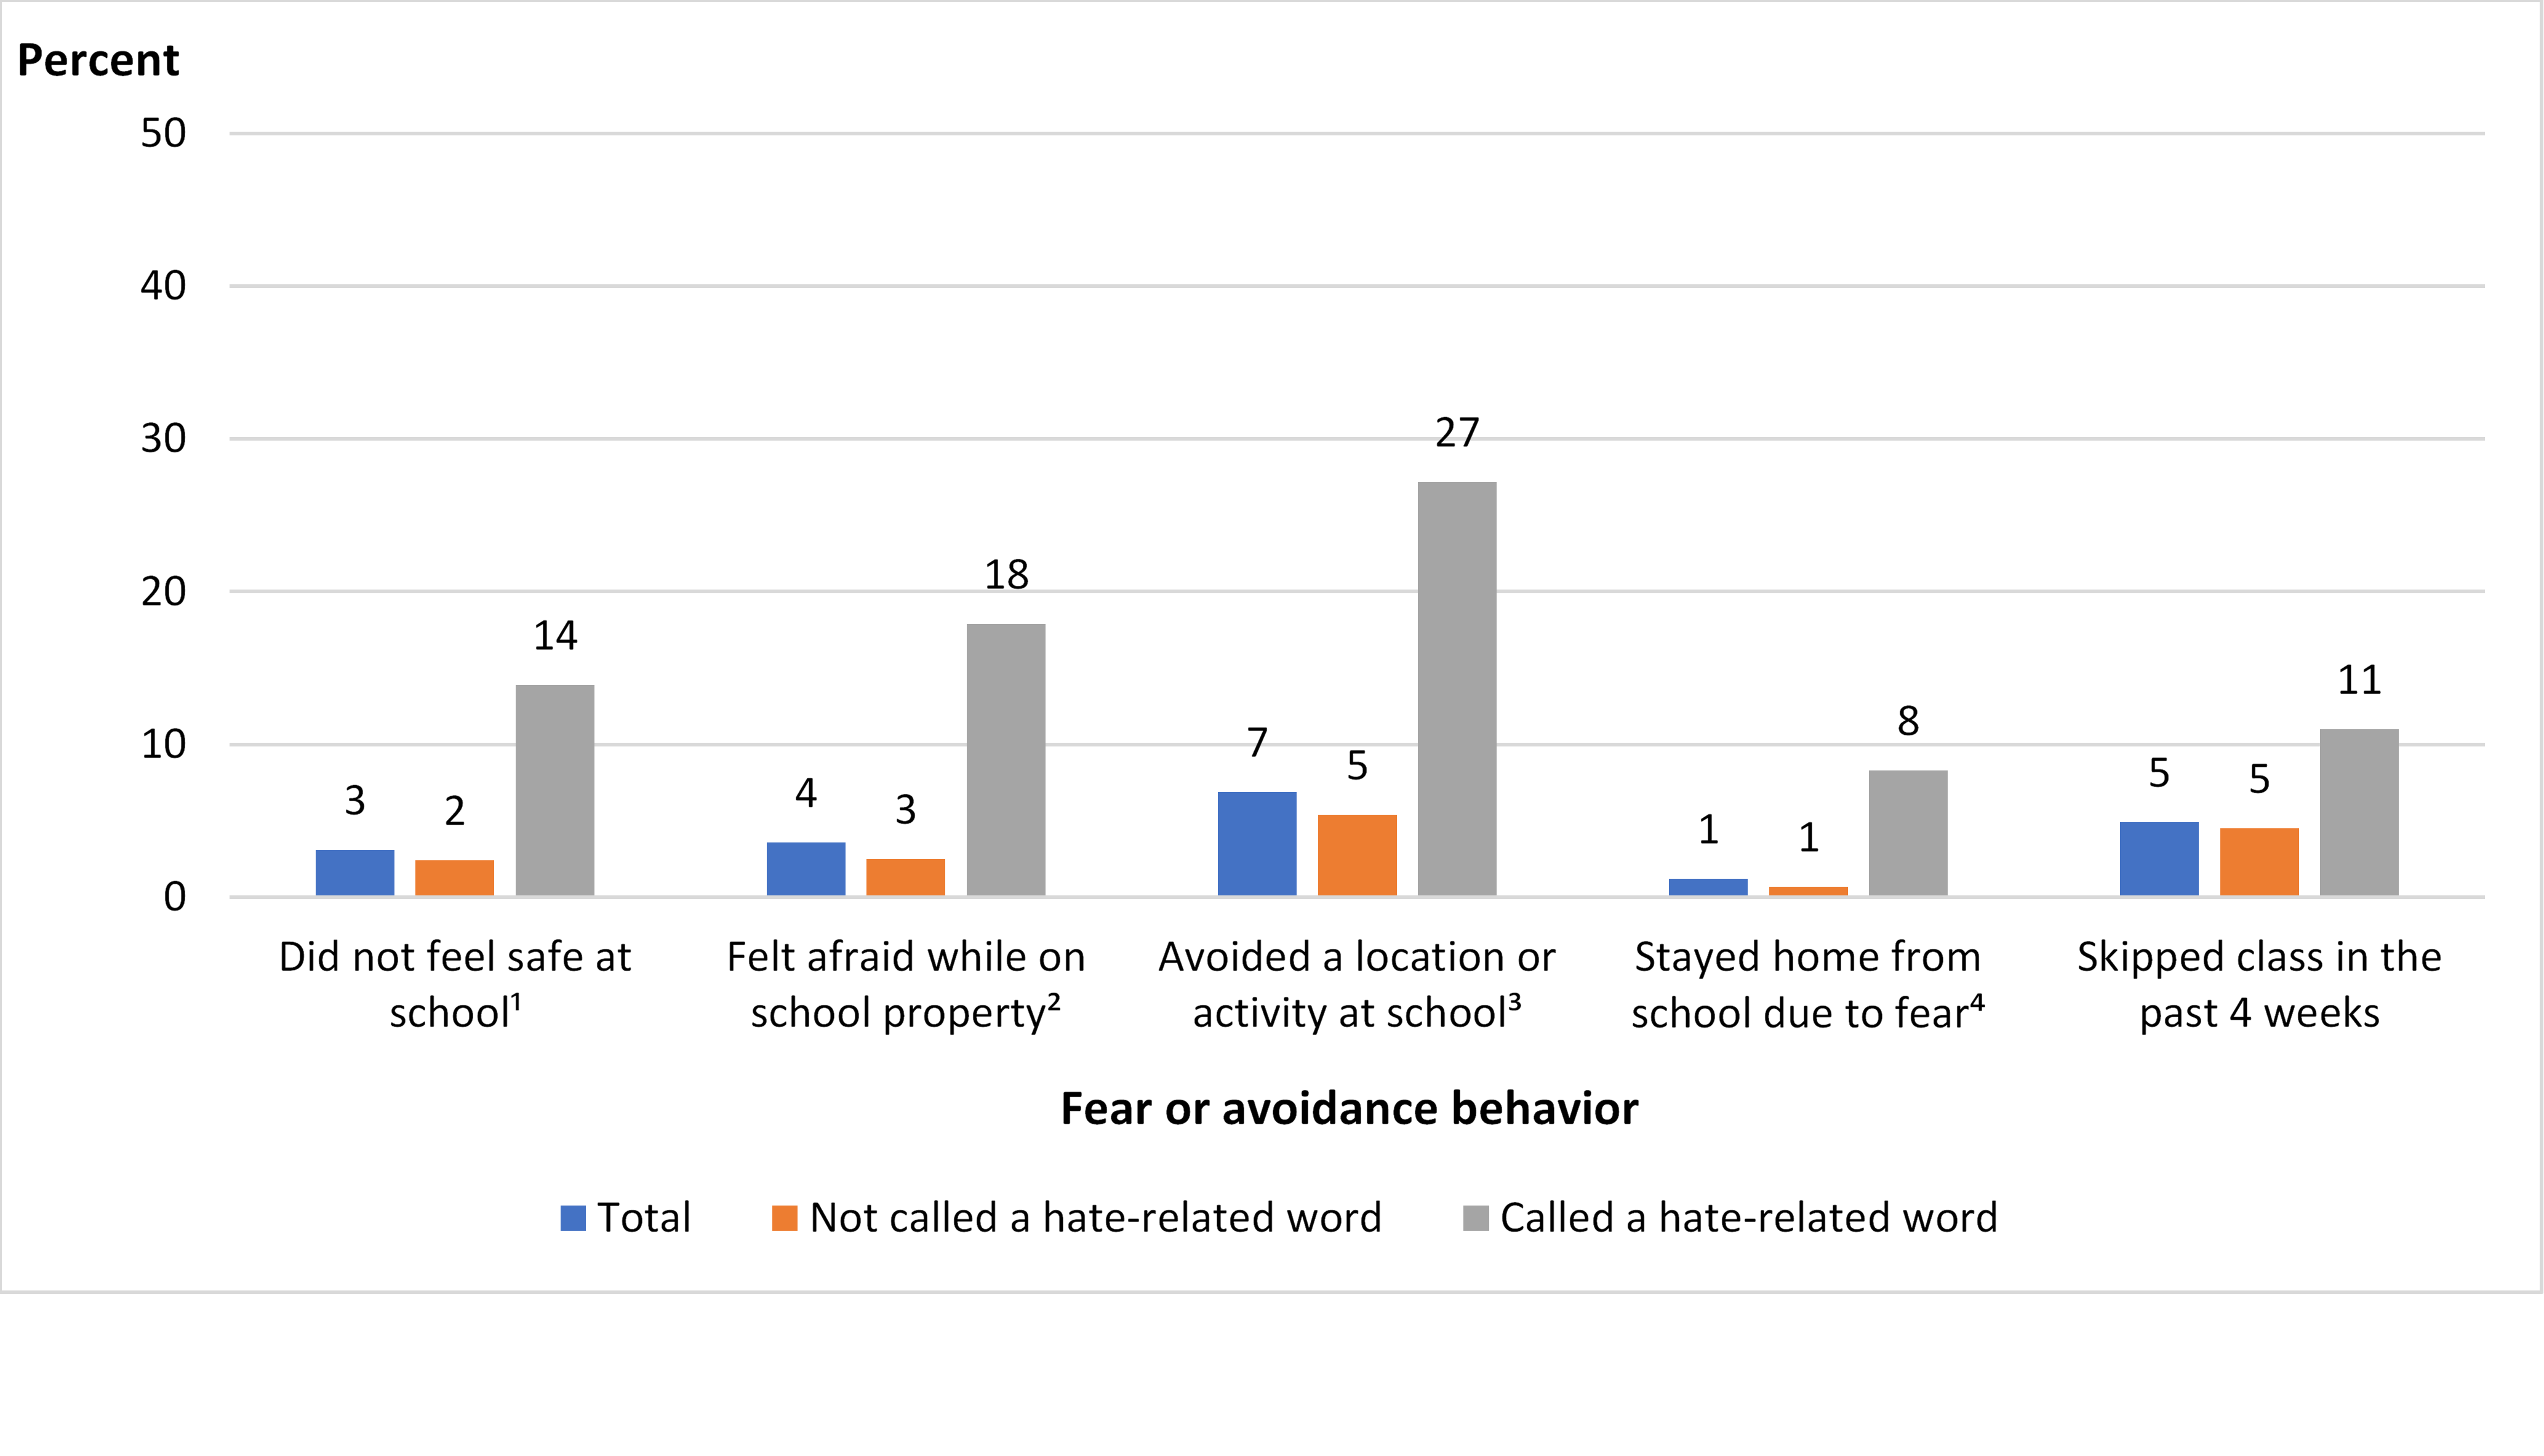
In the 2017 SCS, students who were called a hate-related word felt more fear, practiced more avoidance behaviors, stayed home more from school due to fear, and generally skipped classes more than students who were not called a hate-related word. Specifically, of those students who were called a hate-related word at school,

  • 14 percent did not feel safe at school (compared with 2 percent of students who were not called a hate-related word);
  • 18 percent were afraid that someone would attack or harm them on school property (compared with 3 percent of students who were not called a hate-related word);
  • 27 percent avoided some location, class, or activity at school (compared with 5 percent of students who were not called a hate-related word);
  • 8 percent stayed home from school due to fear that someone would attack or harm them (compared with 1 percent of students who were not called a hate-related word); and
  • 11 percent had skipped class sometime in the previous 4 weeks (compared with 5 percent of students who were not called a hate-related word).
     

Figure 1. Percentage of students ages 12 through 18 who reported being called a hate-related word at school, by student reports of fears and avoidance behaviors: School year 2016–17
1 Those who responded “disagree” or “strongly disagree” to the following question: “Thinking about your school, would you strongly agree, agree, disagree, or strongly disagree with the following? You feel safe in your school.”

2 Those who responded “sometimes” or “most of the time” to the following question: “How often are you afraid that someone will attack or harm you in the school building or on school property?”

3 Those who responded “yes” to one of the following questions: “During this school year, did you ever stay away from any of the following places: shortest route to school; the entrance into the school; any hallways or stairs in school; parts of the school cafeteria or lunchroom; any school restrooms; other places inside the school building; school parking lot; other places on school grounds; school bus or bus stop?”; “Did you avoid any activities at your school because you thought someone might attack or harm you?”; or “Did you avoid any classes because you thought someone might attack or harm you?”

4 Those who responded “yes” to the following question: “Did you stay home from school because you thought someone might attack or harm you in the school building, on school property, on a school bus, or going to or from school?”

NOTE: Figure data include only students who reported being enrolled in grades 6 through 12 and who did not receive any of their education through homeschooling during the school year reported. Students responded to the following question: “During this school year, has anyone called you an insulting or bad name at school having to do with your race, religion, ethnic background or national origin, disability, gender, or sexual orientation? We call these hate-related words.” Population size based on the 2017 SCS for all students meeting the age, grade, and school criteria is 25,023,000.

SOURCE: U.S. Department of Justice, Bureau of Justice Statistics, School Crime Supplement (SCS) to the National Crime Victimization Survey, 2017. See Table 16 in the crime table library.


You can find more information on student-reported experiences related to school crime and safety in NCES publications, including Student Reports of Bullying: Results From the 2017 School Crime Supplement to the National Crime Victimization Survey and the 2018 Indicators of School Crime and Safety.


By Christina Yanez and Rebecca Mann, Synergy Enterprises, Inc., and Rachel Hansen, NCES


Reference

Baams, L., Talmage, C., and Russell, S. (2017). Economic Costs of Bias-Based Bullying. School Psychology Quarterly, 32(3): 422–433.