Today, on Women’s Equality Day, we honor the many women who fuel the education sector with their dedication to our nation’s students! But, let’s also remember the many ways women are still striving to overcome inequalities in the workplace.
Women made up the majority of public school teachers (77 percent) and public school principals (54 percent) in 2017–18. While overrepresented in terms of public school positions, women were paid significantly less than their male counterparts.
Background Demographics
Compared to 30 years ago, women made up higher proportions of public school teachers and principals in 2017–18 than in 1987–88. According to data from the 1987–88 Schools and Staffing Survey (SASS), 71 percent of all public school teachers were women. By 2017–18, data from the National Teacher and Principal Survey (NTPS) showed the rate had increased to 77 percent. The percentage of female public school principals more than doubled during the same period, from 25 percent in 1987–88 to 54 percent in 2017–18.
Historically, U.S. school buildings weren’t heavily populated by women. Nearly all teachers were men before “Common Schools”—the precursor to today’s public school system—were introduced in the late 1820s. As the education landscape shifted, so did the composition of the teaching workforce. By the 1890s, more than two-thirds (68 percent) of all public school teachers were women.1
New Depression-era laws in the 1930s—which limited the number of adults in a family who were allowed to work in certain occupations—made it more difficult for married women to stay in the workforce, since a husband often earned more than his wife, even in the same position. Since female public school teachers were the most immediately recognizable example of this law at the local level, married women in education were direct targets of employment discrimination.2 Consequently, the percentage of female teachers dropped from 81 percent in 1930 to 76 percent in 1940.3 Throughout history, this percentage continued to fluctuate as laws readjusted more equitably and more diverse jobs became available to women, although women have always represented more than 50 percent of the teacher workforce.
The Gender Wage Gap: Teachers and Principals (2017–18 NTPS)
According to Bureau of Labor Statistics data, women are paid less than men in nearly all occupations. While the gap for public elementary and secondary teachers is smaller than the average, it still exists.
History tells us that the gender wage gap in elementary and secondary education wasn’t accidental. In fact, it was specifically created to expand the reach of the public education system by Common School reformers who argued that the United States could afford to staff the proposed new schools by adding more female teachers, since schools could pay them less than male teachers.4
Patterns in teacher compensation from the 2017–18 school year show that the average base teaching salary of female public school teachers is less than that of their male counterparts ($55,490 vs. $57,453).5 Comparably, female public school principals also had a lower average salary in 2017–18 than did male principals ($96,300 vs. $100,600).
How does average annual salary vary based on teacher, principal, or school characteristics? (2017–18 NTPS)
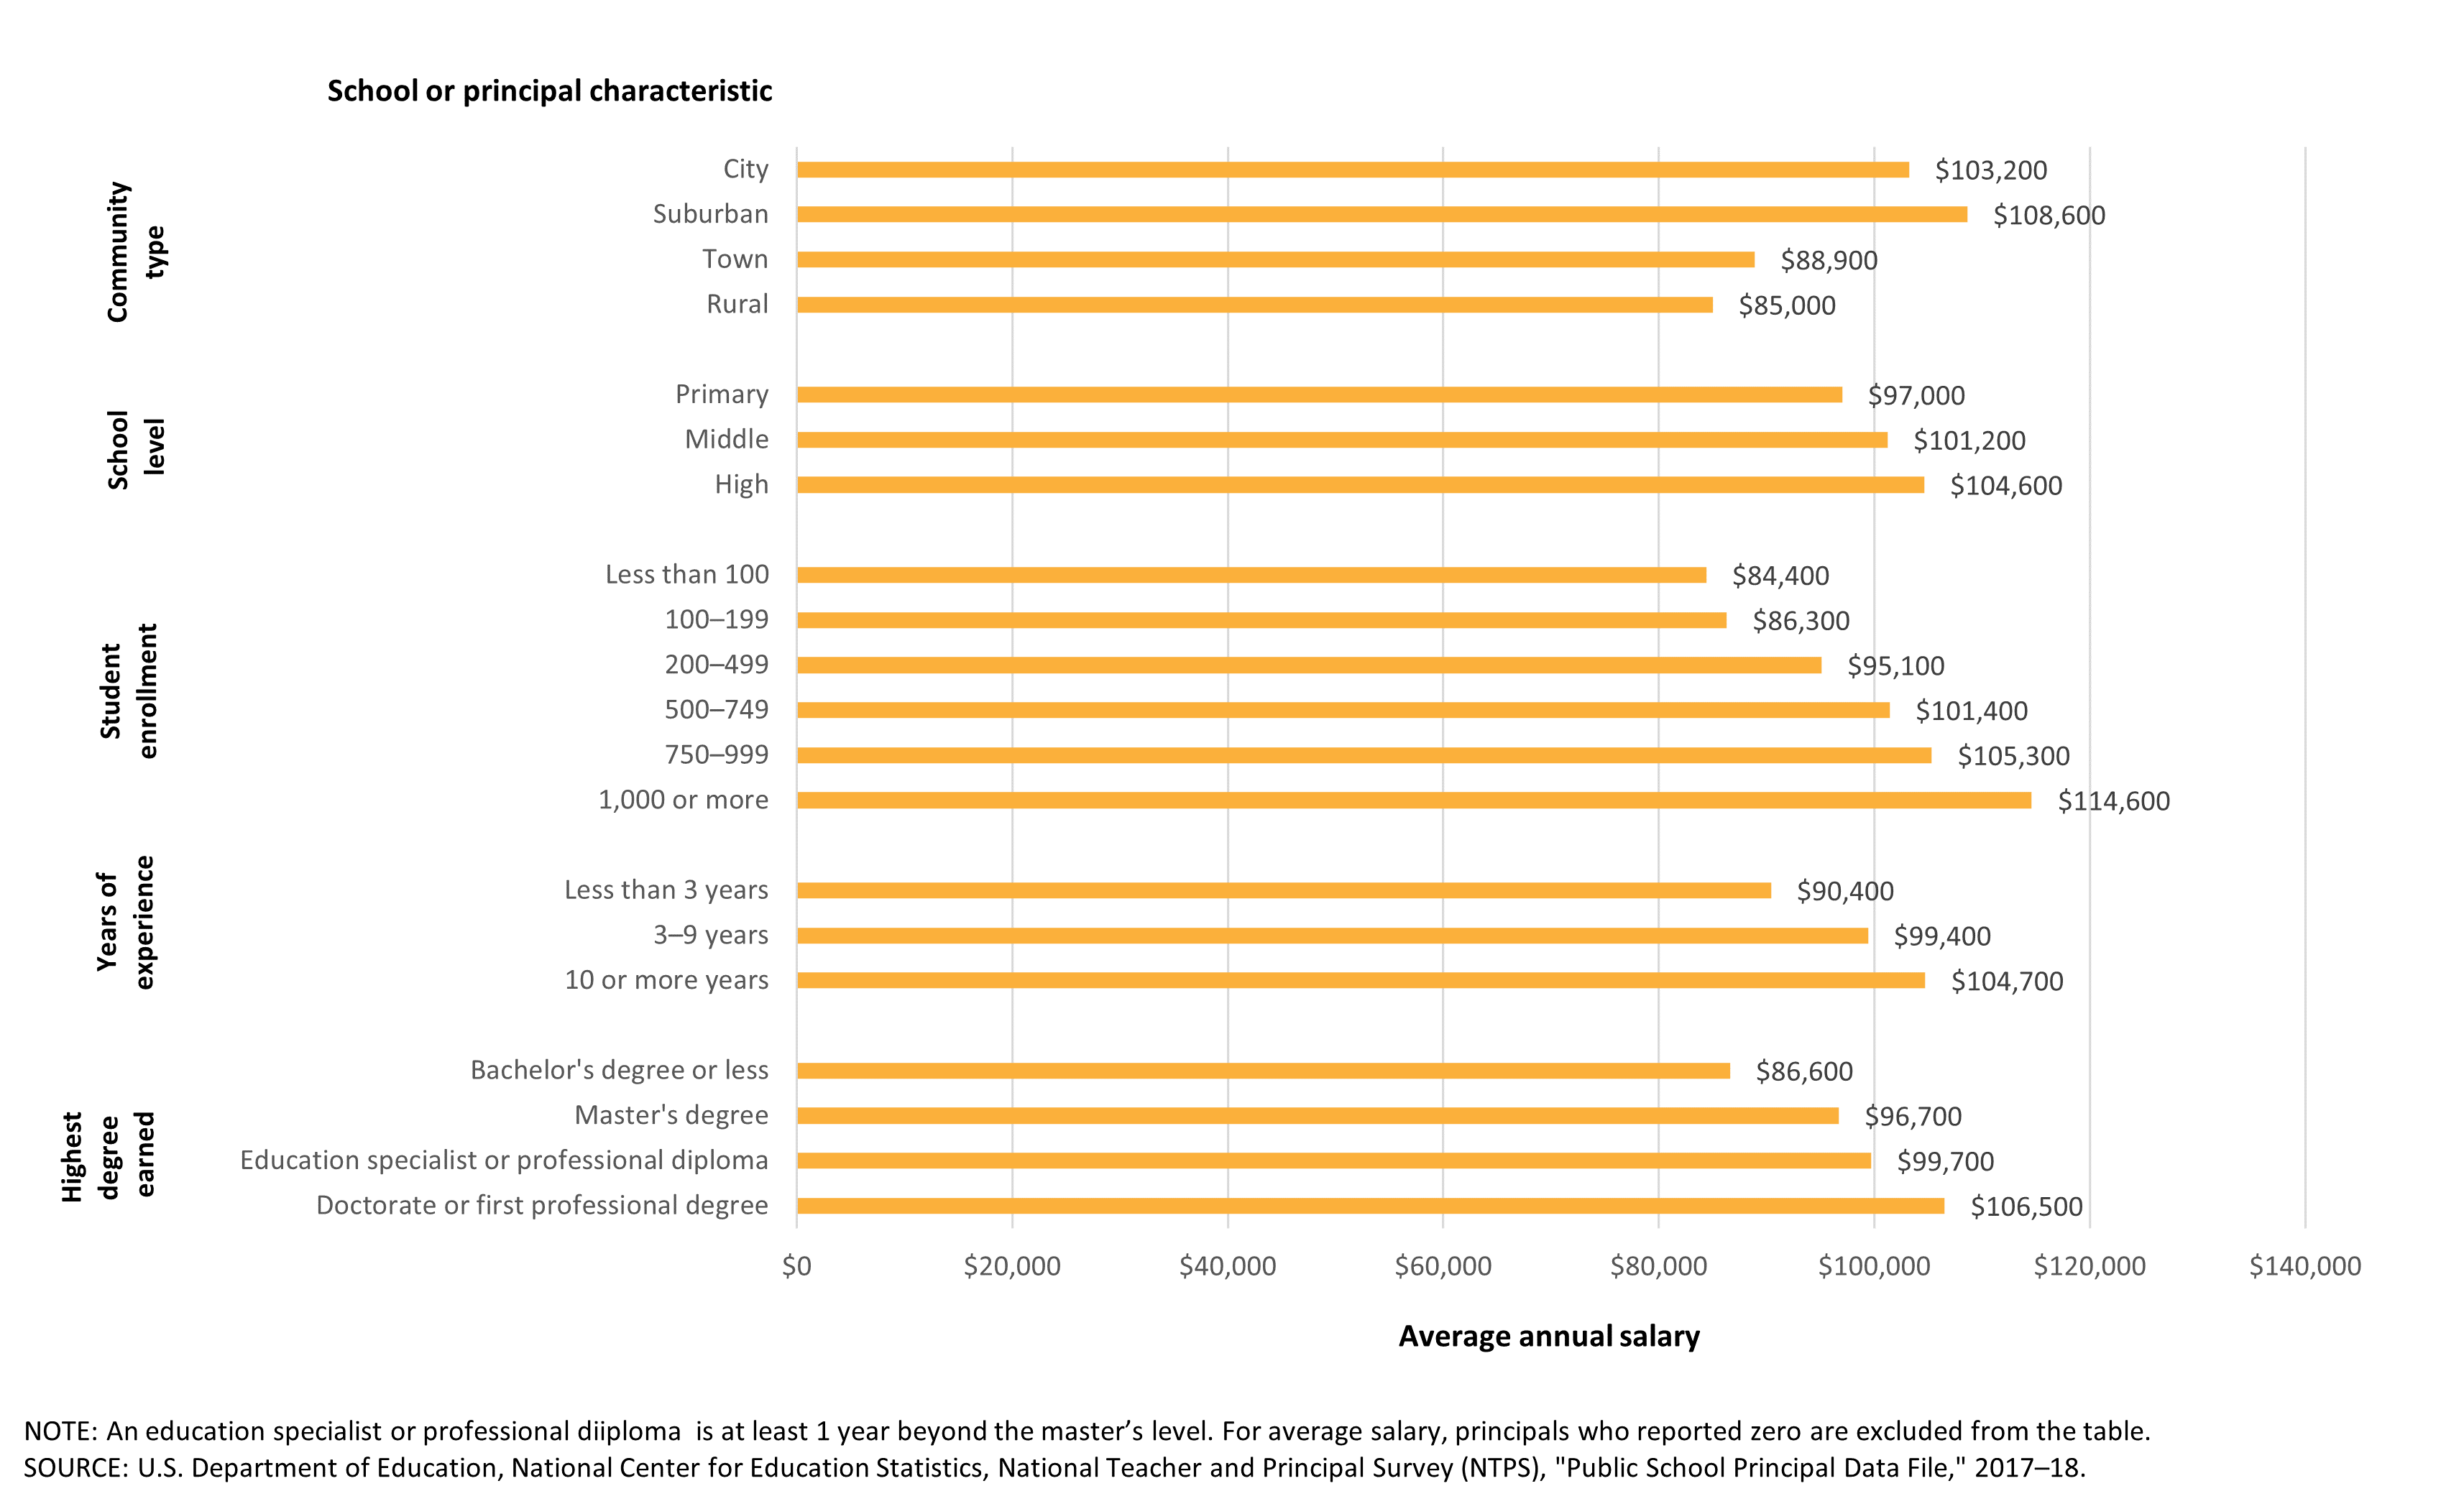
Public school teacher and principal salaries are known to vary by several individual- or school-related characteristics (see figures 1 and 2).
For instance, there are fluctuations in teachers’ and principals’ average annual salary by age, years of experience, and highest degree earned. Salary increases often follow a predictable pattern: older, more experienced, or more highly educated teachers and principals generally earn higher salaries than their younger, less experienced, or less educated counterparts.
Educators are also paid differently based on where they work. Certain school characteristics, such as community type, school level, and school size, can influence teachers’ and principals’ average salaries. In 2017–18, the educators with the highest average annual salary worked in either suburban schools, high schools, or large schools with more than 1,000 enrolled students.
Figure 1. Average annual base teaching salary of regular, full-time public school teachers, by selected school or teacher characteristics: 2017–18
[click figure image to enlarge]
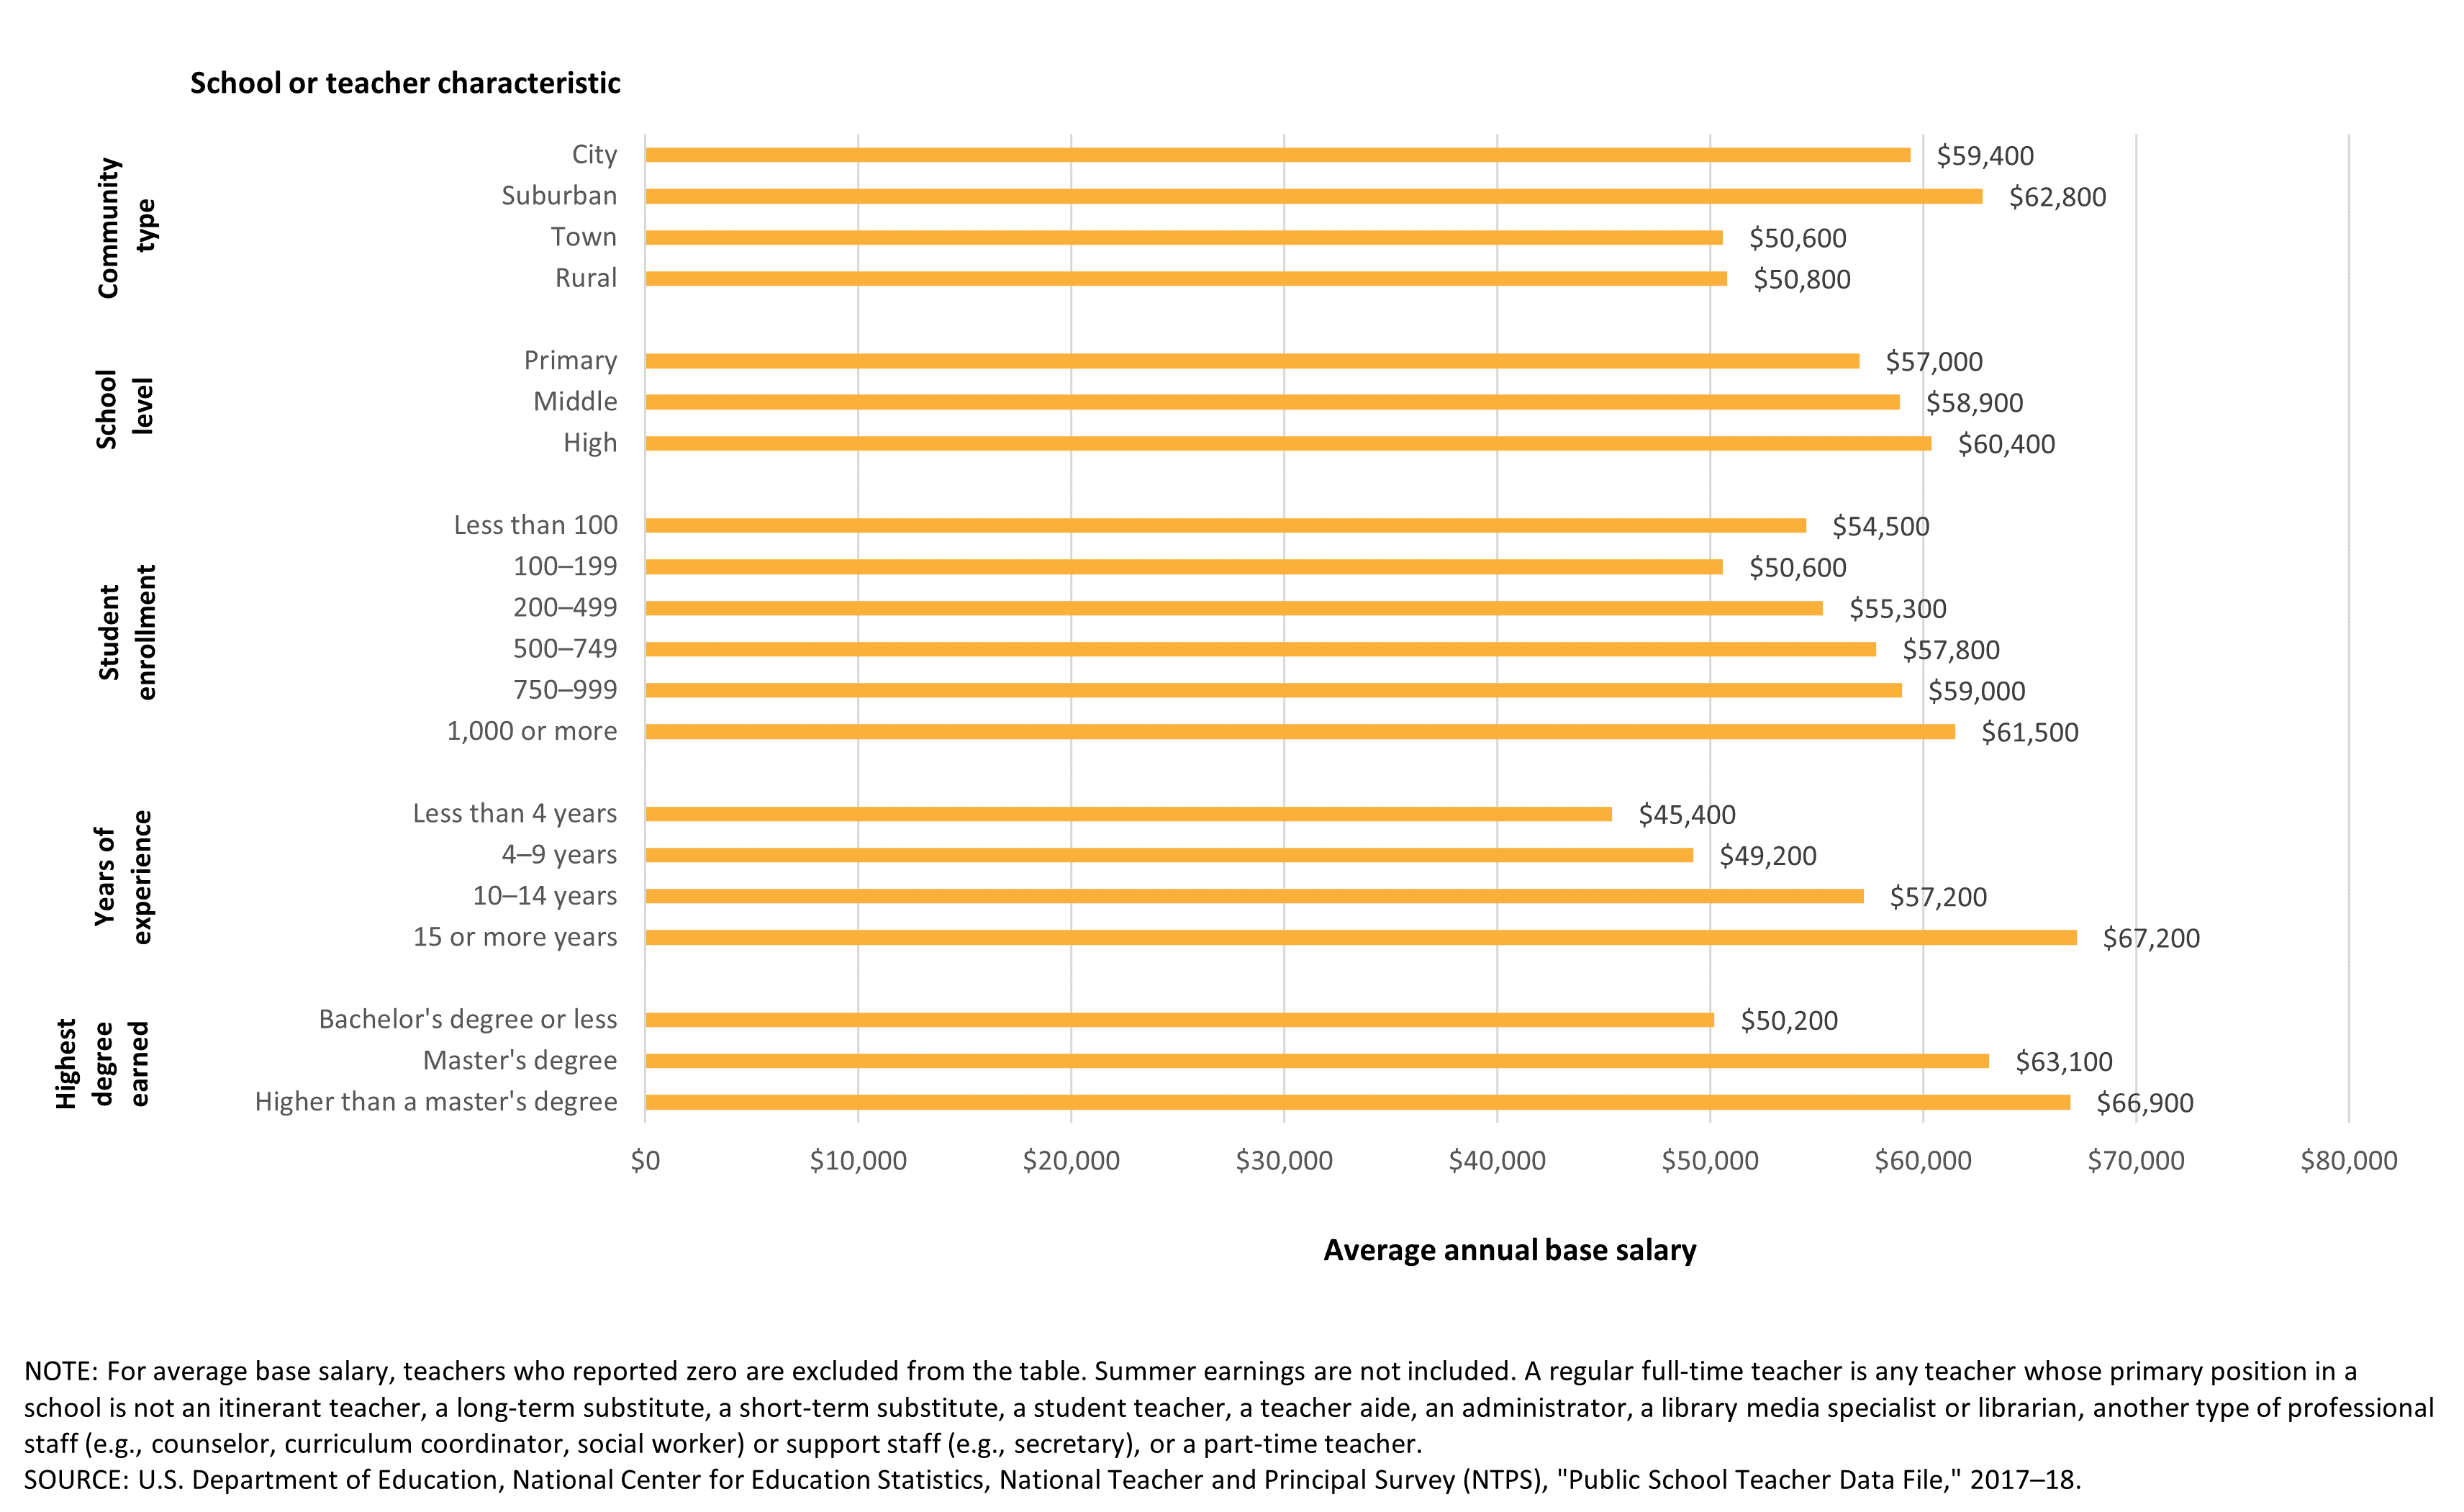
Figure 2. Average annual salary of public school principals, by selected school or principal characteristics: 2017–18
[click figure image to enlarge]
Do teacher, principal, or school characteristics close the gender wage gap? (2017–18 NTPS)
We know that gender differences in average salary can be correlated with other related factors. For example, higher percentages of public primary school teachers (89 percent) and principals (67 percent) than of public middle or high school educators are female. Notably, figures 1 and 2 show that primary school educators earn less on average than their counterparts in middle or high schools. But these other related factors don’t entirely explain the male-female wage gap.
Teachers
Comparing male and female public school teachers who have the same characteristics can, in some situations, narrow the wage gap (see figure 3).
Figure 3. Average base teaching salary of regular, full-time public school teachers, by sex and selected school and teacher characteristics: 2017–18
[click figure image to enlarge]
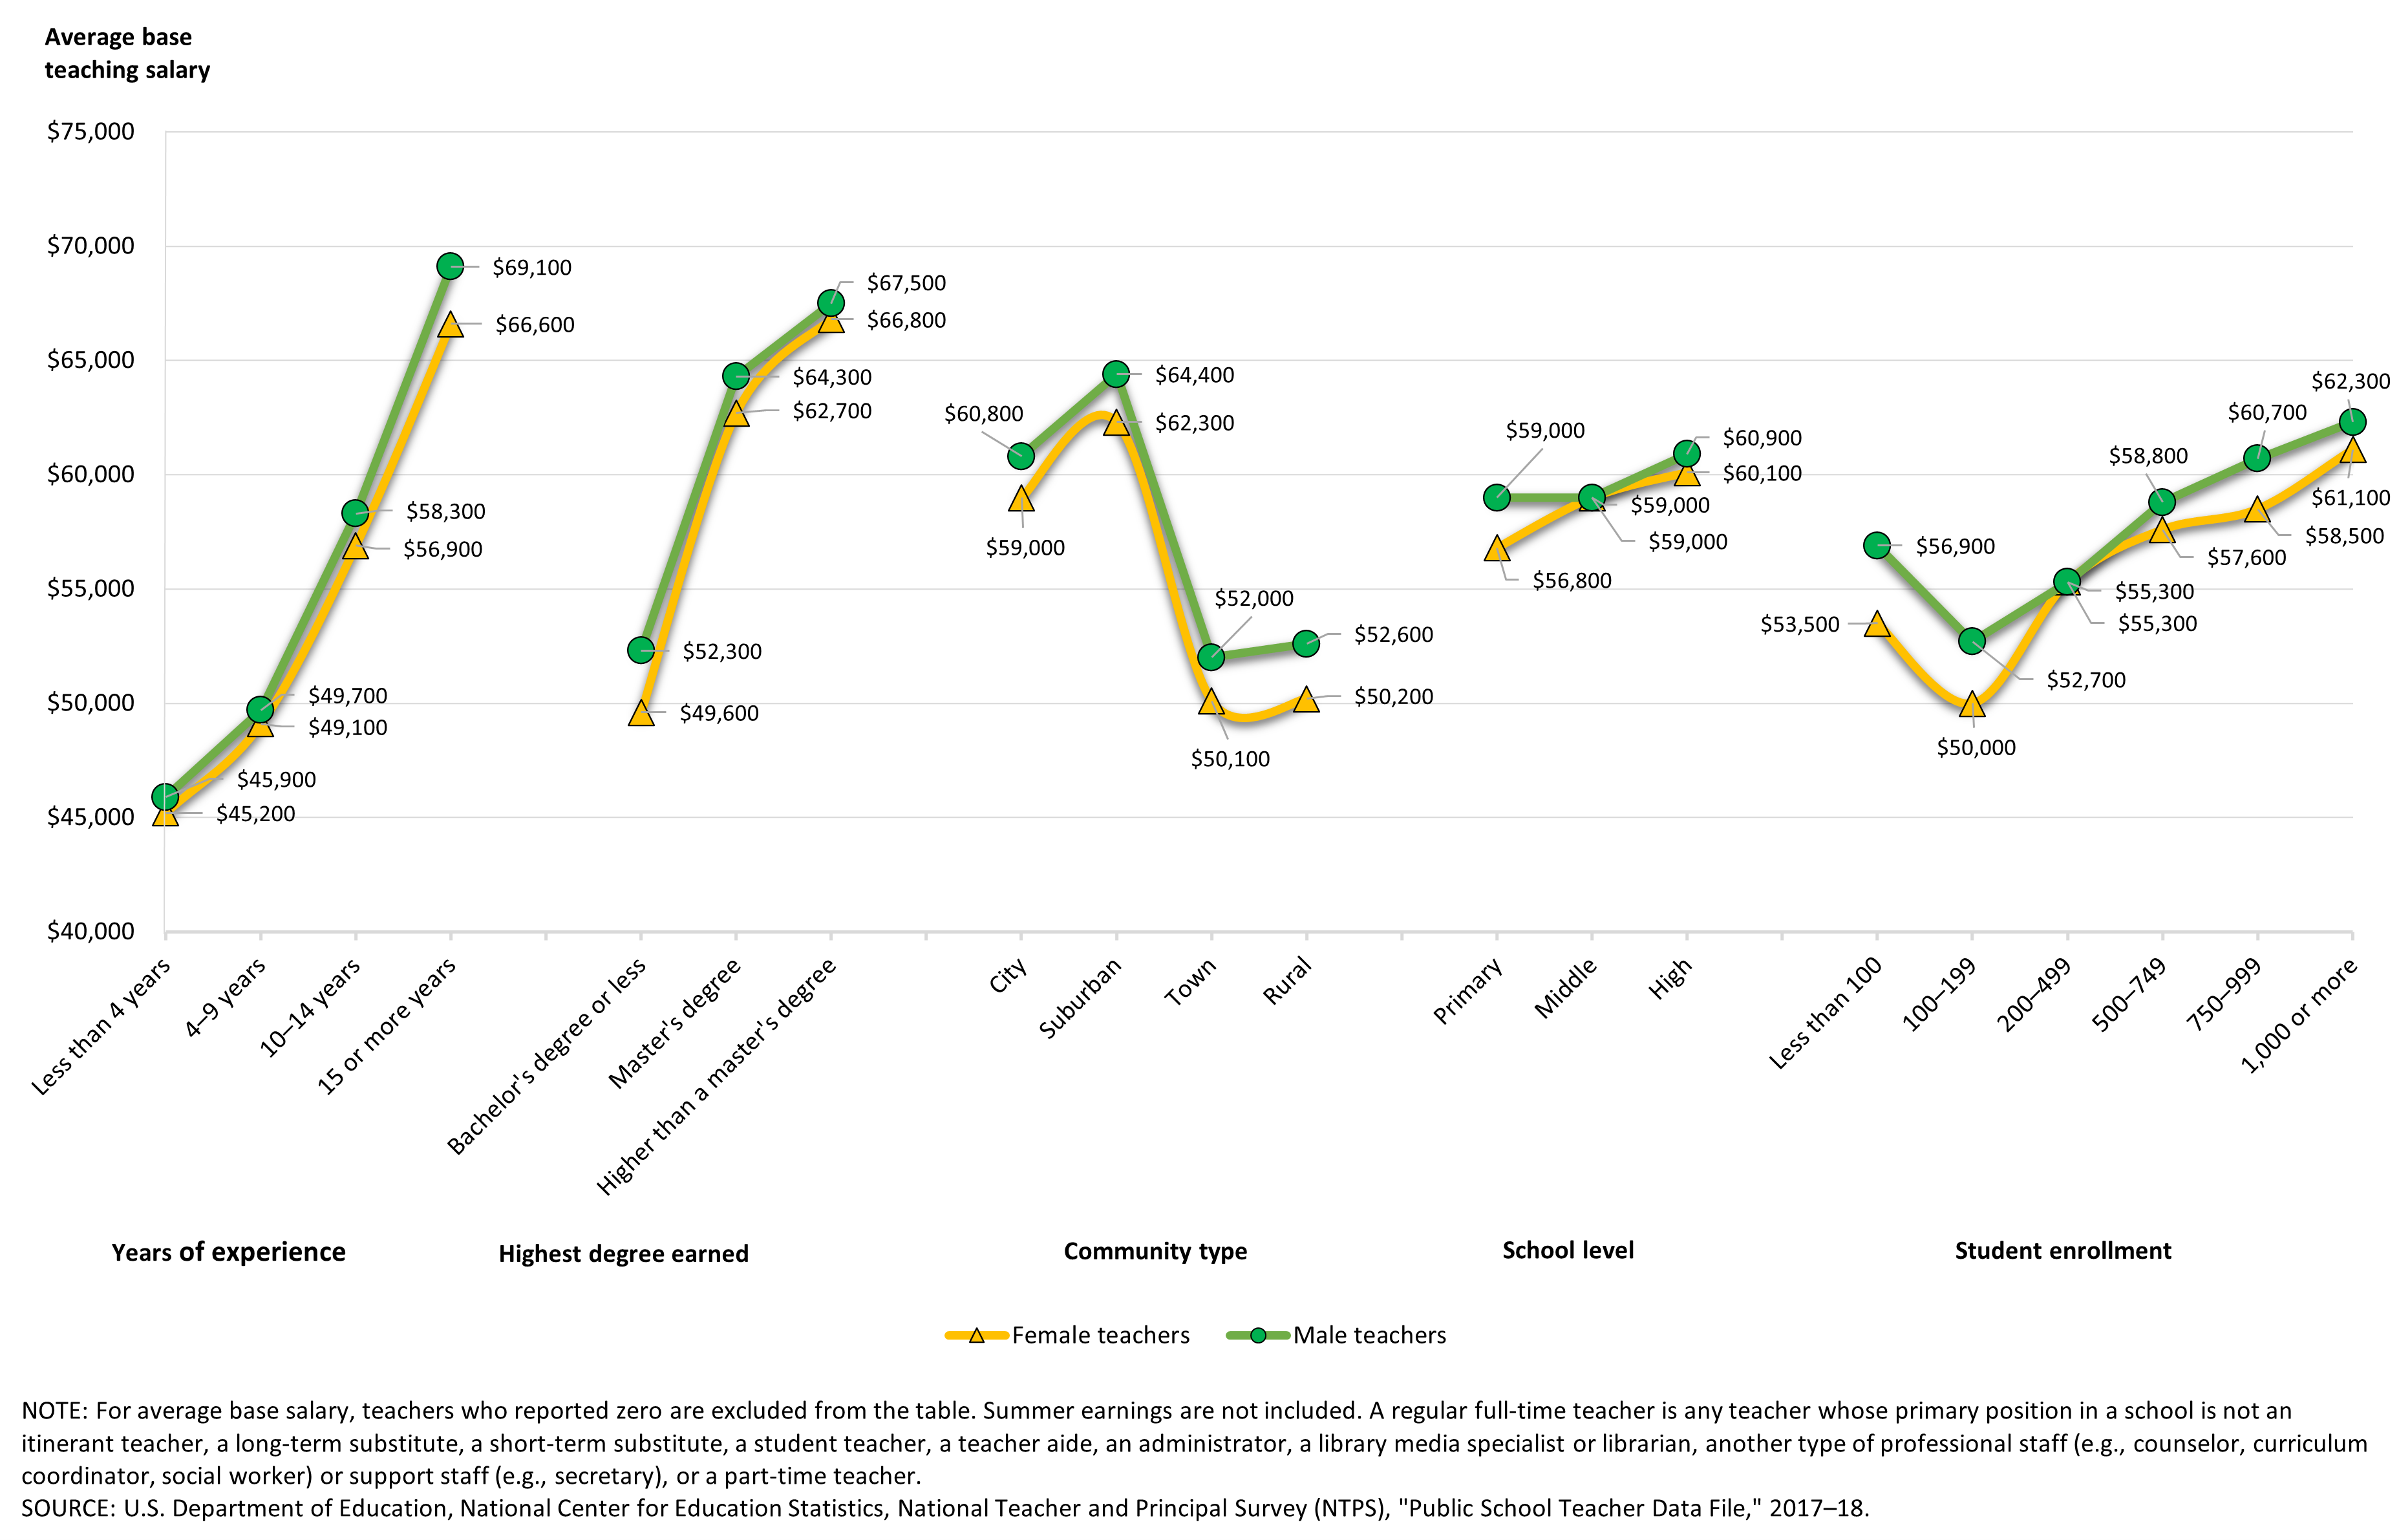
Among teachers who have the same years of experience, salaries among newer teachers are more similar than among more experienced teachers. There is no significant difference in the average base teaching salary between male and female teachers with less than 4 years or 4–9 years of experience. However, the wage gap remains for the most experienced teachers. Female teachers with 10–14 years or 15 or more years of experience had lower average salaries ($56,990 and $66,600, respectively) than their male counterparts with the same amount of experience ($58,300 and $69,100, respectively).
Similarly, female teachers whose highest degree is bachelor’s degree or less or whose highest degree is a master’s degree earn less on average per year ($49,600 and $62,700, respectively) than male teachers with the same amount of education ($52,300 and $64,300, respectively).6 There is no significant difference between the average salaries of male and female teachers who have higher than a master’s degree.
When looking at the data by key school characteristics, the wage gap also shrinks for at least some teachers. As discussed before, average base teaching salaries vary by school level and by school size. When comparing male and female teachers at the same school level, female primary school teachers earn less ($56,800) than male primary school teachers ($59,000). But there is no significant difference in average salaries between male and female middle and high school teachers, nor between male and female teachers who work at the same size schools.
However, gender differences in average base teaching salary remain when school location is the same. In all four community types, female teachers have lower average salaries than their male colleagues: $62,300 vs. $64,400 in suburbs, $59,000 vs. $60,800 in cities, $50,200 vs. $52,600 in rural areas, and $50,100 vs. $52,000 in towns.
Principals
Female principals consistently have lower average annual salaries than male principals, even when controlling for other related factors (see figure 4).
Figure 4. Average annual salary of public school principals, by sex and selected school and principal characteristics: 2017–18
[click figure image to enlarge]
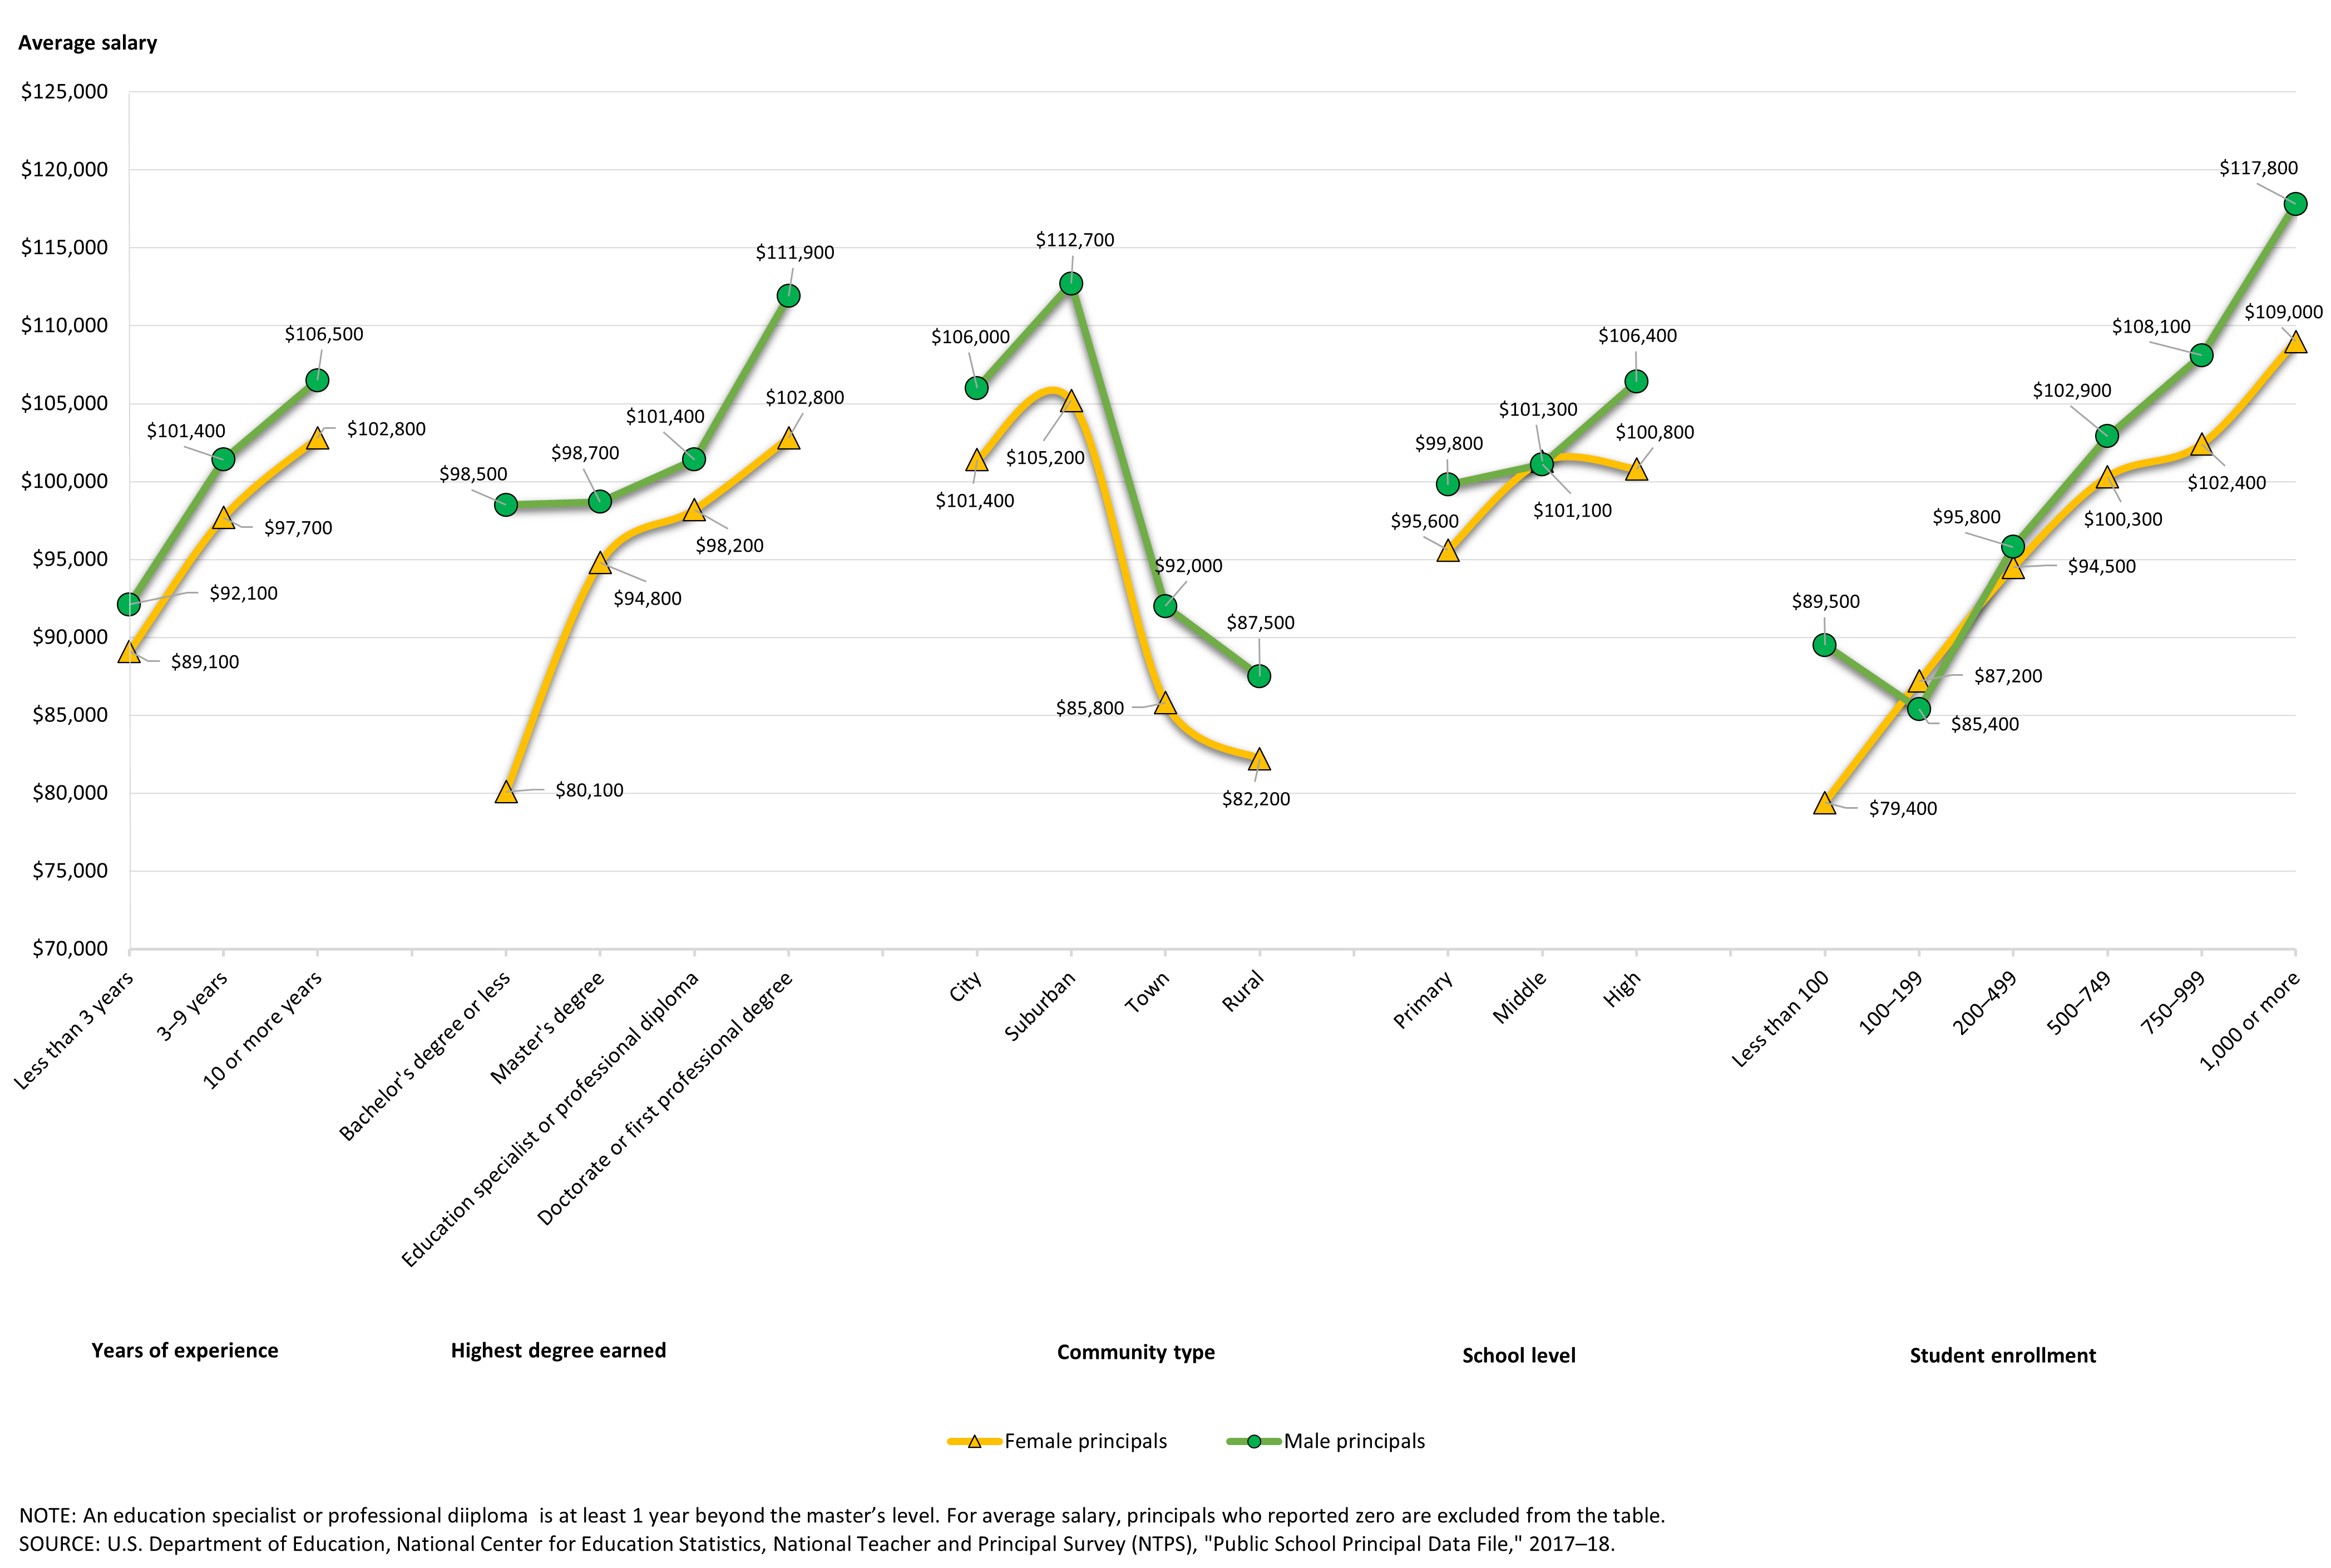
Both the newest and the most experienced female principals are paid significantly less on average than their male peers with the same amount of experience. Similarly, when considering highest degree earned, the data show that female principals are consistently paid less on average than male principals. For example, female principals with a doctorate or first professional degree are paid less on average than male principals with the same education ($102,800 vs. $111,900).
For the most part, principal salaries by gender also remain significantly different when accounting for school characteristics. For example, when considering school location, the data show that female principals have lower average salaries than their male colleagues in all four community types: $105,200 vs. $112,700 in suburbs, $101,400 vs. $106,000 in cities, $85,800 vs. $92,000 in towns, and $82,200 vs. $87,500 in rural areas.
Although there is a lot more to learn about the complex levers that guide educator salaries, the data show that the male-female wage gap is still affecting female educators in many situations.
Because of the NTPS, researchers, policymakers, and other decisionmakers can continue to analyze relationships that may influence the gender salary gap, including state-by-state differences, turnover rates, self-rated evaluation and job satisfaction scales, and data on the self-reported amount of influence an educator has over various school or classroom decisions. Results from the 2020–21 NTPS will be released in fall 2022 and will include information on the impact of the coronavirus pandemic on public and private schools. Whether the gender wage gap changed over the last two school years is to be determined.
Be sure to follow NCES on Twitter, Facebook, LinkedIn, and YouTube and subscribe to the NCES News Flash to receive notifications when these new data are released.
Facts and figures in this blog come from the National Teacher and Principal Survey (NTPS) and its predecessor, the Schools and Staffing Survey (SASS). The NTPS is a primary source of information about K–12 schools and educators across the United States and a great resource for understanding the characteristics and experiences of public and private school teachers and principals.
By Julia Merlin, NCES
[1] The Fifty-Second Congress. (1893). The executive documents of the House of Representatives for the second session of the Fifty-second Congress (Vol. 1). Washington, DC: U.S. Government Printing Office.
[2] Blackwelder, J.K. (1998). Women of the Depression: Caste and Culture in San Antonio, 1929–1939. Texas A&M University Press.
[3] Adams, K.H., and Kenne, M.L. (2015). Women, Art, and the New Deal. McFarland.
[4] Kaestle, C. F. (1983). Pillars of the Republic: Common Schools and American Society: 1780–1860. Macmillan.
[5] For the purpose of this blog post, only regular, full-time teachers are included in any salary calculations. A regular full-time teacher is any teacher whose primary position in a school is not an itinerant teacher, a long-term substitute, a short-term substitute, a student teacher, a teacher aide, an administrator, a library media or librarian, another type of professional staff (e.g., counselor, curriculum coordinator, social worker) or support staff (e.g., secretary), or a part-time teacher. For average base salary, teachers who reported zero are excluded from analysis. Summer earnings are not included.
[6] Notably, most teachers have earned a bachelor’s (39 percent) or a master’s (49 percent) degree as their highest level of education. The percentage distribution of teachers whose highest degree earned is a bachelor’s or a master’s degree does not meaningfully differ by gender.