IES Blog

Institute of Education Sciences

Differences in Postsecondary Persistence by Student and School Characteristics

By Cris de Brey

About 70 percent of first-time postsecondary students who started at 2-year or 4-year colleges in 2011-12 were either still enrolled or had attained a degree or certificate three years later. But a recent spotlight in the Condition of Education shows that there are differences in postsecondary persistence based on the type of institution attended and student demographics. 

Given the economic and employment benefits of postsecondary education, it’s important that students who enroll in postsecondary education persist to degree completion. Persistent students are those that were enrolled at any institution or had attained a degree or certificate 3 years after first enrolling. The spotlight uses data from the Beginning Postsecondary Students Longitudinal Study and focuses on differences in persistence rates by demographic and college or university characteristics.

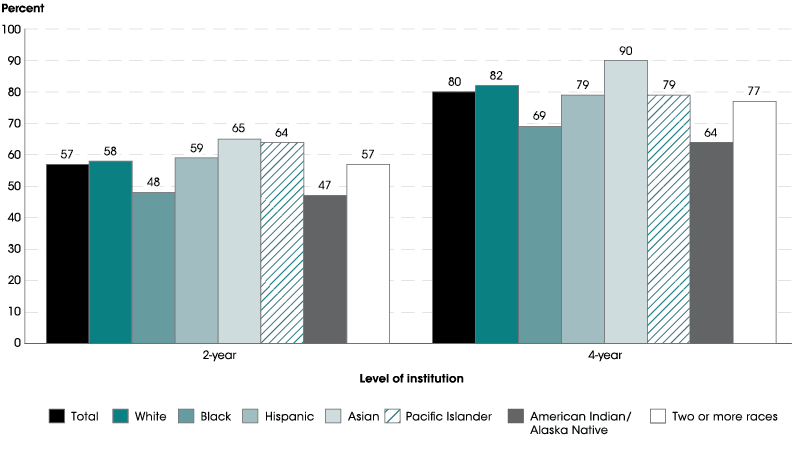
In spring 2014, the persistence rate for students who began at 2-year institutions in 2011–12 was 23 percentage points lower than for students who began at 4-year institutions (see Figure 1).


Figure 1. Persistence rates of first-time postsecondary students who began at 2- and 4-year institutions during the 2011–12 academic year, by race/ethnicity: Spring 2014
NOTE: Race categories exclude persons of Hispanic ethnicity. Students who first enrolled during the 2011–12 academic year are considered to have persisted if they were enrolled at any institution in Spring 2014 or had attained a degree or certificate by that time.
SOURCE: U.S. Department of Education, National Center for Education Statistics, 2012/14 Beginning Postsecondary Students Longitudinal Study (BPS:12/14). See Digest of Education Statistics 2016, table 326.50.


A gap between persistence rates at 2- and 4-year institutions was also observed for students who were White, Black, Hispanic, Asian, and of Two or more races. The difference in persistence rates between students who began at 2- and 4-year institutions ranged from 19 percentage points for Hispanic students to 25 percentage points for White students and Asian students.

Among students who began at 4-year institutions, Asian students had a higher persistence rate as of spring 2014 than White students. Both Asian and White students had a higher persistence rate than Hispanic, Black, and American Indian/Alaska Native students.

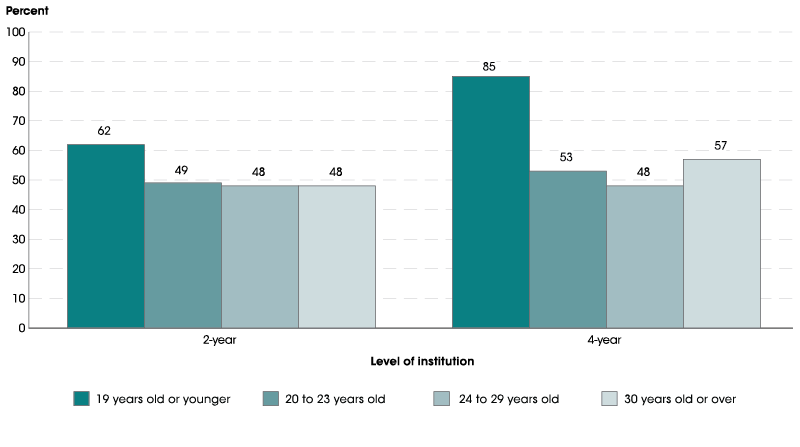
Looking at age differences, the persistence rate for students who were 19 years old or younger was higher than the rates for older students who began at both 2-year and 4-year institutions (see Figure 2).


Figure 2. Persistence rates of first-time postsecondary students who began at 2- and 4-year institutions during the 2011–12 academic year, by age when first enrolled: Spring 2014
NOTE: Students who first enrolled during the 2011–12 academic year are considered to have persisted if they were enrolled at any institution in Spring 2014 or had attained a degree or certificate by that time.
SOURCE: U.S. Department of Education, National Center for Education Statistics, 2012/14 Beginning Postsecondary Students Longitudinal Study (BPS:12/14). See Digest of Education Statistics 2016, table 326.50.


There was no measurable difference between the persistence rates for the oldest three age groups who began at either type of institution.

The persistence rate for students 19 years old or younger who began at 2-year institutions was 24 percentage points lower than the rate for their same-aged peers who began at 4-year institutions. Unlike the youngest students, there were no measurable differences in persistence rates by level of institution for students who began their postsecondary education when they were 20 to 23 years old, 24 to 29 years old, and 30 years old or over.

For more information on postsecondary persistence rates, see the full spotlight on this topic in the Condition of Education. 

Data on New Topics in the School Survey on Crime and Safety Shed Light on Emerging Areas of Interest

By Rachel Hansen, NCES; and Melissa Diliberti and Jana Kemp, AIR

For more than 15 years, the National Center for Education Statistics has administered the School Survey on Crime and Safety (SSOCS) to provide timely, high-quality data on crime and safety in U.S. public schools. Information collected on SSOCS includes the frequency and nature of crime; disciplinary actions; crime prevention and the involvement of law enforcement; and challenges to reducing and preventing crime. Conducted with a nationally representative sample of public schools, the sixth, and most recent, administration of SSOCS took place during the 2015–16 school year. The first report highlighting key findings from that survey was released in 2017.

For the 2015–16 survey, we included new and expanded questions on several topics to address emerging policy issues and to identify common practices in school safety, including:

  • School law enforcement, including questions on how schools involve sworn law enforcement officers in daily activities and whether schools outline the responsibilities of these officers at school. For instance, one new item asks whether law enforcement officers routinely wear a body camera, while another item asks if the school has a formalized policy defining officers’ use of firearms while at school;
  • Preventative measures used in public schools, including new questions on more recent security practices. For example, one new item asks schools to report whether they have a threat assessment team to identity students who might be a potential risk for violent or harmful behavior;
  • Preparations for crisis situations, such as whether schools drill students on the use of evacuation, lockdown, and shelter-in-place procedures. Other new items ask whether schools have panic buttons that directly connect to law enforcement and whether they have classroom doors that can be locked from the inside;
  • Student involvement in crime prevention, such as whether schools use peer mediation, student court, restorative circles, or social emotional learning training for students as part of a formal program intended to prevent or reduce violence; and
  • Staff training in discipline policies and practices, including those related to bullying and cyberbullying or strategies for students displaying signs of mental health disorders.

While previous administrations of SSOCS have asked schools to report the number of hate crimes that occurred during a given school year, the 2015–16 questionnaire asked schools to also report the bias (e.g., national origin or ethnicity, gender identity, etc.) that may have motivated these hate crimes. For the first time, the SSOCS questionnaire also asked schools to report the number of arrests that occurred at school.

In addition to these new and expanded questions, SSOCS continues to collect detailed information on schools’ safety practices, the number and type of crime incidents (e.g., sexual assault, physical attack or fight) that occur at school, and the extent to which schools involve law enforcement, parents, and other community groups in their efforts to reduce and prevent crime. To allow for trend comparisons, many items included on SSOCS questionnaires have remained consistent between survey administrations.

Due to the sensitive nature of SSOCS data, researchers must apply for a restricted-use license to access the SSOCS:2016 restricted-use data file. A public-use data file, with some variables removed, was released in March of 2018. Public-use data files from previous SSOCS administrations are also available on the SSOCS website and in DataLab


What is the difference between the ACGR and the AFGR?

By Joel McFarland

NCES and the Department of Education have released national and state-level Average Cohort Graduation Rates for the 2015-16 school year. You can see the data on the NCES website (as well as data from 2010-11 through 2015-16).

In recent years, NCES has released two widely-used annual measures of high school completion: the Adjusted Cohort Graduation Rate (ACGR) and the Averaged Freshman Graduation Rate (AFGR). Both measure the percent of public school students who attain a regular high school diploma within 4 years of starting 9th grade. However, they also differ in important ways. This post provides an overview of how each measure is calculated and why they may result in different rates.

What is the Adjusted Cohort Graduation Rate (ACGR)?

The ACGR was first collected for 2010-11 and is a newer graduation rate measure. To calculate the ACGR, states identify the “cohort” of first-time 9th graders in a particular school year, and adjust this number by adding any students who transfer into the cohort after 9th grade and subtracting any students who transfer out, emigrate to another country, or pass away. The ACGR is the percentage of the students in this cohort who graduate within four years. States calculate the ACGR for individual schools and districts and for the state as a whole using detailed data that track each student over time. In many states, these student-level records have become available at a state level only in recent years. As an example, the ACGR formula for 2012-13 was calculated like this:

Average Cohort Graduation Rate calculation

What is the Averaged Freshman Graduation Rate (AFGR)?

The AFGR uses aggregate student enrollment data to estimate the size of an incoming freshman class, which is compared to the number of high school diplomas awarded 4 years later. The incoming freshman class size is estimated by summing 8th grade enrollment in year one, 9th grade enrollment for the next year, and 10th grade enrollment for the year after, and then dividing by three. The averaging of the enrollment counts helps to smooth out the enrollment bump typically seen in 9th grade. The AFGR estimate is less accurate than the ACGR, but it can be estimated as far back as the 1960s since it requires only aggregate annual counts of enrollment and graduate data. As an example, the AFGR formula for 2012-13 was:

Average Freshman Graduation Rate calculation

Why do they produce different rates?

There are several reasons the AFGR and ACGR do not match exactly.

  • The AFGR’s estimate of the incoming freshman class is fixed, and is not adjusted to account for students entering or exiting the cohort during high school. As a result it is very sensitive to migration trends. If there is net out-migration after the initial cohort size is estimated, the AFGR will understate the graduation rate relative to the ACGR. If there is net in-migration, the AFGR will overstate the graduation rate;
  • The diploma count used in the AFGR includes any students who graduate with a regular high school diploma in a given school year, which may include students who took more or less than four years to graduate. The ACGR includes only those students who graduate within four years of starting ninth grade. This can cause the AFGR to be inflated relative to the ACGR; and
  • The AFGR’s averaged enrollment base is sensitive to the presence of 8th and 9th grade dropouts. Students who drop out in the 8th grade in one year are not eligible to be first-time freshmen the next year, but are included in the calculation of the AFGR enrollment base. At the same time, 9th grade dropouts should be counted as first-time 9th graders, but are excluded from the 10th grade enrollment counts used in the AFGR enrollment base. Since more students typically drop out in 9th grade than in 8th grade, the overall impact is likely to underestimate the AFGR enrollment base relative to the true ACGR cohort.

At the national level, these factors largely balance out, and the AFGR closely tracks the ACGR. For instance, in 2012-13, there was less than one percentage point difference between the AFGR (81.9%) and the ACGR (81.4%). At the state level, especially for small population subgroups, there is often more variation between the two measures.

On the NCES website you can access the most recently available data for each measure, including 2016-17 adjusted cohort graduation rates and 2012-13 averaged freshman graduation rates. You can find more data on high school graduation and dropout rates in the annual report Trends in High School Dropout and Completion Rates in the United States.

This blog was originally posted on July 15, 2015 and was updated on February 2, 2016, December 4, 2017, and January 24, 2019.

A Fresh Look at Homeschooling in the U.S.

By Sarah Grady

From 1999 to 2012, the percentage of students who were homeschooled doubled, from an estimated 1.7 percent to 3.4 percent. But that increase appears to have leveled off, according to newly released data. In 2016, about 1.7 million students (ages 5-17) were estimated to be homeschoolers, which translates to about 3.3 percent of all K-12 students. This rate is not statistically different from the percentage in 2012.


* Statistically adjusted
SOURCE: U.S. Department of Education, National Center for Education Statistics, Parent Survey of the National Household Education Surveys Program (NHES), 1999; Parent and Family Involvement in Education Survey of the NHES, 2003, 2007, 2012, and 2016.


These data come from the recently released First Look report on the Parent and Family Involvement in Education (PFI) survey from the National Household Education Surveys Program (NHES). In this survey, parents were asked a number of questions about their child’s education. Using these data, NCES is able to identify students who are schooled at home instead of school for some or all classes.[1]

So, why did parents say they homeschooled their kids? The most important reason for homeschooling in 2016 was “concern about the school environment, such as safety, drugs, or negative peer pressure,” reported by 34 percent of parents of homeschooled students. (This was also the most commonly reported reason selected by parents in 2012.)  Other reasons cited as most important by families of homeschooled students in 2016 were dissatisfaction with academic instruction at other schools (17 percent of homeschooled students’ parents) and a desire to provide religious instruction (16 percent).

The PFI survey is uniquely suited to collect data about homeschooled students because it collects data from households rather than schools or other institutions. It includes a suite of surveys designed to capture data related to learning at all ages and is ideal for trend analyses because of the repeated measures over time. The NHES:2016 First Look report for the PFI data also provides key estimates related to school communication with parents, homework, parents’ involvement in their students’ education, and homeschooling. The data will be available to researchers in the coming months. Check the NHES website for updates.


[1]Students who are homeschooled primarily because of a temporary illness and students who attend school for more than 25 hours per week are not counted in NCES’s estimate of homeschooling.  

New Data Explore Adults’ Nondegree Credentials

By Lisa Hudson

Despite a national interest in nondegree credentials—such as postsecondary certificates, occupational certifications, and occupational licenses—there hasn’t been comprehensive, national data on these programs. However, a new report from NCES fills this gap using data from our new Adult Training and Education Survey (ATES).

These data show that 27 percent of adults have a nondegree credential and that 21 percent have completed a work experience program (such as an apprenticeship or internship). The ATES data also show that the completion of degree programs and nondegree programs are related. For example, having a certification or license is more common among adults who have a college degree than among adults with lower levels of education.  

The ATES is one component of the NCES National Household Education Surveys Program (NHES), which collects information on education-related topics that cannot be addressed through school-based surveys. It includes a suite of surveys designed to capture data related to learning at all ages. This most recent NHES administration, conducted from January to September 2016, was the first administration of the ATES. This survey was completed by a national sample of about 47,700 adults between the ages of 16 and 65.

The data show that nondegree credentialing and work experience programs are particularly common in the health care field. In fact, health care was the most common field in which both certifications and licenses were held, and the most common field for which adults had completed a work experience program.

The ATES also found that adults perceive nondegree credentials to be useful for many labor market outcomes. For example, 82 percent of adults who have a certification or license reported that it was very useful for “getting a job”, 81 percent reported that it was very useful for “keeping you marketable to employers or clients”, and 66 percent reported it that was very useful for “improving your work skills” (see figure). 

The ATES data will be available to researchers in the coming months. Check the NHES website for updates.