The NTPS is a great resource for educators looking to better understand the characteristics and experiences of their professional communities both nationally and by state (using the NTPS State Dashboard). The NTPS collects information about school conditions and the demographics of public and private school teachers and principals, providing data that policymakers and researchers use to inform funding and other decisions.
In honor of American Education Week, here are some selected facts and figures about U.S. public schools from the NTPS (note that these data were collected prior to the coronavirus pandemic).
Figure 1. Average class size in U.S. public schools, by class type and school level: 2017–18
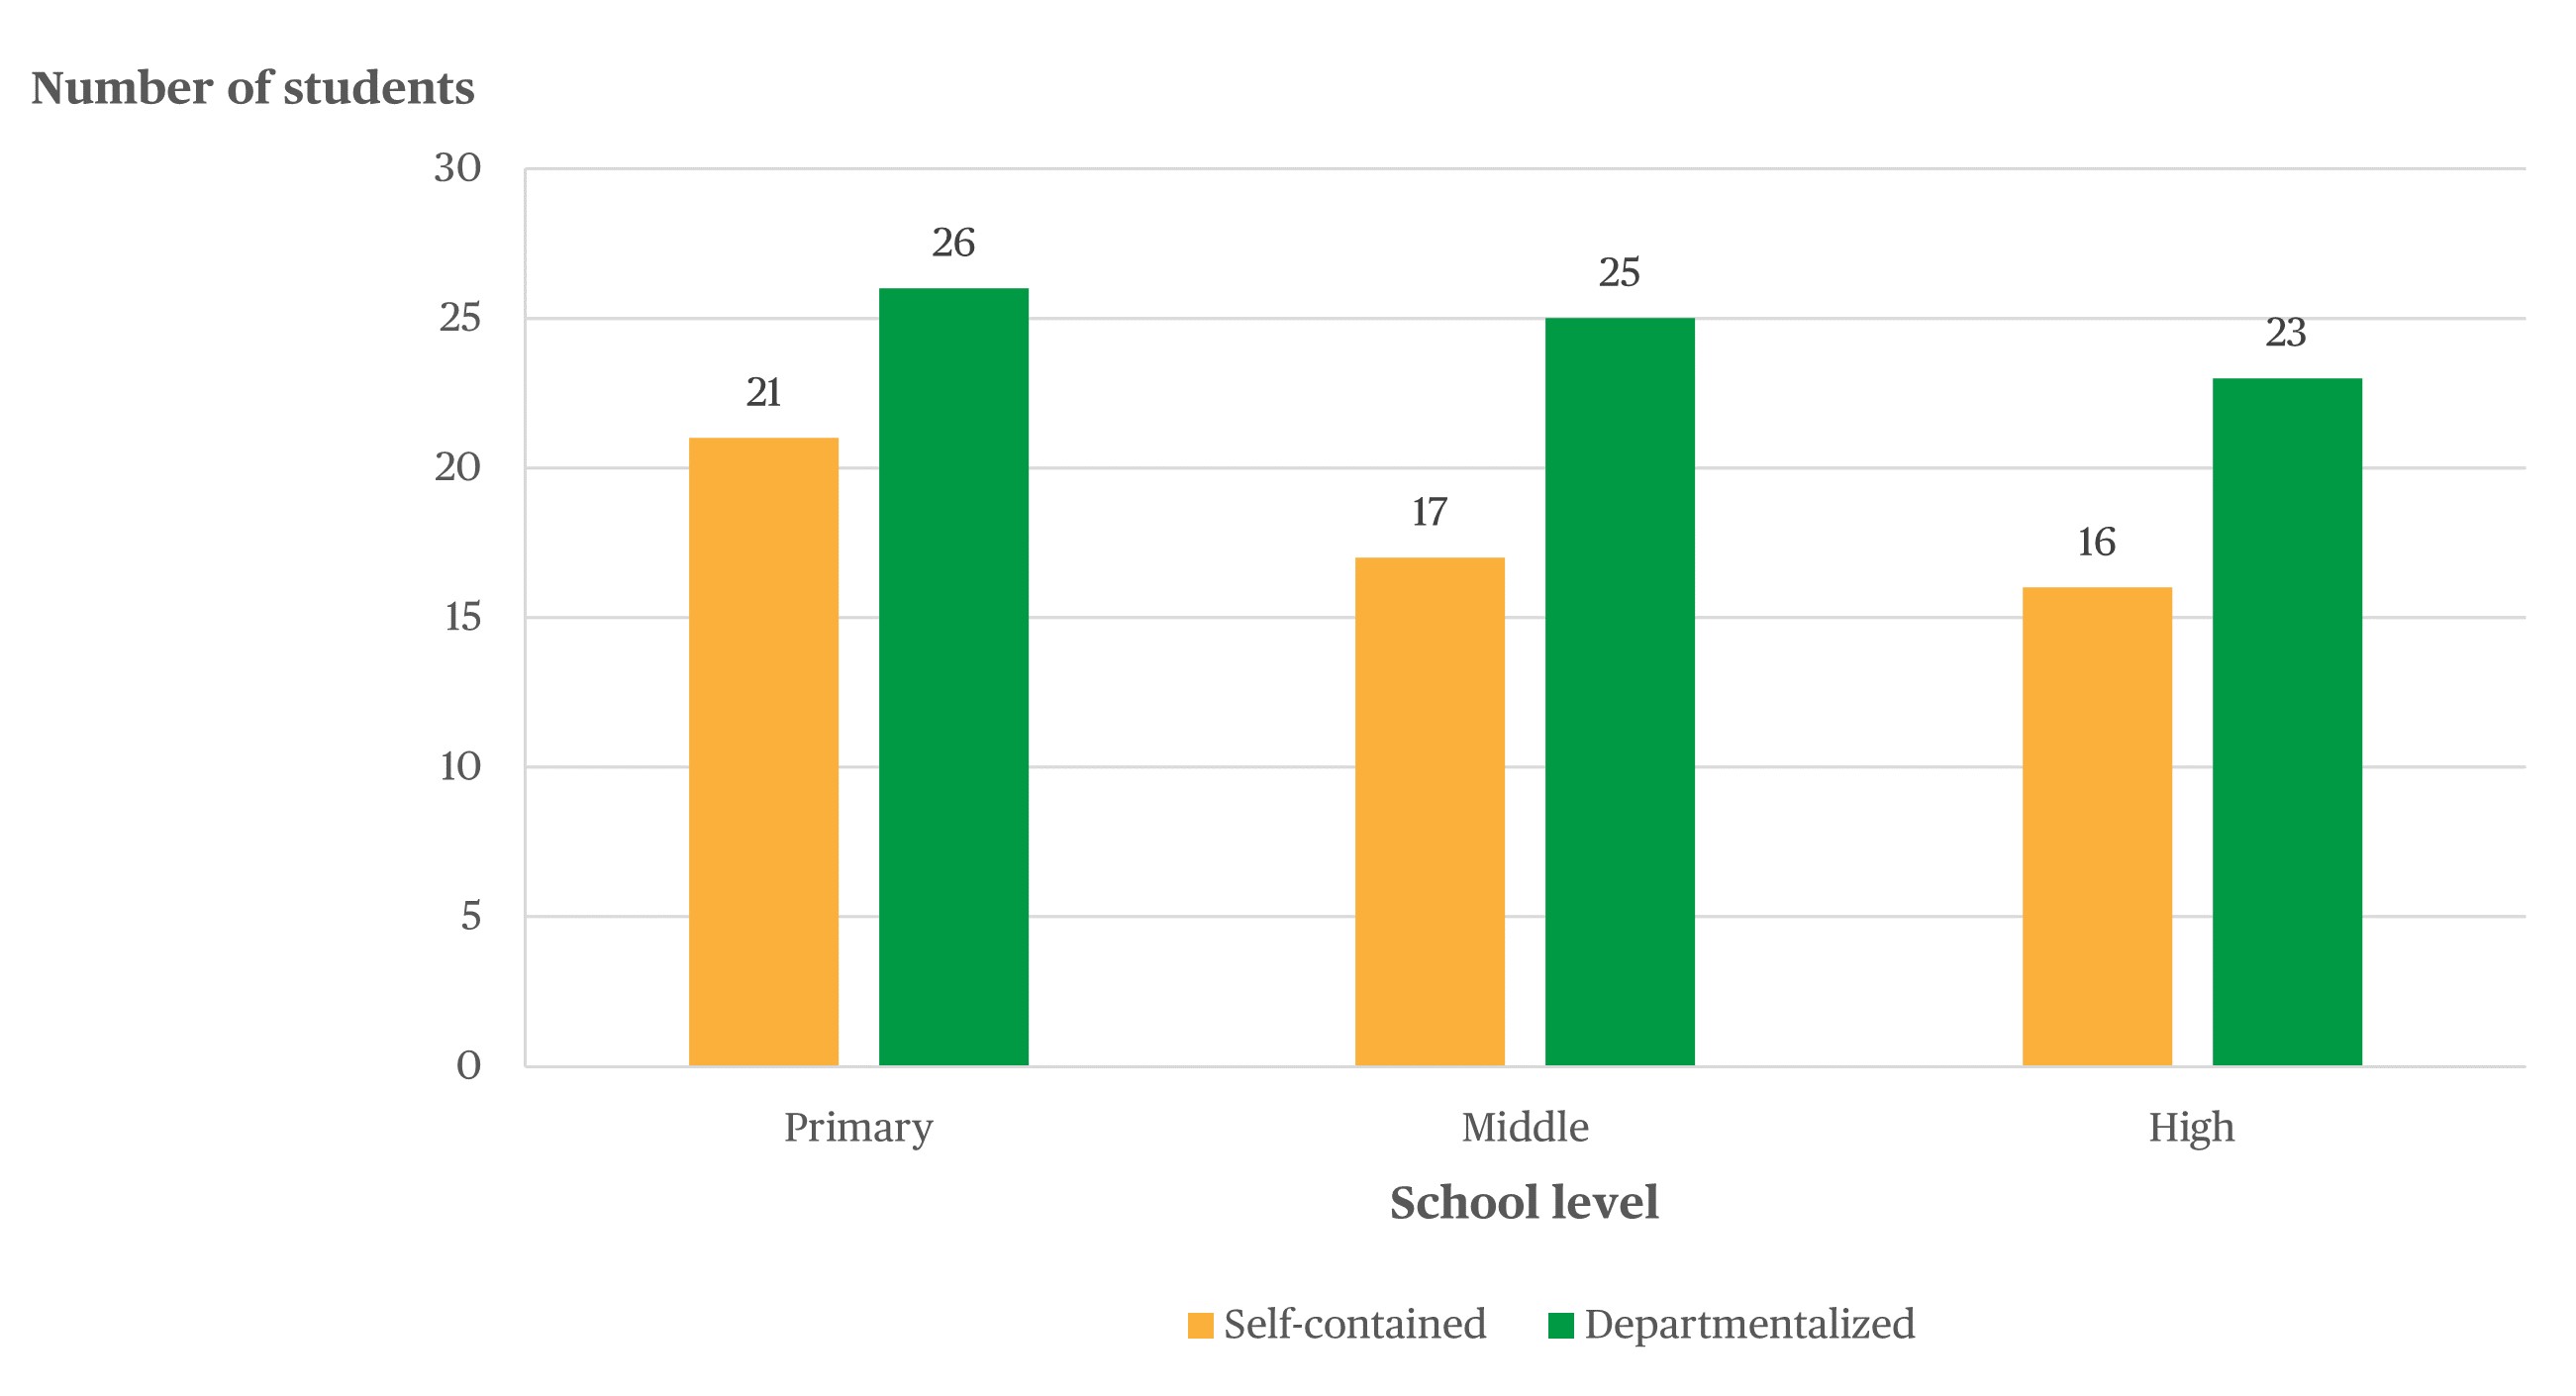
NOTE: Self-contained classes are defined as instruction to the same group of students all or most of the day in multiple subjects. Departmentalized instruction is defined as instruction to several classes of different students most or all of the day in one or more subjects. Among all public school teachers, 25 percent teach self-contained classes in primary schools, 1 percent do so in middle schools, and 1 percent do so in high schools; 8 percent teach departmentalized classes in primary schools, 14 percent do so in middle schools, and 24 do so percent in high schools; and 15 percent teach other types of classes, such as elementary subject specialist classes, team-taught classes, and "pull-out" or "push-in" classes in primary schools, 3 percent do so in middle schools, and 3 percent do so in high schools.
SOURCE: U.S. Department of Education, National Center for Education Statistics, National Teacher and Principal Survey (NTPS), "Public School Teacher Data File," 2017–18.
AEW Day 2: Parent Involvement in U.S. Public Schools (2017–18 NTPS)
The National Parent Teacher Association reports that “the most accurate predictors of student achievement in school are not family income or social status, but the extent to which the family . . . becomes involved in the child’s education at school.”[2]
- Most U.S. public schools offered at least one opportunity for parents and/or guardians to participate in an event or activity at their child’s school, such as parent-teacher conferences and back-to-school nights.
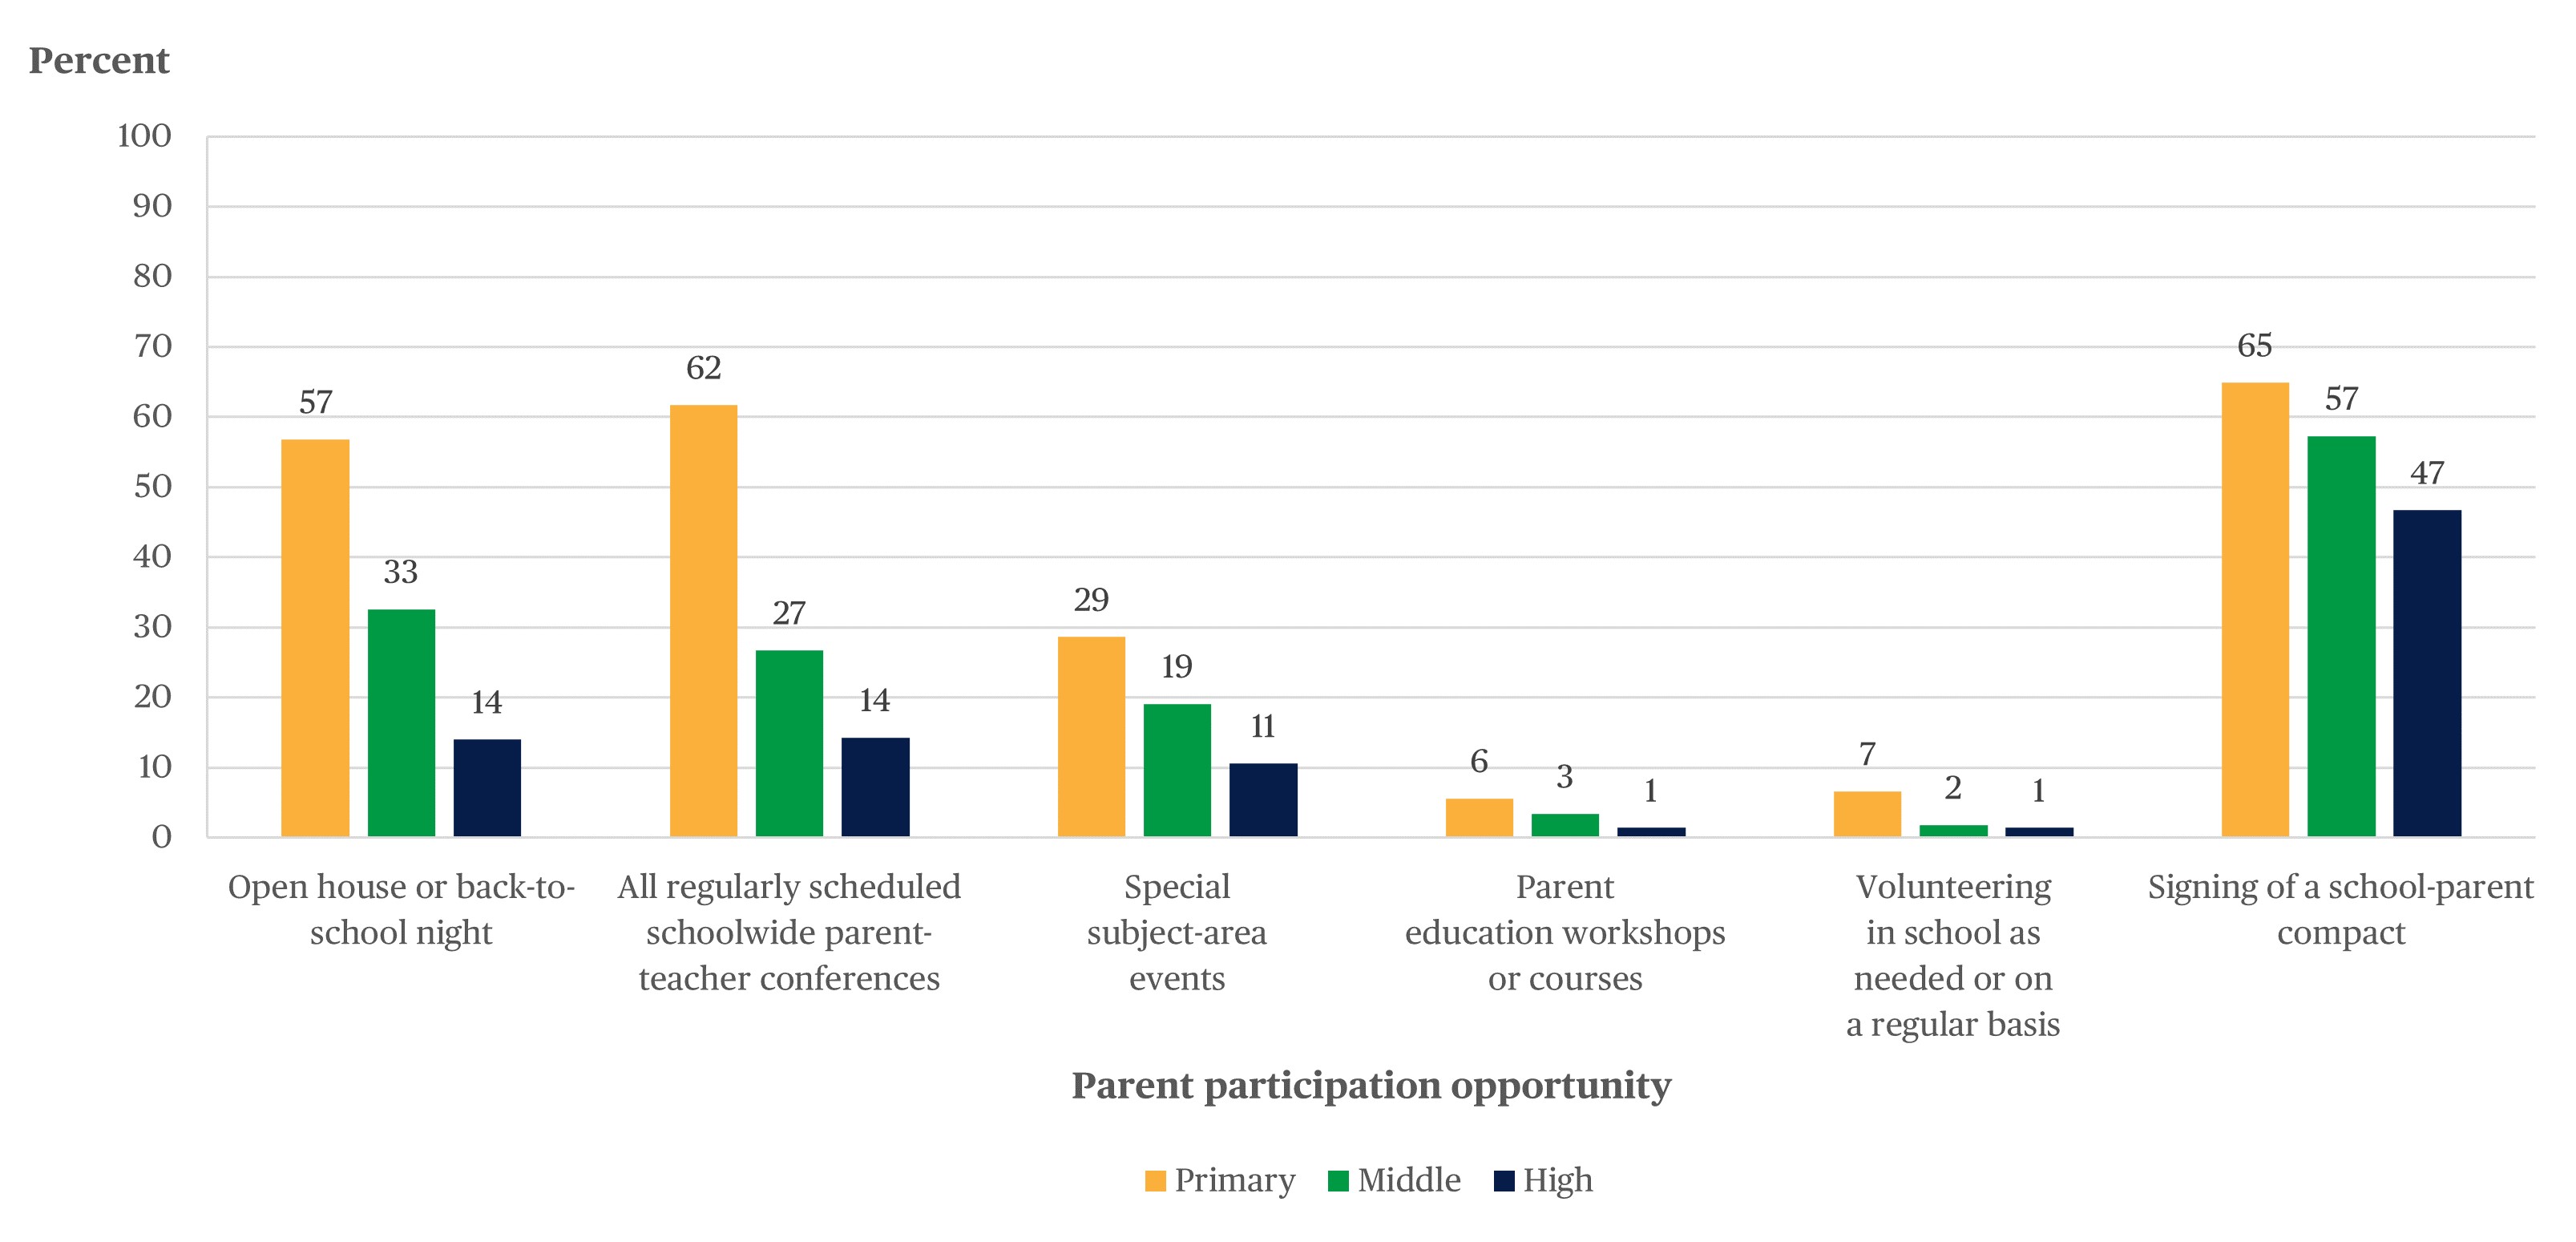
- Among principals in schools that offered various opportunities for parent participation, the percentages of primary school principals who reported that 76–100 percent of parents attended an engagement opportunity were higher than the percentages of middle and high school principals for most opportunities (figure 2).
- More parents of primary school students than parents of middle and high school students attended open house or back-to-school night events, parent-teacher conferences, subject-area events,[3] and parent education workshop courses; volunteered in the school; and signed a school-parent compact.[4]
Figure 2. Percentage of principals in schools that offered various opportunities for parent participation who reported that 76–100 percent of parents participated in different opportunities, by opportunity type and school level: 2017–18
 ! Interpret data with caution. The coefficient of variation (CV) for this estimate is between 30 and 50 percent.
SOURCE: U.S. Department of Education, National Center for Education Statistics, National Teacher and Principal Survey (NTPS), "Public School Teacher Data File," 2017–18.
AEW Day 3: Education Support Professionals in U.S. Public Schools (2015–16 NTPS)
Education support professionals are nonteaching staff, including nurses, librarians, and student support services professionals (such as school counselors, psychologists, social workers) whose contributions keep schools organized and help students stay safe, healthy, and ready to learn.
- Ninety-four percent of all public schools had at least one full- or part-time counselor, psychologist, or social worker; the percentage of schools that had at least one full- or part-time counselor (81 percent) was greater than the percentages that had at least one full- or part-time psychologist (67 percent) and social worker (42 percent). Six percent had neither a counselor, psychologist, nor social worker on staff.
- High poverty schools—schools where 75 percent or more of students were approved for the free or reduced-price lunch (FRPL) program—had fewer education support professionals on staff than did schools with lower FRPL participation rates (0–34 percent, 35–49 percent, and 50–74 percent).
- Eight percent of high-poverty schools had neither a counselor, psychologist, nor social worker on staff, compared with 3 percent of schools with 0–34 percent or with 35–49 percent FRPL participation.
Next, in part 2 of the NTPS blog series for American Education Week, we will share facts and findings about educators.
In honor of American Education Week, NCES would like to thank every parent and/or guardian, education support professional, educator, and principal who makes public education possible for students every day!
The data in this blog would not be possible without the participation of teachers, principals, and school staff in the NTPS. We are currently conducting the 2020–21 NTPS to learn more about teaching experiences during the pandemic. If you were contacted about participating in the 2020–21 NTPS and have questions, please email ntps@census.gov or call 1-888-595-1338.
For more information about the National Teacher and Principal Survey (NTPS), please visit https://nces.ed.gov/surveys/ntps/. More findings and details are available in the NTPS school, teacher, and principal reports.
By Julia Merlin, NCES
[1] There may be meaningful differences within the student body at middle and high schools that offer self-contained classrooms that differ from the characteristics of those students in self-contained classrooms at primary schools.
[2] National PTA. 2000. Building Successful Partnerships: A Guide for Developing Parent and Family Involvement Programs. Bloomington, Indiana: National Education Service, 11–12.
[3] Special subject-area events include events such as science fairs and concerts.
[4] A school-parent compact is an agreement between school community members (e.g., parents, principals, teachers, students) that acknowledges the shared responsibility for students learning and/or the school's policies.