NCES Blog

National Center for Education Statistics

Spotlight on American Education Week, Part 1: Celebrating U.S. Public Education with the National Teacher and Principal Survey (NTPS)

In 1921, the National Education Association (NEA) sponsored the first American Education Week to express gratitude for U.S. public school educators who work hard every day to ensure all students receive a quality education. To celebrate education professionals working in the more than 98,000 U.S. public schools during this year’s American Education Week, NCES will share facts and figures from the National Teacher and Principal Survey (NTPS) in two blogs (read part 2 here).

The NTPS is a great resource for educators looking to better understand the characteristics and experiences of their professional communities both nationally and by state (using the NTPS State Dashboard). The NTPS collects information about school conditions and the demographics of public and private school teachers and principals, providing data that policymakers and researchers use to inform funding and other decisions.

In honor of American Education Week, here are some selected facts and figures about U.S. public schools from the NTPS (note that these data were collected prior to the coronavirus pandemic).

AEW Day 1: U.S. Public Schools (2017–18 NTPS)

  • The majority of elementary teachers teach in self-contained classrooms (i.e., they instruct the same group of students all or most of the day), while the majority of middle and high school teachers teach in departmentalized classrooms (i.e., they teach several classes of different students all or most of the day in different subjects).[1]
    • The average class size for teachers in self-contained classrooms in primary schools was 21 students (figure 1).
    • The average class size for teachers in departmentalized classrooms in middle schools was 25 students, which was higher than the average class size for teachers in departmentalized classrooms in high schools (23 students).

Figure 1. Average class size in U.S. public schools, by class type and school level: 2017–18

NOTE: Self-contained classes are defined as instruction to the same group of students all or most of the day in multiple subjects. Departmentalized instruction is defined as instruction to several classes of different students most or all of the day in one or more subjects. Among all public school teachers, 25 percent teach self-contained classes in primary schools, 1 percent do so in middle schools, and 1 percent do so in high schools; 8 percent teach departmentalized classes in primary schools, 14 percent do so in middle schools, and 24 do so percent in high schools; and 15 percent teach other types of classes, such as elementary subject specialist classes, team-taught classes, and "pull-out" or "push-in" classes in primary schools, 3 percent do so in middle schools, and 3 percent do so in high schools.

SOURCE: U.S. Department of Education, National Center for Education Statistics, National Teacher and Principal Survey (NTPS), "Public School Teacher Data File," 2017–18.


AEW Day 2: Parent Involvement in U.S. Public Schools (2017–18 NTPS)

The National Parent Teacher Association reports that “the most accurate predictors of student achievement in school are not family income or social status, but the extent to which the family . . . becomes involved in the child’s education at school.”[2]

  • Most U.S. public schools offered at least one opportunity for parents and/or guardians to participate in an event or activity at their child’s school, such as parent-teacher conferences and back-to-school nights.
  • Among principals in schools that offered various opportunities for parent participation, the percentages of primary school principals who reported that 76–100 percent of parents attended an engagement opportunity were higher than the percentages of middle and high school principals for most opportunities (figure 2).
    • More parents of primary school students than parents of middle and high school students attended open house or back-to-school night events, parent-teacher conferences, subject-area events,[3] and parent education workshop courses; volunteered in the school; and signed a school-parent compact.[4]

Figure 2. Percentage of principals in schools that offered various opportunities for parent participation who reported that 76–100 percent of parents participated in different opportunities, by opportunity type and school level: 2017–18

! Interpret data with caution. The coefficient of variation (CV) for this estimate is between 30 and 50 percent.

SOURCE: U.S. Department of Education, National Center for Education Statistics, National Teacher and Principal Survey (NTPS), "Public School Teacher Data File," 2017–18.


AEW Day 3: Education Support Professionals in U.S. Public Schools (2015–16 NTPS)

Education support professionals are nonteaching staff, including nurses, librarians, and student support services professionals (such as school counselors, psychologists, social workers) whose contributions keep schools organized and help students stay safe, healthy, and ready to learn.

  • Ninety-four percent of all public schools had at least one full- or part-time counselor, psychologist, or social worker; the percentage of schools that had at least one full- or part-time counselor (81 percent) was greater than the percentages that had at least one full- or part-time psychologist (67 percent) and social worker (42 percent). Six percent had neither a counselor, psychologist, nor social worker on staff.
    • High poverty schools—schools where 75 percent or more of students were approved for the free or reduced-price lunch (FRPL) program—had fewer education support professionals on staff than did schools with lower FRPL participation rates (0–34 percent, 35–49 percent, and 50–74 percent).
      • Eight percent of high-poverty schools had neither a counselor, psychologist, nor social worker on staff, compared with 3 percent of schools with 0–34 percent or with 35–49 percent FRPL participation.

Next, in part 2 of the NTPS blog series for American Education Week, we will share facts and findings about educators.


In honor of American Education Week, NCES would like to thank every parent and/or guardian, education support professional, educator, and principal who makes public education possible for students every day!

The data in this blog would not be possible without the participation of teachers, principals, and school staff in the NTPS. We are currently conducting the 2020–21 NTPS to learn more about teaching experiences during the pandemic. If you were contacted about participating in the 2020–21 NTPS and have questions, please email ntps@census.gov or call 1-888-595-1338.

For more information about the National Teacher and Principal Survey (NTPS), please visit https://nces.ed.gov/surveys/ntps/. More findings and details are available in the NTPS school, teacher, and principal reports.


By Julia Merlin, NCES


[1] There may be meaningful differences within the student body at middle and high schools that offer self-contained classrooms that differ from the characteristics of those students in self-contained classrooms at primary schools.
[2] National PTA. 2000. Building Successful Partnerships: A Guide for Developing Parent and Family Involvement Programs. Bloomington, Indiana: National Education Service, 11–12.
[3] Special subject-area events include events such as science fairs and concerts.
[4] A school-parent compact is an agreement between school community members (e.g., parents, principals, teachers, students) that acknowledges the shared responsibility for students learning and/or the school's policies.

NCES Releases First-Ever Response Process Dataset—A Rich New Resource for Researchers

The NCES data file National Assessment of Educational Progress (NAEP) Response Process Data From the 2017 Grade 8 Mathematics Assessment (NCES 2020-102; documentation NCES 2020-134) introduces a new type of data—response process data—which was made possible by NAEP’s transition from paper to digitally based assessments in mathematics and reading in 2017. These new datasets allow researchers to go beyond analyzing students’ answers to questions as simply right or wrong; instead, researchers can examine the amount of time students spend on questions, the pathways they take through the assessment sections, and the tools they use while solving problems. 

NAEP reporting has hinted previously at the promise of response process data. With the release of the 2017 mathematics assessment results, NCES included a feature on The Nation’s Report Card website to show the different steps students took while responding to a question that assessed their multiplication skills. The short video below shows that students used a total of 397 different sequences to group four digits into two factors that yield a given product. The most popular correct and incorrect answer paths are shown in the video. Response process data, such as those summarized in this example item, can open new avenues for understanding how students work through math problems and identifying more detailed elements of response processes that could lead to common math errors.


In the newly released data, researchers can access student response process data from two 30-minute blocks of grade 8 mathematics assessment questions (or a total of 29 test items) and a 15-minute survey questionnaire where students responded to questions about their demographic characteristics, opportunities to learn in and outside of school, and educational experiences. Researchers can explore logs of the response process data collected from each student along with a file containing students’ raw responses and scored responses, time stamps, and demographics. In addition, researchers can explore a file that summarizes defined features of students’ interactions with the assessment, such as the number of seconds spent on specific questions or the number of times the calculator was opened across all students.

To explore this response process dataset, interested researchers should apply for a restricted-use license and request access to the files through the NCES website. By providing this dataset to a wide variety of researchers, NCES hopes to encourage and enable a new domain of research on developing best practices for the use and interpretation of student response process data.


By Jan Marie Alegre and Robert Finnegan, Educational Testing Service

What National and International Assessments Can Tell Us About Technology in Students’ Learning: Technology Instruction, Use, and Resources in U.S. Schools

As schools and school districts plan instruction amid the current coronavirus pandemic, the use of technology and digital resources for student instruction is a key consideration.

In this post, the final in a three-part series, we present results from the NAEP TEL and ICILS educator questionnaires (see the first post for information about the results of the two assessments and the second post for the results of the student questionnaires). The questionnaires ask about the focus of technology instruction in schools, school resources to support technology instruction, and the use of technology in teaching practices.

It is important to note that NAEP TEL surveys the principals of U.S. eighth-grade students, while ICILS surveys a nationally representative sample of U.S. eighth-grade teachers.

Emphasis in technology instruction

According to the 2018 NAEP TEL principal questionnaire results, principals1 of 61 percent of U.S. eighth-grade students reported that prior to or in eighth grade, much of the emphasis in information and communication technologies (ICT) instruction was placed on teaching students how to collaborate with others. In addition, principals of 51 percent of eighth-grade students reported that a lot of emphasis was placed on teaching students how to find information or data to solve a problem. In comparison, principals of only 10 percent of eighth-grade students reported that a lot of emphasis was placed on teaching students how to run simulations (figure 1).


According to the 2018 ICILS teacher questionnaire results, 40 percent of U.S. eighth-grade teachers reported a strong emphasis on the use of ICT instruction to develop students’ capacities to use computer software to construct digital work products (e.g., presentations). In addition, 35 percent of eighth-grade teachers reported a strong emphasis on building students’ capacities to access online information efficiently. In comparison, 17 percent reported a strong emphasis on developing students’ capacities to provide digital feedback on the work of others (figure 2).  


Resources at school

NAEP TEL and ICILS used different approaches to collect information about technology-related school resources. NAEP TEL asked about hindrances that limited schools’ capabilities to provide instruction in technology or engineering concepts. According to NAEP TEL, principals of 5 percent of U.S. eighth-grade students indicated that a lack or inadequacy of internet connectivity was a “moderate” or “large” hindrance in their schools. However, principals of 61 percent of eighth-grade students indicated that a lack of time due to curriculum content demands was a “moderate” or “large” hindrance. Principals of 44 percent of eighth-grade students indicated that a lack of qualified teachers was a “moderate” or “large” hindrance (figure 3).


ICILS asked about the adequacy of school resources to support ICT use in teaching. Eighty-six percent of U.S. teachers “agreed” or “strongly agreed” that technology was considered a priority for use in teaching. Nearly three-quarters of teachers “agreed” or “strongly agreed” that their schools had access to sufficient digital learning resources and had good internet connectivity (74 and 73 percent, respectively) (figure 4).


Use of technology in teaching

Teachers of U.S. eighth-grade students reported that they often used technology in their teaching practices. ICILS found that 64 percent of U.S. teachers regularly (i.e., “often” or “always”) used technology to present class instruction. Fifty-four percent of teachers regularly used technology to communicate with parents or guardians about students’ learning. In addition, 45 percent of teachers regularly used technology to provide remedial or enrichment support to individual or small groups of students, and a similar percentage (44 percent) regularly used technology to reinforce skills through repetition of examples (figure 5).


ICILS also reported results from U.S. eighth-grade teachers about how they collaborated on technology use. About three-quarters “agreed” or “strongly agreed” that they talked to other teachers about how to use technology in their teaching. Similarly, about three-quarters “agreed” or “strongly agreed” that they shared technology resources with other teachers in the school. More than half of the teachers “agreed” or “strongly agreed” that they collaborated with colleagues on the development of technology-based lessons.

Overall, the responses of teachers and principals suggested that emphasis had been put on different aspects of instruction for eighth-grade students. The majority of schools had enough digital resources and adequate internet access. However, technologies were also used differently in different teaching practices.

It should be noted that the data presented here were collected in 2018; any changes since then due to the coronavirus pandemic are not reflected in the results reported here. The NAEP TEL and ICILS samples both include public and private schools. The 2018 ICILS also included a principal questionnaire, but the questions are not directly related to the topics included in this blog. Data reported in the text and figures are rounded to the nearest integer.


Resources for more information:


By Yan Wang, AIR, and Taslima Rahman, NCES


[1] The unit of analysis for TEL principal responses is student.

What National and International Assessments Can Tell Us About Technology in Students’ Learning: Eighth-Graders’ Experience with Technology

The use of technology has become an integral part of life at work, at school, and at home throughout the 21st century and, in particular, during the coronavirus pandemic.

In this post, the second in a three-part series, we present results from the NAEP TEL and ICILS student questionnaires about students’ experience and confidence using technology (see the first post for more information about these assessments and their results). These results can help to inform education systems that are implementing remote learning activities this school year.

Uses of information and communication technologies (ICT) for school

Both NAEP TEL and ICILS collected data in 2018 on U.S. eighth-grade students’ uses of ICT in school or for school-related purposes.

According to the NAEP TEL questionnaire results, about one-third of U.S. eighth-grade students reported that they used ICT regularly (i.e., at least once a week) to create, edit, or organize digital media (figure 1). About a quarter used ICT regularly to create presentations, and 18 percent used ICT regularly to create spreadsheets.


According to the ICILS questionnaire results, 72 percent of U.S. eighth-grade students reported that they regularly used the Internet to do research, and 56 percent regularly used ICT to complete worksheets or exercises (figure 2). Forty percent of eighth-grade students regularly used ICT to organize their time and work. One-third regularly used software or applications to learn skills or a subject, and 30 percent regularly used ICT to work online with other students.


Confidence in using ICT

Both the 2018 NAEP TEL and ICILS questionnaires asked U.S. eighth-grade students about their confidence in their ICT skills. NAEP TEL found that about three-quarters of eighth-grade students reported that they were confident that they could—that is, they reported that they “probably can” or “definitely can”—compare products using the Internet or create presentations with sound, pictures, or video (figure 3). Seventy percent were confident that they could organize information into a chart, graph, or spreadsheet.


ICILS found that 86 percent of U.S. eighth-grade students reported that they knew how to search for and find relevant information for a school project on the Internet (figure 4). Eighty-three percent knew how to both upload text, images, or video to an online profile and install a program or app. About three-quarters of eighth-grade students knew how to change the settings on their devices, and 65 percent knew how to edit digital photographs or other graphic images.


Years of experience using computers

In the 2018 ICILS questionnaire, U.S. eighth-grade students were also asked how many years they had been using desktop or laptop computers. One-third of eighth-grade students reported using computers for 7 years or more—that is, they had been using computers since first grade (figure 5). This finding was similar to results from the Computer Access and Familiarity Study (CAFS), which was conducted as part of the 2015 NAEP. The CAFS found that in 2015, about 35 percent of eighth-grade public school students reported first using a laptop or desktop computer in kindergarten or before kindergarten.

Nineteen percent of eighth-grade students reported that they had used computers for at least 5 but less than 7 years. However, 9 percent of eighth-grade students had never used computers or had used them for less than one year, meaning they had only started using computers when they reached eighth grade.


Overall, responses of eighth-grade students showed that some had more years of experience using computers than others. Although there were differences in students’ use of ICT for school-related purposes, most students felt confident using ICT.

It should be noted that the data presented here were collected in 2018; any changes since then due to the coronavirus pandemic or other factors are not reflected in the results reported here. The NAEP TEL and ICILS samples both include public and private schools. Data reported in the text and figures are rounded to the nearest integer.


Resources for more information:


By Yan Wang, AIR, and Taslima Rahman, NCES

What National and International Assessments Can Tell Us About Technology in Students’ Learning: Eighth-Graders’ Readiness to Use Technology

Across the country in 2020, students, teachers, and parents have had to adapt to changes in the delivery of education instruction due to the coronavirus pandemic and turn to information and communication technologies (ICT) to learn, interact, and assess progress. It is important that we are able to assess students’ abilities to understand and use technology now more than ever. This post, the first in a three-part series, discusses the results of two technology-focused assessments, NAEP TEL and ICILS, which NCES administered in 2018 (see textbox for more information about these assessments).

Students’ performance on NAEP TEL and ICILS

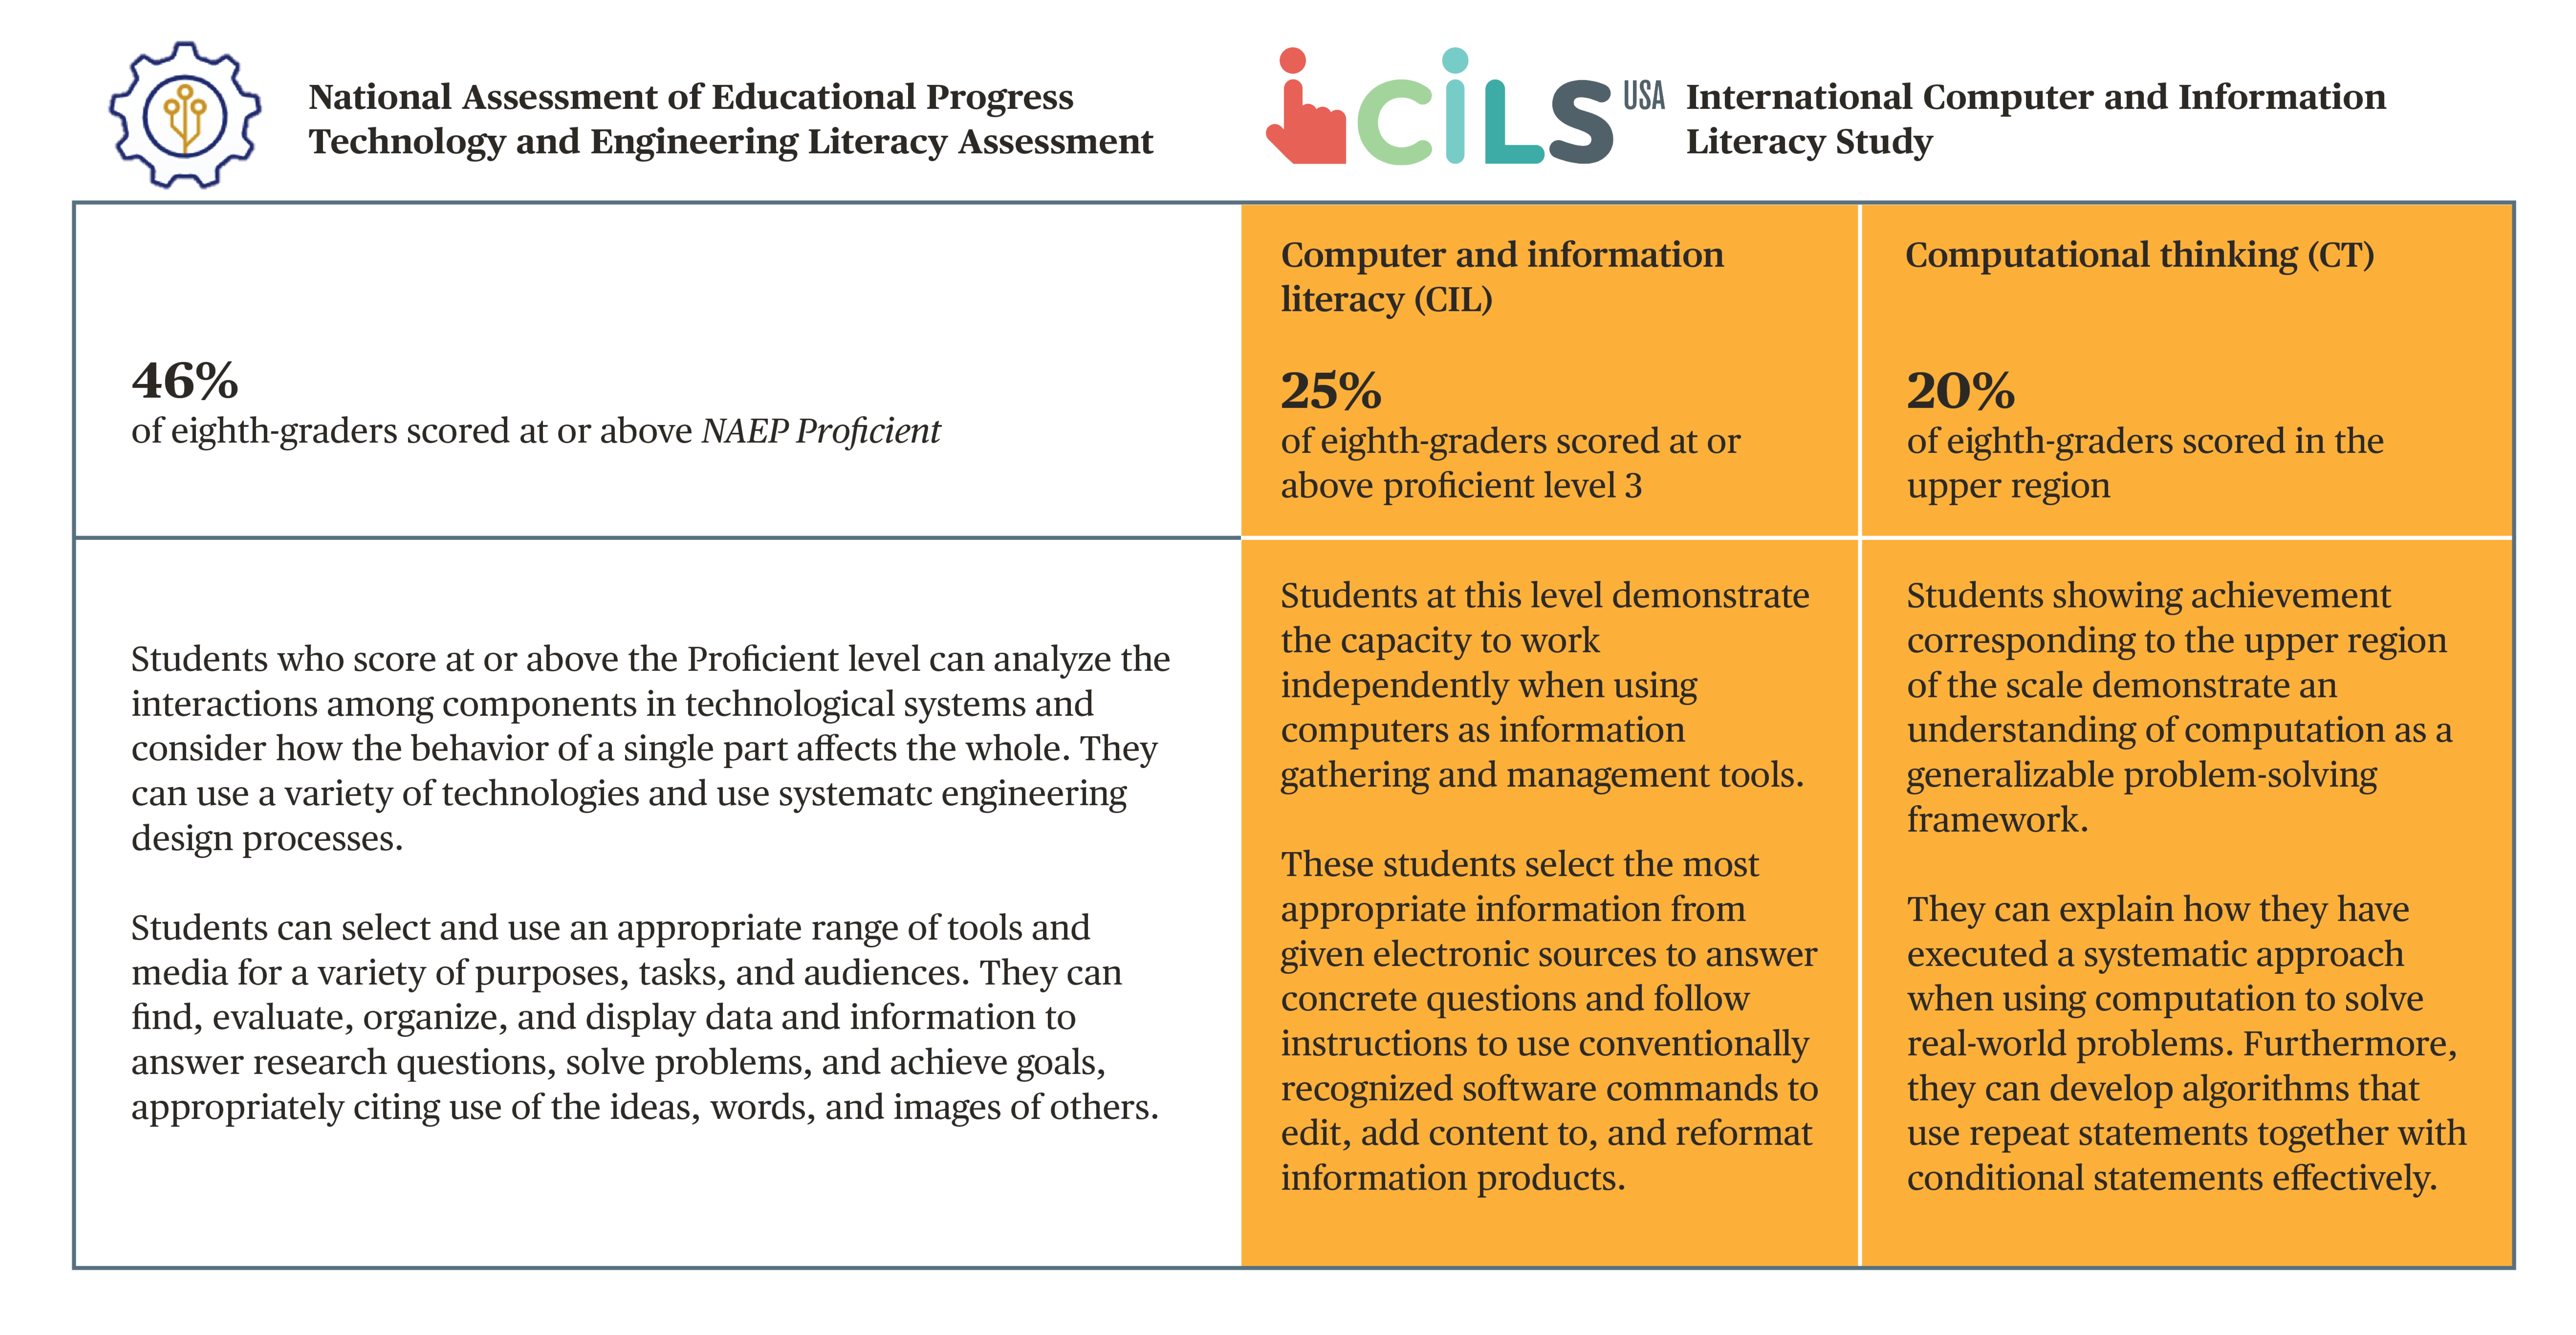
According to the 2018 NAEP TEL, 46 percent of U.S. eighth-grade students scored at or above the NAEP Proficient level, meaning that they were able to demonstrate the selection and use of an appropriate range of tools and media (figure 1). According to the 2018 ICILS, 25 percent of eighth-grade students scored at or above proficiency level 3 for computer and information literacy—that is, they demonstrated the capacity to work independently when using computers as information-gathering and management tools. In addition, 20 percent of eighth-grade students scored in the upper region for computational thinking, meaning that they demonstrated an understanding of computation as a problem-solving framework.


Figure 1. Percentage of eighth-grade students identified as at or above proficient, by assessment: 2018


There are many factors that may affect performance on these assessments, such as access to technology, devices, hardware, and software; access to learning opportunities using technology; amount of experience using technology; and attitudes toward technology.

Student’s participation in technology-related classes

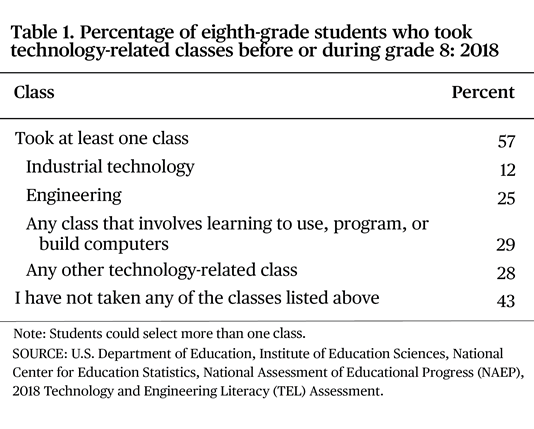
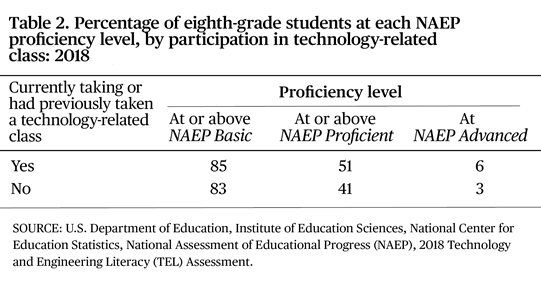
For NAEP TEL, students were asked if they were currently taking a technology-related class or if they had taken one in the past. In 2018, about 57 percent of U.S. eighth-grade students were either currently enrolled in or had taken at least one technology-related class, such as industrial technology, engineering, or a class that involved learning to use, program, or build computers (table 1). In addition, a higher percentage of students who had completed a technology-related class before or during eighth-grade scored at or above the NAEP Proficient level, compared with students who had not completed such a class (table 2).


Overall, both assessments show that a portion of students demonstrated the knowledge and skills necessary to meet the assessment’s defined proficiency measures, although more than half reported taking technology-related classes before or during eighth grade.

It should be noted that the data presented here were collected in 2018; any changes since then due to the coronavirus pandemic or other factors are not reflected in the results reported here. The NAEP TEL and ICILS samples both include public and private schools, but the two assessments use different methods for reporting student performance. Data from these assessments do not support any causal inferences as they are not experimental studies. Data reported in the text and figures are rounded to the nearest integer.


Resources for more information:

By Mary Ann Fox, AIR, and Taslima Rahman, NCES