NCES Blog

National Center for Education Statistics

Civics Education in Public Schools: Lessons and Activities Around the 2024 Election

In September of this year, the School Pulse Panel (SPP), NCES’s innovative approach to delivering timely information on public K-12 schools in the U.S., surveyed around 1,500 school leaders on their school’s plans to incorporate the 2024 national election into lessons and whether they planned to run any election-related activities such as mock debates or mock voting. While schools were not asked what type of content was included in these lessons or in the election-related activities, the findings presented here show the prevalence of election-related information and engagement opportunities in the nation’s public schools.

Figure 1 shows the percentage of schools that reported that teachers were incorporating the 2024 national election into their lessons, for each of the respective grades. More than half of public schools reported that teachers were incorporating the national election into their lessons at fourth and higher grades, peaking at twelfth grade (85 percent). 


Figure 1. Percentage of public schools that had at least one teacher incorporating the 2024 national election cycle into lessons, by grade, 2024-25 school year

Graph showing the % of public schools with at least one teacher incorporating the 2024 election into lessons by grade. K is 31%, 12 is 85%, with a consistent climb from K to 12. Grade 6 to 7 drops from 66 to 63%, grade 8 to 9 drops from 75 to 69%.


Overall, 77 percent of public schools reported that they had teachers incorporating the election into their lessons. There was some regional variation in the percentage of schools that reported teachers incorporating the election, with higher percentages of public schools in the Northeast (82 percent) and Midwest (82 percent) incorporating the election compared to schools in the South (75 percent) and West (74 percent).

In addition to lessons, school leaders reported on various special programming activities centered around the 2024 election. Overall, 52 percent of public schools reported having one or more of the following: voter registration opportunities for students 1, mock debates, mock voting, assemblies/guest speakers, or some other program related to the election. As seen in Figure 2, a higher percentage of high/secondary schools reported running these kinds of programs, compared to elementary or middle/combined schools. Table 1 shows the percentages of schools offering each of these programs for all public schools and by school level.


Figure 2. Percentage of public schools with any special programming around the 2024 national election cycle, by school level, 2024-25 school year

Bar graph showing 52% of all public schools with special programming around the 2024 national election. Elementary schools are at 40%, middle/combined schools are at 50%, and high/secondary schools are at 81%.


Table 1. Percentage of public schools with selected special programming activities around the 2024 national election cycle, by school level, 2024-25 school year

  All public schools   Elementary Middle/combined High/secondary
Voter registration opportunities for studentsa 66   42 72
Mock voting 37   35 40 41
Assemblies/guest speakers 12   8 11 24
Other special programming 7   6 6 8


a Only asked of schools serving 11th- or 12th- grade students.


‡ Reporting standards not met. The coefficient of variation is greater than 50 percent or there are too few cases for a reliable analysis.


Among public schools enrolling students in 11th- or 12th- grade, 66 percent reported that they held voter registration opportunities for their students. Figure 3 shows the variation in the percentage of schools that offered registration opportunities by school neighborhood poverty level, percent students of color, school size, school locale, and region. Among different school sizes, a lower percentage of the smallest schools in the country (0-299 students) held voter registration events for their students, compared to all other school size groups. Among regions, a higher percentage of schools in the Northeast reported providing these opportunities, compared to the Midwest and West.


Figure 3. Among public schools enrolling students in 11th- or 12th- grade, percentage that had voter registration opportunities for their students, by school characteristics, 2024-25 school year

Graph showing that 66% of all public schools offering grades 11 and 12 had voter registration. Low poverty neighborhood schools were 66%, while high-poverty were 68%. Varying stats for % of students being students of color, for school size, for region, and for school locale difference.


To explore these data – for all public schools and by neighborhood poverty level, percent students of color, school level, school size, locale, and region – check out the interactive SPP dashboard.

[1]Only among schools serving 11th- or 12th- grade students.

Common Core of Data (CCD) Nonfiscal Data Releases – How the National Center for Education Statistics Improved Timeliness

What is the Common Core of Data?

Every year, the National Center for Education Statistics (NCES) releases nonfiscal data files from the Common Core of Data (CCD), one of the U.S. Department of Education’s (ED’s) primary resources on public elementary and secondary school districts, schools, and students. CCD nonfiscal data are made available to the public as data files, as well as in user-friendly data tools, and include the district and school directory (location, operational status, and grades offered) as well as data on student membership (by grade, sex, and race/ethnicity), full-time equivalent staff and teachers, and the number of students eligible for the National School Lunch Program (NSLP)

Why is CCD so important?

The CCD is a trusted data source used by ED stakeholders, researchers, and the public. Timely release of high-quality, accurate CCD data is critical not only to these stakeholders but also to ED’s commitment to providing high-quality data products. 

CCD data are now released within months of submission by states!

Bar Graph reporting the night of months from the due date to the CCD release 4 months in SY 2023-24, 5 months in SY 2022-23, 8 month in SY 2020-21, 11 month in SY 2018-19 and 20 month in SY 2016-17Over the past several years, NCES made process improvements to the collection and dissemination of CCD data (described below) that allow NCES to release the CCD data more quickly than ever before. As a result of these changes, the school year (SY) 2023-24 CCD data files will be available to the public less than 4 months after the July 2024 submission due date.

In contrast, the SY 2016-17 CCD data files were due in May 2017 and released January 2019 (a full 20 months later).

What has NCES done to release HIGH-QUALITY CCD nonfiscal data so quickly?

NCES modernized the CCD nonfiscal data quality (DQ) review and file production process in two phases:

Phase 1: Modernized CCD DQ review and file production. Defined the DQ standard through business rules, held state data providers to the defined DQ standard, developed a system to provide DQ feedback to states within a few days of submission, and improved the public file format.

This CCD data quality system developed in Phase 1 served as a sandbox for the broader EDFacts modernization project, called EDPass. EDPass is a centralized data submission system used by ED to standardize data submissions across ED offices. 

Phase 2: Full modernization of data submissions with EDPass. NCES manages the EDPass data submission tool for use by ED stakeholders including NCES, the Office of Elementary and Secondary Education (OESE), and the Office of Special Education Programs (OSEP). The new submission tool, rolled out with the SY 2022-23 collection cycle, eliminated the time-consuming post-submission DQ process by running DQ checks at upload and requiring states to address all data quality issues prior to data submission. Critical components of this successful implementation included:

  • Clear message from ED that high-quality data are expected at the due date
    • NCES communicated the change in the submission process to state CCD Coordinators 2 years in advance
    • Due dates were shifted to accommodate pre-submission DQ checks and to give states more time to get accustomed to the new process
    • ED set due dates and held states accountable for the quality of the data; poor- quality data were suppressed and late data submissions were not included in data releases
  • Investments in people and technology
    • NCES’s new EDPass submission system is user-friendly
    • NCES CCD staff and contractors increased direct support to states during data collection through well-attended office hour sessions
  • Improved data quality process
    • NCES published the full catalog of standardized business rules that align with data file specifications
    • States receive data quality results within minutes of a file upload
    • EDPass system does not allow states to submit any uploaded data files until all identified DQ issues are addressed
  • Enhanced DQ reports
    • All DQ results are available for ED stakeholder use immediately after the collection due date
    • Data notes that accompany file releases provide state explanations for identified DQ issues and are built directly from state comments provided during data submission
  • State buy-in
    • State data submitters contributed feedback on the new system and processes during development
    • States made systematic internal data governance improvements in response to EDPass modernization and the improved data quality process

Conclusions

As demonstrated by the SY 2023-24 CCD data release, ED’s bold investment in EDPass technology and end-to-end process changes allow for the release of high-quality, consistent data products more quickly than ever. The benefits from this investment, however, reach beyond data products, resulting in significant burden reductions both for states and for ED program offices that use the data. EDPass modernization also supports compliance with the Information Quality Act, the ED-wide Data Strategy effort to improve data access and advance the strategic use of data and, more broadly, ED’s efforts to comply with the November 2023 Office of Inspector General Management Challenges report.  

Finally, while the gains from the EDPass modernization are illustrated in this blog through the SY 2023-24 CCD nonfiscal data release, this modernization impacts ALL data collected through the EDFacts submission system and will enable earlier release of high-quality data by other program offices, including OESE through ED Data Express and OSEP through ED’s Open Data Platform.  

NCES Presentation at National HBCU Week Conference

In NCES’s recently released Strategic Plan, Goal 3 identifies our commitment to foster and leverage beneficial partnerships. To fulfill that goal, NCES participates in multiple conferences and meetings throughout the year. Recently, NCES participated in the National Historically Black Colleges and Universities (HBCU) Week Conference. NCES’s presentation at this conference helps us to establish a dialogue with HBCUs and develop partnerships to address critical issues in education.

NCES Commissioner Peggy G. Carr kicked off the presentation with an overview of HBCU data—such as student characteristics, enrollment, and financial aid. Then, NCES experts explored how data from various NCES surveys can help researchers, educators, and policymakers better understand the condition and progress of HBCUs. Read on to learn about these surveys.


Integrated Postsecondary Education Data System (IPEDS)

The Integrated Postsecondary Education Data System (IPEDS) is an annual administrative data collection that gathers information from more than 6,000 postsecondary institutions, including 99 degree-granting, Title IV–eligible HBCUs (in the 2021–22 academic year).

The data collected in IPEDS includes information on institutional characteristics and resources; admissions and completions; student enrollment; student financial aid; and human resources (i.e., staff characteristics). These data are disaggregated, offering insights into student and employee demographics by race/ethnicity and gender, students’ age categories, first-time/non-first-time enrollment statuses, and full-time/part-time attendance intensity.

Data from IPEDS can be explored using various data tools—such as Data Explorer, Trend Generator, and College Navigator—that cater to users with varying levels of data knowledge and varying data needs.


National Postsecondary Student Aid Study (NPSAS)

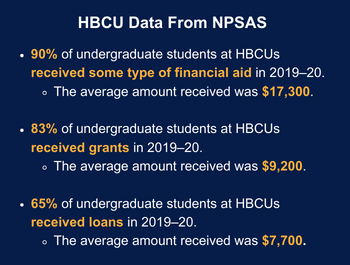
The National Postsecondary Student Aid Study (NPSAS) is a nationally representative study that examines the characteristics of students in postsecondary institutions—including HBCUs—with a special focus on how they finance their education. NPSAS collects data on the percentage of HBCU students receiving financial aid and the average amounts received from various sources (i.e., federal, state, and institution) by gender and race/ethnicity.

Conducted every 3 or 4 years, this study combines data from student surveys, student-level school records, and other administrative sources and is designed to describe the federal government’s investment in financing students’ postsecondary education.

Data from NPSAS can be explored using DataLab and PowerStats.


National Teacher and Principal Survey (NTPS)

The National Teacher and Principal Survey (NTPS) is the U.S. Department of Education’s primary source of information on K–12 public and private schools from the perspectives of teachers and administrators. NTPS consists of coordinated surveys of schools, principals, and teachers and includes follow-up surveys to study principal and teacher attrition.

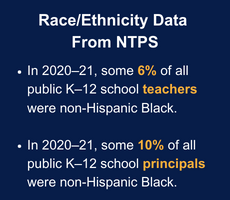
Among many other topics, NTPS collects data on the race/ethnicity of teachers and principals. These data—which show that Black teachers and principals make up a relatively small portion of the K–12 workforce—can be used to explore the demographics and experiences of teachers and principals. NTPS provides postsecondary institutions, like HBCUs, a snapshot of the preK–12 experiences of students and staff.

Data from NTPS can be explored using DataLab and PowerStats.


National Assessment of Educational Progress (NAEP)

The National Assessment of Educational Progress (NAEP)—also known as the Nation’s Report Card—is the the largest nationally representative and continuing assessment of what students in public and private schools in the United States know and are able to do in various subjects.

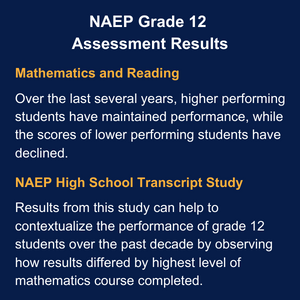
Main NAEP assesses students in grades 4, 8, and 12 in subjects like reading, mathematics, science, and civics, while NAEP Long-Term Trend assesses 9-, 13-, and 17-year-olds in reading and mathematics.

Among many other topics, NAEP collects data on students by race/ethnicity. These data can help to shed light on students’ experiences, academic performance, and level of preparedness before they enroll in HBCUs.

Data from NAEP can be explored using the NAEP Data Explorer.


To explore more HBCU data from these and other NCES surveys—including enrollment trends from 1976 to 2021—check out this annually updated Fast Fact. Be sure to follow NCES on X, Facebook, LinkedIn, and YouTube and subscribe to the NCES News Flash to stay up to date on the latest from NCES.


By Megan Barnett, AIR

Using Federal Education Data to Inform Policymaking: Part 2–Challenges and Opportunities

In part 1 of this blog series, we highlight the benefits and advantages of using federal education data for policymaking at the federal, state, and district levels. In part 2, we will explore the challenges of and opportunities afforded by using these data.

States, districts, and schools are inundated with requests for data. To manage the volume of requests and avoid overwhelming educators, many districts have established processes to vet and limit the number of surveys allowed in their schools and administrative offices. District clearance processes are also understandably meant to make sure everyone is in compliance with data privacy laws. NCES data collections are sometimes not cleared by district offices, which then means NCES is not allowed to contact schools or educators to learn from their perspectives or experiences.

Since many state or district policymakers prioritize local survey collections, federal surveys are occasionally rejected by district offices that are striving to keep from overburdening their educators with too many survey requests. Without district permission, NCES surveys won’t include the educators in those schools, meaning that those districts’ voices will be missing from the table when decisions are made. This is problematic for the entire education system for a few reasons.

  1. Local data rarely reach federal policymakers. We know state and district decisionmakers derive a lot of value from state and/or district survey collections—since they’re designed to provide detailed local data—and do not always see value in federal data collection and reporting efforts. More localized data are critical to their day-to-day decisions. However, the presence of numerous state-run surveys—in addition to the myriad individualized district surveys that can exist within a single state—has begun to create a data silo where information remains frozen within a state or district system. Since NCES (and therefore the Department of Education and Congress) rarely receives data from state or local collections, these data sources cannot readily be used to generate national policies, which greatly limits opportunities for state and district systems to learn from each other. These data silos can, for example, impact the focus or breadth of federal grants or funding available for schools.

    Federal, state, and district education agencies serve different roles in the education sector but have mutually beneficial responsibilities that should complement and support one another. The solution isn’t to supplant federal data collections with local ones, or vice versa, but instead to supplement local collections with federal collections like the National Teacher and Principal Survey (NTPS) so education decisionmakers at all levels have access to necessary information to make good decisions for our schools.
     
  2. Benchmarking and comparability are limited. Without federal data collections, it can be difficult or impossible for states, districts, and local policymakers to compare their schools and educators with those in other areas because of the lack of common focus and definitions across data collections. Even if the topics being collected are similar, individualized district or state surveys can differ widely in both content and wording.

    National data collections—like the NTPS—are excellent tools local policymakers should use when setting priorities on behalf of the students and staff in their state or district. Since the data from the NTPS are collected from educators in the same way across the entire country, they can be used to establish benchmarks against which local collections can measure themselves.
     
  3. Lack of participation decreases the representativeness of storytelling. If districts do not approve NCES’s survey research applications, we are unable to reach educators in certain schools, which can limit the kinds of perspectives that are included in the data. To paint a true picture of the education landscape, our survey teams select districts, schools, and/or educators that are as representative of the education field as possible.

    Teachers and principals who participate in NCES studies are grouped in different ways—such as by age, race/ethnicity, or the type of school at which they work—and their information is studied to identify patterns of experiences that people in these different groups may have had. This is what makes our datasets representative, or similar enough to the demographics of the population to able to accurately reflect the characteristics of everyone (even those who aren’t sampled to participate).

    For example, the NTPS is designed to support analysis of a variety of subgroups, such as those by
  • school level (i.e., elementary, middle, high, and combined);
     
  • school community type (i.e., urban, suburban, town, and rural);
     
  • teachers’ and principals’ years of experience in the profession; and
     
  • race/ethnicity of teachers and principals (figure 1).

These diverse subgroups are critically important for both federal and local policymakers who want to make decisions using information that truly represents everyone in the field.


Figure 1. Percentage of K–12 public and private school teachers who reported that they have any control over various areas of planning and teaching in their classrooms, by school type and selected school characteristic: 2020–21 


NOTE: Data are weighted estimates of the population. Response options included “no control,” “minor control,” “moderate control,” and “a great deal of control.” Teachers who reported “minor control,” “moderate control,” or “a great deal of control” were considered to have reported having “any control.”
SOURCE: U.S. Department of Education, National Center for Education Statistics, National Teacher and Principal Survey (NTPS), “Public and Private School Teacher Data File,” 2020–21.


Larger datasets allow for more nuanced comparisons by school, principal, or teacher characteristics that aren’t possible in smaller datasets, allowing for more equity in national and local estimates and more distinct answers to key policy questions. But we need district-level support to provide these nuanced data.

Although the NTPS has a fairly large sample to support state representation, it still only includes a small percentage of all schools and educators in the country. Sampling is used to avoid collecting data from all systems, staff, and students, thus helping to limit overall respondent burden on our education system. For this reason, it’s important that all sampled schools and educators participate if selected. Since some districts also have formal review processes—through which a survey must be approved before any schools or educators can be contacted—it is also important that districts with sampled schools grant NCES surveys permission to collect data from their schools.

Both levels of participation will help us collect data that accurately describe a state or population. Otherwise, the story we are telling in the data is only augmenting some voices—and these are the experiences that will be reflected in federal policy and funding.


As the education sector strives to understand the needs of students and staff on the tails of the coronavirus pandemic, trustworthy data are only becoming more critical to the decisionmaking process. NCES datasets like the NTPS are critical resources that federal, state, and district policymakers can and have used for benchmarking strategic goals or conducting analyses on how a topic has (or hasn’t) changed over time.

The catch being, of course, that all data on the NTPS—and many other NCES surveys—come directly from schools, principals, and teachers themselves. These analyses and reports are not possible without district and educator participation. While it may seem counterintuitive that any one person could make such a large difference in federal education policy, the concept doesn’t differ from civic duties such as voting in federal or local elections.

Below is a visual summary of this blog post that can be used in your own professional discussions about the importance of participating in federal education surveys.


NCES would like to thank every district, school, administrator, teacher, parent, and student who has previously approved or participated in an NCES survey. We wouldn’t be able to produce our reports and data products without your participation.

We are currently conducting the 2023–24 NTPS to learn more about school and educator experiences following the pandemic. Find more information about the NTPS, including findings and details from prior collections.


By Maura Spiegelman and Julia Merlin, NCES

NCES Celebrates IES and NCES Anniversaries With Retrospective Report on Federal Education Statistics

This year marks the 20th anniversary of the Institute of Education Sciences (IES) and 155 years since the creation of a federal agency to collect and report education statistics for the United States, a role now fulfilled by the National Center for Education Statistics (NCES). To celebrate both of these anniversaries, NCES has just released a new commemorative report—A Retrospective Look at U.S. Education Statistics—that explores the history and use of federal education statistics.


The 11 statistical profiles in phase I of this report can be found within two tabs: Elementary and Secondary Education and Postsecondary Education. Users can toggle between these two tabs and then select a particular statistical profile in the drop-down menu, such as Number of Elementary and Secondary Schools, High School Coursetaking, Enrollment in Postsecondary Institutions, and Postsecondary Student Costs and Financing.


Image of report website showing tabs for Elementary and Secondary Education and Postsecondary Education and the drop-down menu to select individual statistical profiles


Each of the statistical profiles in this report is broken down into the following sections:

  • what the statistic measures (what the data may indicate about a particular topic)
  • what to know about the statistic (the history of the data collection and how it may have changed over time)
  • what the data reveal (broad historical trends/patterns in the data, accompanied by figures)
  • more information (reference tables and related resources)

Each statistical profile can be downloaded as a PDF, and each figure within a profile can be downloaded or shared via a link or on social media.

For background and context, this report also includes a Historical Event Timeline. In this section, readers can learn about major periods of prolonged economic downturn, periods of military action, and periods when U.S. troops were drafted as a part of military action—as well as major pieces of federal legislation—and how some of these events could have disrupted the nation’s social life and schooling or impacted education across the country.

The report also includes a brief overview of NCES, which can be accessed by expanding the dark blue bar labeled NCES Overview: Past, Present, and Future. This section covers the history of NCES and its mission, the evolution of NCES reports and data collections, and current and future changes to NCES’s reporting methods.


Image of report website showing introductory text and the NCES Overview blue bar


This commemorative guide to federal education statistics is not intended to be a comprehensive report on the subject but rather a resource that provides an in-depth look at a selection of statistics. Stay tuned for the release of phase II next year, which will include additional statistical profiles. Be sure to follow NCES on TwitterFacebookLinkedIn, and YouTube and subscribe to the NCES News Flash to stay up-to-date!


By Megan Barnett, AIR