NCES Blog

National Center for Education Statistics

NHES Data Files Provide Researchers Supplemental Information on Survey Respondents’ Communities

Increasingly, researchers are merging survey data with data from external sources, such as administrative data or different surveys, to enhance analyses. Combining data across sources increases the usefulness of the data while minimizing the burden on survey respondents.

In September, the National Household Education Surveys Program (NHES) released restricted-use supplemental geocode data files that use sample respondents’ addresses to integrate the 2016 NHES Parent and Family Involvement in Education (PFI), Early Childhood Program Participation (ECPP), and Adult Training and Education (ATES) survey data with data from other collections. The supplemental geocode files include additional geographic identifiers, characteristics of respondents’ neighborhoods and local labor markets, radius-based measures of household proximity to job search assistance and educational opportunities, and, for surveys focused on children, school district identifiers based on home addresses and school district characteristics.

The new data can complement researchers’ analyses of data from all three surveys. Researchers can expand their analyses of school choice and access to K–12 schooling options using the PFI survey data. Those interested in analyses of decisions about children’s early education can use the ECPP survey data to look at the availability of Head Start programs, preschools in private schools near children’s homes, and the prevalence of prekindergarten programs in local school districts. Researchers interested in nondegree credential attainment and training for work can use data from the ATES to find information on local labor markets and the number of American Job Centers near respondents’ homes.

The NHES:2016 restricted-use supplemental geocode files are available to restricted-use license holders to be used in conjunction with the NHES:2016 survey data files. To access the full set of NHES:2016 geocode supplemental restricted-use data files, apply for a restricted-use license. You can also browse the list of variables in the supplemental geocode files.


By Emily Isenberg and Sarah Grady, NCES

Higher Rates of Homeschooled Students Than Enrolled Students Participated in Family Learning Activities in 2016

About 3 percent of the school-age population—around 1.7 million students—was homeschooled in 2016. We know that homeschooled students have different educational experiences than students who are enrolled in public or private schools, and recently released data explore some of those differences.

The Parent and Family Involvement in Education survey of the National Household Education Surveys Program (NHES) provides information on homeschooled and public and private school students based on a nationally representative sample. Parents provide information about their children’s formal education and learning activities outside of school.

The survey asks about six broad types of family learning activities that students experienced in the month prior to the survey. The 2016 results indicate that homeschooled students were more likely than their peers enrolled in public or private schools to participate in five of these six activities.

In 2016, higher percentages of homeschooled students than of students enrolled in public or private schools visited a library; a bookstore; an art gallery, museum, or historical site; and a zoo or aquarium in the month prior to completion of the survey (figure 1). A higher percentage of homeschooled students also attended an event sponsored by a community, religious, or ethnic group with their parents in the month prior to completion of the survey. The one activity for which there was no measurable difference between homeschooled and students enrolled in public or private schools was going to a play, concert, or other live show.


Figure 1. Percentage of 5- to 17-year-old students participating in selected family learning activities in the past month, by homeschool and enrollment status: 2016


NOTE: Includes 5- to 17-year-old students in grades or grade equivalents of kindergarten through grade 12. Homeschooled students are school-age children who receive instruction at home instead of at a public or private school either all or most of the time. Excludes students who were enrolled in public or private school more than 25 hours per week and students who were homeschooled only because of temporary illness. Selected activities with the child may have included any member of the household.

SOURCE: U.S. Department of Education, National Center for Education Statistics, Parent and Family Involvement in Education Survey of the National Household Education Surveys Program (PFI-NHES), 2016.


The NHES data do not tell us why these differences exist, but parents’ availability of time and parenting style may be a factor. However, more research is needed to understand these differences.

A recent report, Homeschooling in the United States: Results from the 2012 and 2016 Parent and Family Involvement Survey (PFI-NHES:2012 and 2016), provides the full complement of data from the NHES about homeschoolers’ experiences in 2016. In addition to family learning activities, the report provides information about the following:
 

  • Homeschooler demographics

  • Reasons for homeschooling

  • Providers of homeschool instruction

  • Amount of time homeschoolers spent attending public schools, private schools, or college

  • Participation in local homeschool group activities

  • Homeschool teaching styles

  • Sources of homeschool curriculum and books

  • Online coursetaking of homeschool students

  • Homeschool subject areas

  • Parent expectations of homeschooled students’ future education
     

For more information on the National Household Education Surveys Program, please go to https://nces.ed.gov/nhes/.


By Sarah Grady

Cost Considered “Very Important” to Parents Who Chose Relatives as Caregivers for Young Children

When it comes to choosing a child care arrangement, cost is a big factor in the choices parents make, according to recently released data from the National Center for Education Statistics (NCES).

Every 3 years, NCES conducts the Early Childhood Program Participation (ECPP) component of the National Household Education Surveys Program (NHES) to answer questions about young children’s care and education before starting kindergarten. The ECPP survey reported that 60 percent of children under age 5 who were not yet in kindergarten participated in at least one weekly nonparental care arrangement in 2016. Of those receiving nonparental care,

  • 42 percent received only center-based care;
  • 25 percent received only relative care;
  • 20 percent received multiple types of care; and
  • 12 percent received only nonrelative care.

When asked what factors influenced their choice of child care arrangements, 51 percent of parents ranked the cost as “very important” when selecting an arrangement in 2016. This percentage was higher among parents of children in relative care (63 percent) than among parents of children in multiple types of care arrangements (50 percent) and parents of children only in center-based care (47 percent).

Overall, in 2016, some 39 percent of parents with children in nonparental care reported that they had difficulty finding child care. This rate was lowest for parents of children only in relative care (23 percent) and highest for parents of children only in nonrelative care (53 percent). However, among parents who had difficulty trying to find child care, cost was a larger concern for those with children only in relative care than it was for those with children in other arrangements (see figure 1).


Figure 1. Percentage of children under age 5 whose parents reported that cost was the primary reason for difficulty finding child care arrangements, by type of arrangement: 2016

NOTE: Data are for children participating in at least one weekly nonparental care arrangement. Excludes children enrolled in kindergarten.

SOURCE: U.S. Department of Education, National Center for Education Statistics, The Costs of Child Care: Results From the 2016 Early Childhood Program Participation Survey (ECPP-NHES:2016).


In 2016, fees were less common and costs were generally lower for parents with children in relative care than for parents with children in other types of nonparental care arrangements. Thirty-two percent of parents with children in at least one care arrangement were not charged fees for care, and 58 percent of those children were in relative care. Among children in relative care, 80 percent were cared for by grandparents. When parents paid grandparents for their children’s care, they paid an average of $4.86 per hour, less than the average across all types of care arrangements ($6.93 per hour).

For more detailed information about costs of child care, see The Costs of Child Care: Results From the 2016 Early Childhood Program Participation Survey (ECPP-NHES:2016).


By Tracae McClure and Sarah Grady

Announcing the Condition of Education 2018 Release

We are pleased to present The Condition of Education 2018, a congressionally mandated annual report summarizing the latest data on education in the United States. This report is designed to help policymakers and the public monitor educational progress. This year’s report includes 47 indicators on topics ranging from prekindergarten through postsecondary education, as well as labor force outcomes and international comparisons. 

In addition to the regularly updated annual indicators, this year’s spotlight indicators highlight new findings from recent NCES surveys. The first spotlight indicator examines the choices and costs that families face as they select early childhood care arrangements. Drawing on data from the NCES National Household Education Survey, the indicator finds that early childhood care expenses were higher in 2016 than in 2001. For example, families’ average hourly out-of-pocket expenses for center-based care were 72 percent higher in 2016 ($7.60) than in 2001 ($4.42), in constant 2016–17 dollars. The indicator also finds that in 2016, some 57 percent of children under the age of 6 had parents who reported there were good choices for child care where they lived. Among children whose parents reported difficulty finding child care in 2016, some 32 percent cited cost as the primary reason. The complete indicator, Early Childhood Care Arrangements: Choices and Costs, contains more information about how these findings varied by family income, race/ethnicity, locale (urban, suburban, town, or rural), and children’s age.


Average hourly out-of-pocket child care expense for children under 6 years old and not yet in kindergarten whose families paid for child care, by primary type of child care arrangement: 2001 and 2016

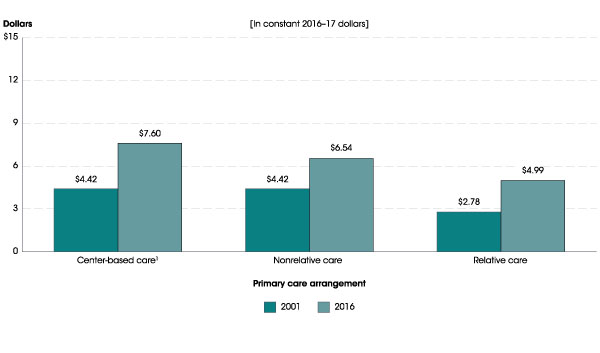
1 Center-based arrangements include day care centers, Head Start programs, preschools, prekindergartens, and childhood programs.
NOTE: Estimates include only those children whose families paid at least part of the cost out of pocket for their child to receive nonparental care at least weekly.
SOURCE: U.S. Department of Education, National Center for Education Statistics, Early Childhood Program Participation Survey of the National Household Education Surveys Program (ECPP-NHES: 2001 and 2016). See Digest of Education Statistics 2017, table 202.30c.


The second spotlight describes the characteristics of teachers who entered the teaching profession through an alternative route to certification program. Compared to those who entered through a traditional route, higher percentages of alternative route teachers in 2015–16 were Black (13 vs. 5 percent), Hispanic (15 vs. 8 percent), of Two or more races (2 vs. 1 percent), and male (32 vs. 22 percent), and lower percentages were White (66 vs. 83 percent). Overall, 18 percent of public school teachers in 2015–16 had entered teaching through an alternative route to certification program. The percentages were higher among those who taught career or technical education (37 percent), natural sciences (28 percent), foreign languages (26 percent), English as a second language (24 percent), math and computer science (22 percent), and special education (20 percent). The analysis also examines how the prevalence of alternative route teachers varies between charter schools and traditional public schools, between high and low poverty schools, and between schools that enroll high or low percentages of racial/ethnic minority students. For more findings from this analysis of data from the National Teacher and Principal Survey, see the complete indicator, Characteristics of Public School Teachers Who Completed Alternative Route to Certification Programs.


Percentage distribution of public elementary and secondary school teachers, by route to certification and race/ethnicity: 2015–16

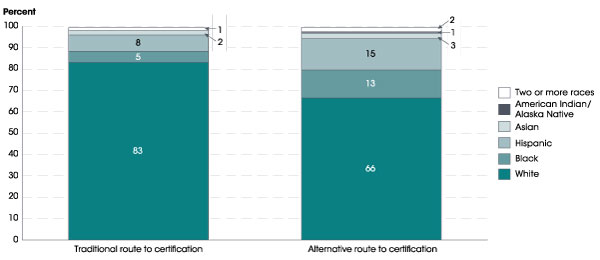
NOTE: Teachers were asked whether they entered teaching through an alternative route to certification program, which is a program that was designed to expedite the transition of nonteachers to a teaching career (for example, a state, district, or university alternative route to certification program). Detail may not sum to totals because of rounding. Race categories exclude persons of Hispanic ethnicity. Data for American Indian/Alaska Native teachers who entered teaching through a traditional route and Pacific Islander teachers who entered teaching through traditional and alternative routes round to zero and are not displayed.
SOURCE: U.S. Department of Education, National Center for Education Statistics, National Teacher and Principal Survey (NTPS), “Public School Teacher Data File,” 2015–16. See Digest of Education Statistics 2017, table 209.24.


The third spotlight presents data on average student loan balances for students completing graduate degrees. Using data from the National Postsecondary Student Aid Study, this indicator examines how average student loan balances changed between 1999–2000 and 2015–16, and how those trends varied by degree type. Among graduate school completers who had student loans for undergraduate or graduate studies, average student loan balances increased for all degree types (in constant 2016–17 dollars). For example, average student loan balances for students who completed research doctorate degrees, such as a Ph.D., doubled during this time period, from $53,500 to $108,400 (an increase of 103 percent). Average student loan balances increased by 90 percent for those who completed professional doctorate degrees, such as medical doctorates and law degrees (from $98,200 to $186,600). The complete indicator, Trends in Student Loan Debt for Graduate School Completers, also describes how average student loan balances varied among specific degree programs, such as medical doctorates, law degrees, and master’s degrees in business administration.


Average cumulative student loan balance for graduate school completers, by degree type: Selected years, 1999–2000 through 2015–16

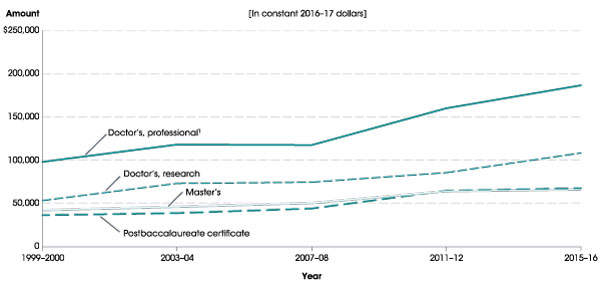
1 Includes chiropractic, dentistry, law, medicine, optometry, pharmacy, podiatry, and veterinary medicine. 
NOTE: Data refer to students who completed graduate degrees in the academic years indicated. Includes student loans for undergraduate and graduate studies. Average excludes students with no student loans.
SOURCE: U.S. Department of Education, National Center for Education Statistics, 1999–2000, 2003–04, 2007–08, 2011–12, and 2015–16 National Postsecondary Student Aid Study (NPSAS:2000, NPSAS:04, NPSAS:08, NPSAS:12, and NPSAS:16). See Digest of Education Statistics 2017, table 332.45.


The Condition includes an At a Glance section, which allows readers to quickly make comparisons within and across indicators, and a Highlights section, which captures key findings from each indicator. The report contains a Reader’s Guide, a Glossary, and a Guide to Sources that provide additional background information. Each indicator provides links to the source data tables used to produce the analyses.

As new data are released throughout the year, indicators will be updated and made available on The Condition of Education website. In addition, NCES produces a wide range of reports and datasets designed to help inform policymakers and the public. For more information on our latest activities and releases, please visit our website or follow us on Twitter, Facebook, and LinkedIn.

By James L. Woodworth, NCES Commissioner 

A Fresh Look at Homeschooling in the U.S.

By Sarah Grady

From 1999 to 2012, the percentage of students who were homeschooled doubled, from an estimated 1.7 percent to 3.4 percent. But that increase appears to have leveled off, according to newly released data. In 2016, about 1.7 million students (ages 5-17) were estimated to be homeschoolers, which translates to about 3.3 percent of all K-12 students. This rate is not statistically different from the percentage in 2012.


* Statistically adjusted
SOURCE: U.S. Department of Education, National Center for Education Statistics, Parent Survey of the National Household Education Surveys Program (NHES), 1999; Parent and Family Involvement in Education Survey of the NHES, 2003, 2007, 2012, and 2016.


These data come from the recently released First Look report on the Parent and Family Involvement in Education (PFI) survey from the National Household Education Surveys Program (NHES). In this survey, parents were asked a number of questions about their child’s education. Using these data, NCES is able to identify students who are schooled at home instead of school for some or all classes.[1]

So, why did parents say they homeschooled their kids? The most important reason for homeschooling in 2016 was “concern about the school environment, such as safety, drugs, or negative peer pressure,” reported by 34 percent of parents of homeschooled students. (This was also the most commonly reported reason selected by parents in 2012.)  Other reasons cited as most important by families of homeschooled students in 2016 were dissatisfaction with academic instruction at other schools (17 percent of homeschooled students’ parents) and a desire to provide religious instruction (16 percent).

The PFI survey is uniquely suited to collect data about homeschooled students because it collects data from households rather than schools or other institutions. It includes a suite of surveys designed to capture data related to learning at all ages and is ideal for trend analyses because of the repeated measures over time. The NHES:2016 First Look report for the PFI data also provides key estimates related to school communication with parents, homework, parents’ involvement in their students’ education, and homeschooling. The data will be available to researchers in the coming months. Check the NHES website for updates.


[1]Students who are homeschooled primarily because of a temporary illness and students who attend school for more than 25 hours per week are not counted in NCES’s estimate of homeschooling.