NCES Blog

National Center for Education Statistics

Announcing the Condition of Education 2022 Release

NCES is pleased to present the 2022 edition of the Condition of Education. The Condition is part of a 150-year tradition at NCES and provides historical and contextual perspectives on key measures of educational progress to Congress and the American public. This report uses data from across NCES and from other sources and is designed to help policymakers and the public monitor the latest developments and trends in U.S. education.

Cover of Report on the Condition of Education with IES logo and photos of children reading and writing

The foundation of the Condition of Education is a series of online indicators. Fifty-two of these indicators include content that has been updated this year. Each indicator provides detailed information on a unique topic, ranging from prekindergarten through postsecondary education, as well as labor force outcomes and international comparisons. In addition to the online indicator system, a synthesized overview of findings across topics is presented in the Report on the Condition of Education.

This year, we are excited to begin the rollout of interactive figures. These new interactive figures will empower users to explore the data in different ways. A selection of these indicators are highlighted here. They show various declines in enrollment that occurred during the coronavirus pandemic, from early childhood through postsecondary education. (Click the links below to explore the new interactive figures!)

  • From 2019 to 2020, enrollment rates of young children fell by 6 percentage points for 5-year-olds (from 91 to 84 percent) and by 13 percentage points for 3- to 4-year-olds (from 54 to 40 percent).
  • Public school enrollment in prekindergarten through grade 12 dropped from 50.8 million in fall 2019 to 49.4 million students in fall 2020. This 3 percent drop brought total enrollment back to 2009 levels (49.4 million), erasing a decade of steady growth.
  • At the postsecondary level, total undergraduate enrollment decreased by 9 percent from fall 2009 to fall 2020 (from 17.5 million to 15.9 million students). For male and female students, enrollment patterns exhibited similar trends between 2009 and 2019 (both decreasing by 5 percent). However, from 2019 to 2020, female enrollment fell 2 percent, while male enrollment fell 7 percent. Additionally, between 2019 and 2020, undergraduate enrollment fell 5 percent at public institutions and 2 percent at private nonprofit institutions. In contrast, undergraduate enrollment at for-profit institutions was 4 percent higher in fall 2020 than in fall 2019, marking the first positive single year change in enrollments at these institutions since 2010. Meanwhile, at the postbaccalaureate level, enrollment increased by 10 percent between fall 2009 and fall 2020 (from 2.8 million to 3.1 million students).
  • Educational attainment is associated with economic outcomes, such as employment and earnings, as well as with changes in these outcomes during the pandemic. Compared with 2010, employment rates among 25- to 34-year-olds were higher in 2021 only for those with a bachelor’s or higher degree (84 vs 86 percent). For those who had completed high school and those with some college, employment rates increased from 2010 to 2019, but these gains were reversed to 68 and 75 percent, respectively, during the coronavirus pandemic. For those who had not completed high school, the employment rate was 53 percent in 2021, which was not measurably different from 2019 or 2010.

This year’s Condition also includes two spotlight indicators. These spotlights use data from the Household Pulse Survey (HPS) to examine education during the coronavirus pandemic.

  • Homeschooled Children and Reasons for HomeschoolingThis spotlight opens with an examination of historical trends in homeschooling, using data from the National Household Education Survey (NHES). Then, using HPS, this spotlight examines the percentage of adults with students under 18 in the home who were homeschooled during the 2020–21 school year. Some 6.8 percent of adults with students in the home reported that at least one child was homeschooled in 2020–21. The percentage was higher for White adults (7.4 percent) than for Black adults (5.1 percent) and for Asian adults (3.6 percent). It was also higher for Hispanic adults (6.5 percent) than for Asian adults.
  • Impact of the Coronavirus Pandemic on Fall Plans for Postsecondary Education: This spotlight uses HPS data to examine changes in plans for fall 2021 postsecondary education made in response to the coronavirus pandemic. Among adults 18 years old and over who had household members planning to take classes in fall 2021 from a postsecondary institution, 44 percent reported that there was no change for any household member in their fall plans for postsecondary classes. This is compared with 28 percent who reported no change in plans for at least one household member one year earlier in the pandemic, for fall 2020.

The Condition also includes an At a Glance section, which allows readers to quickly make comparisons within and across indicators, as well as a Reader’s Guide, a Glossary, and a Guide to Sources that provide additional information to help place the indicators in context. In addition, each indicator references the source data tables that were used to produce that indicator. Most of these are in the Digest of Education Statistics.

In addition to publishing the Condition of Education, NCES produces a wide range of other reports and datasets designed to help inform policymakers and the public about significant trends and topics in education. More information about the latest activities and releases at NCES may be found on our website or by following us on Twitter, Facebook, and LinkedIn.


By Peggy G. Carr, NCES Commissioner

Changes in Pupil/Teacher Ratios in 2020: Impacts of the COVID-19 Pandemic

The COVID-19 pandemic has brought enormous challenges to the education system, including a historic decline in enrollment in fall 2020—the largest since during World War II. Due to the relatively small decrease in the number of teachers, there was a significant drop in the pupil/teacher ratio.  

The National Center for Education Statistics (NCES) releases key statistics, including school staffing data, compiled from state administrative records through the Common Core of Data (CCD). In 2019, about 48 percent of public school staff were teachers (3.2 million) and 13 percent were instructional aides (0.9 million). NCES’s new School Pulse Panel survey found that in January 2022, about 61 percent of public schools with at least one vacancy reported that the pandemic increased the number of teacher and staff vacancies, and 57 percent of schools with at least one vacancy found that the pandemic forced them to use teachers outside their normal duty areas.

Pupil/teacher ratios provide a measure of the quantity of instructional resources available to students by comparing the number of students with the total full-time equivalent (FTE) of all teachers, including special education teachers. The public and private elementary and secondary average class size is larger than the pupil/teacher ratio since it normally does not factor into team teaching, specialty teachers, or special education classes. Between fall 2019 and fall 2020, enrollment in public elementary and secondary schools1 decreased by 2.7 percent.2 This decrease was larger than the 0.2 percent (6,700)3 decrease in the number of public school teachers. Since fall 2020, public school enrollment decreased by a larger amount than did the number of teachers. Thus, the pupil/teacher ratio declined in school year 2020–21 by a relatively large 0.5 pupils per teacher, from 15.9 to 15.4 pupils per teacher (figure 1). This is the largest 1-year decrease in more than 4 decades. In comparison, the pupil/teacher ratio for private schools was 11.4 in 2019–20 (the latest year of actual data available). It is worth noting that pupil/teacher ratios vary across schools with different characteristics (table 208.10).

Viewed over a longer term, the pupil/teacher ratio in public schools in 2019–20 (15.9) was only slightly lower than in 2010–11 (16.0), so nearly all the change during the 2010–11 to 2020–21 period occurred in the last year. The pupil/teacher ratio for private schools decreased from 12.5 in 2010–11 to 11.4 in 2019–20.


Figure 1. Pupil/teacher ratio in public and private elementary and secondary schools: 2010–11 to 2020–21

Line graph showing pupil/teacher ratio in public and private elementary and secondary schools from 2010–11 to 2020–21

NOTE: Data in this figure represent the 50 states and the District of Columbia. Data for teachers are expressed in full-time equivalents (FTE). Counts of private school enrollment include prekindergarten through grade 12 in schools offering kindergarten or higher grades. Counts of private school teachers exclude teachers who teach only prekindergarten students. Counts of public school teachers and enrollment include prekindergarten through grade 12. The pupil/teacher ratio includes teachers for students with disabilities and other special teachers, while these teachers are generally excluded from class size calculations. Ratios for public schools reflect totals reported by states and differ from totals reported for schools or school districts.  The school year 2020–21 pupil/teacher ratio shown in this figure includes only states which reported both membership and FTE teacher counts for SY 2020–21.

SOURCE: U.S. Department of Education, National Center for Education Statistics, Digest of Education Statistics 2021, table 208.20; Common Core of Data, table 2.


The declines in pupil/teacher ratios in public schools were not consistent across states between 2019–20 and 2020–21 (figure 2). The relatively large enrollment decreases in many states—along with the smaller decreases or even increases in the number of teachers in fall 2020—led to decreases in the pupil/teacher ratios for most states. Three states (Nevada, Florida, and Ohio) reported increases in their pupil/teacher ratios, and the rest of the states reporting data had decreases in their pupil/teacher ratios. The states with the largest decreases in their pupil/teacher ratios were Indiana (-1.3 pupils per teacher), Arizona (-1.1 pupils per teacher), Kansas (-0.9 pupils per teacher), and Kentucky (-0.9 pupils per teacher).4


Figure 2. Change in pupil/teacher ratios in public elementary and secondary schools, by state: 2019–20 to 2020–21

Map of United States showing increases and decreases in pupil/teacher ratios in public elementary and secondary schools from 2019–20 to 2020–21

NOTE: Data for Illinois and Utah are not available.

SOURCE: U.S. Department of Education, National Center for Education Statistics, Common Core of Data (CCD), “State Nonfiscal Public Elementary/Secondary Education Survey,” 2019–20 v.1a, table 2, and 2020–21 v.1a, table 2.


By Tom Snyder, AIR


[1] Counts of public school teachers and enrollment include prekindergarten through grade 12.

[2] Enrollment data are for fall of the school year while pupil/teacher ratios are based on school years.

[3] Includes imputed teacher FTE data for Illinois and Utah.

[4] Although Oregon had a 2 pupil per teacher decrease based on the Summary Table 2 for 2019–20 and 2020–21, Oregon did not submit prekindergarten data for 2020–21, so the ratios were not comparable.

NCES Activities Dedicated to Understanding the Condition of Education During the Coronavirus Pandemic

The emergence of the coronavirus pandemic 2 years ago shifted not only how students received educational services around the world but also how the National Center for Education Statistics (NCES) carried out its mission, which is to collect, analyze, and report statistics on the condition of education in the United States.

NCES has conducted several surveys to measure educational enrollment, experiences, and outcomes as part of existing data collections and created new, innovative, and timely data initiatives. NCES is currently fielding more than 15 projects with information related to the pandemic. Since early 2020, NCES has collected information about educational experiences of students from elementary through postsecondary institutions. A few of the data collections will extend beyond 2022, providing rich data resources that will document changes in the educational landscape throughout the lifecycle of the pandemic.


NCES Coronavirus Pandemic Data Collection Coverage


In order to respond to the call for information about how students learned during widespread school disruptions, NCES modified existing and created new data collection avenues to receive and report vital information in unprecedented ways. Below are summaries of some of the data products available.

Looking ahead, NCES will provide NAEP data on how student performance has changed in various subjects since the coronavirus pandemic began. NCES will also collect and report information about learning contexts, which are critical for understanding educational outcomes. NCES will also develop a new system to share pandemic-related data collected across the center.

All of these resources are currently available or will be available on the NCES website.


By Ebony Walton and Josh DeLaRosa, NCES

New Projected Data Through 2030 to Be Included in Digest of Education Statistics

NCES is excited to announce the inclusion of new projected data as part of the Digest of Education Statistics: 2021. These new data include projections of education statistics through 2030 and account for impacts of the coronavirus pandemic.

Since 1964, NCES has produced the Projections of Education Statistics, which includes statistics ranging from elementary/secondary enrollment to teacher counts to postsecondary degrees earned. To produce these estimates, NCES uses models that apply historical trends in education to forecasted trends in demographics and the economy.

Each edition of the Projections provides revisions to estimates from the year before. These revisions can be the result of designed model improvements or incidental changes to the underlying data that feed the models. With the long-term impacts of the pandemic uncertain, NCES made minimal changes to the projection models in favor of consistency (for more information on how these forecasts have been produced historically, see the Technical Appendixes). However, due to the disruption of the coronavirus pandemic, changes to underlying data were more pronounced than usual.

For example, enrollment levels—particularly during compulsory elementary and secondary grades—are strongly determined by the size of the school-aged population. NCES’s projections rely on population projections, which are licensed from IHS Markit. IHS Markit’s population projections reflect a decline in birth rates during the coronavirus pandemic.1 These population projections will impact projected enrollment levels as smaller birth cohorts mature to school age.

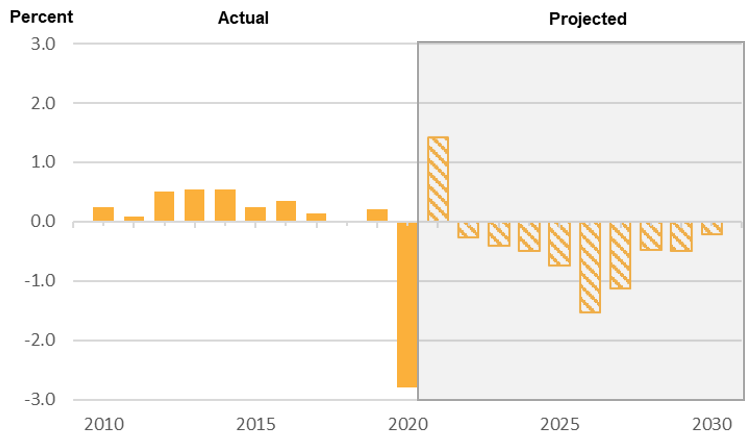
Specifically, Digest table 203.10 reports projected data for enrollment in public elementary and secondary schools by grade over time. Between fall 2019 and fall 2020, total public school enrollment dropped by 3 percent (figure 1). By 2030, total public school enrollment is projected to decrease another 4 percent. However, public school enrollments are projected to be higher in 2021 than they were in 2020. Although public school enrollment is not projected to return to 2019 levels, it is projected to remain higher than 2020 levels through 2024. In other words, the projected decrease in public school enrollments over the next decade is not a direct continuation of the pandemic-related drop observed between fall 2019 and fall 2020. Rather, it is primarily a reflection of changes in the school-age population.


Figure 1. Annual percentage change in enrollment in public elementary and secondary schools: Fall 2010 to fall 2030
NOTE: Data are for the 50 states and the District of Columbia. Data include both traditional public schools and public charter schools. Data include imputations for nonreported prekindergarten enrollment in California for fall 2019 and 2020 and in Oregon for fall 2020. Data include imputations for nonreported enrollment for all grades in Illinois for fall 2020.

SOURCE: U.S. Department of Education, National Center for Education Statistics, Common Core of Data (CCD), "State Nonfiscal Survey of Public Elementary/Secondary Education," 2010–11 through 2020–21. See Digest of Education Statistics 2021, table 203.10.


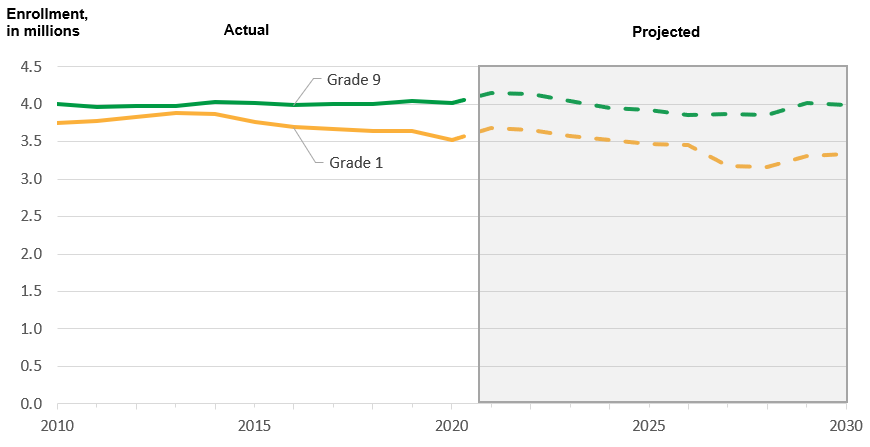
The relationship between population and enrollment in elementary and secondary grades can be seen even more clearly by comparing projected enrollments for different grade levels. Children conceived during the pandemic will begin to age into first grade in large numbers beginning in 2027. In contrast, no children conceived during the pandemic will have aged into grade 9 by the end of the projection period in 2030. Figure 2 shows a pronounced dip in public school enrollment in grade 1 in 2027 and 2028, which is not present at grade 9. Specifically, public school enrollment in grade 1 is projected to be 8 percent lower in both 2027 and 2028 than in 2026. Meanwhile, the difference in these years for grade 9 is less than 1 percent (rounds to 0 percent). This is a direct reflection of projected declines in birth rates during the pandemic and the relationship between the school-age population and enrollment levels.


Figure 2. Enrollment in public schools, by selected grade: Fall 2010 through fall 2030
NOTE: Data are for the 50 states and the District of Columbia. Data include both traditional public schools and public charter schools. The total ungraded counts of students were prorated to prekindergarten through grade 8 and grades 9 through 12 based on the known grade-level distribution of a state. Data include imputations for nonreported prekindergarten enrollment in California for fall 2019 and 2020 and in Oregon for fall 2020. Data include imputations for nonreported enrollment for all grades in Illinois for fall 2020. Some data have been revised from previously published figures.

SOURCE: U.S. Department of Education, National Center for Education Statistics, Common Core of Data (CCD), "State Nonfiscal Survey of Public Elementary/Secondary Education," 2010–11 through 2020–21. See Digest of Education Statistics 2021, table 203.10.


All of NCES’s projections are heavily impacted by population forecasts. In addition, certain statistics—such as public school expenditures and postsecondary enrollments—are also shaped by economic forecasts. Like their population projections, IHS Markit’s economic forecasts have also factored in effects of the pandemic. This is another way in which forthcoming projections of education statistics account for pandemic-related impacts.

Digest tables featuring additional projections will be released on a rolling basis throughout the year. Be sure to bookmark this page for the most up-to-date tables.

Explore the first batch of tables from Digest 2021 with projected data:

  • Enrollment in public elementary and secondary schools, by level and grade: Selected years, fall 1980 through fall 2030 (table 203.10)
  • Enrollment in public elementary and secondary schools, by region, state, and jurisdiction: Selected years, fall 1990 through fall 2030 (table 203.20)
  • Public school enrollment in prekindergarten through grade 8, by region, state, and jurisdiction: Selected years, fall 1990 through fall 2030 (table 203.25)
  • Public school enrollment in grades 9 through 12, by region, state, and jurisdiction: Selected years, fall 1990 through fall 2030 (table 203.30)
  • Enrollment and percentage distribution of enrollment in public elementary and secondary schools, by race/ethnicity and region: Selected years, fall 1995 through fall 2030 (table 203.50)
  • Enrollment and percentage distribution of enrollment in public elementary and secondary schools, by race/ethnicity and level of education: Fall 1999 through fall 2030 (table 203.60)
  • Public and private elementary and secondary teachers, enrollment, pupil/teacher ratios, and new teacher hires: Selected years, fall 1955 through fall 2030 (table 208.20)
  • Current expenditures and current expenditures per pupil in public elementary and secondary schools: 1989–90 through 2030–31 (table 236.15)


Explore previous editions of the Projections of Education Statistics.


By Véronique Irwin, NCES


[1] Declines in birth rates during the coronavirus pandemic have also been shown by government agencies including Census and the National Center for Health Statistics (as cited by Census).

2021–22 School Pulse Panel on the Impact of the COVID-19 Pandemic

To support schools and districts as they respond to the COVID-19 pandemic, the National Center for Education Statistics (NCES) has launched the School Pulse Panel (SPP). The SPP will increase our ability to report timely information on the operating status of public schools. This effort is part of the Institute of Education Sciences (IES) response to the Executive Order on Supporting the Reopening and Continuing Operation of Schools and Early Childhood Education Providers

The SPP is a monthly survey completed by a small group of schools to help education leaders understand the impact of the COVID-19 pandemic on education across the country. NCES, within the U.S. Department of Education, is conducting this study in coordination with the U.S. Census Bureau and other federal agencies.

Accessing Survey Findings

NCES releases reports about 4 weeks after each monthly collection via an online dashboard. Results from the summer 2021September 2021, and January 2022 data collections are available now. Check back to see the latest findings. 

Survey Topics

The survey asks questions on the following topics, which focus on how COVID-19 has affected schools (note that survey content will change slightly on a monthly basis):

  • Instructional mode offered by schools
  • Strategies to address pandemic-related learning needs
  • Safe and healthy school mitigation strategies
  • Principal and staff experiences
  • Mental health and well-being of students and staff
  • Special education services
  • Use of technology
  • Information on staffing and food and nutrition programs
  • Parental/staff/student concerns

The graphic below shows the content areas for January 2022 through May 2022. The red boxes represent content areas that will repeat monthly; the yellow boxes represent content areas that will not repeat monthly.


More Information

To learn more, visit the School Pulse Panel website and explore the FAQs. For general questions, contact the U.S. Census Bureau at 1-844-868-3661 or via e-mail at addp.school.pulse.panel@census.gov.


By Josue DeLaRosa and Rachel Hansen, NCES