While federal, state, and district policymakers have used education data as the backbone of their policy and funding decisions for years, there’s nothing quite like a global pandemic to highlight the criticality of reliable data and illuminate the gaps in our collective knowledge.
In this two-part blog series, we’ll discuss the role of NCES as the primary federal entity for collecting and analyzing essential education data in the United States and highlight a specific NCES survey—the National Teacher and Principal Survey (NTPS)—which is designed to support state and district policymakers.
Federal, state, and district decisionmakers need reliable, trustworthy data to inform education funding and policy regulations. In order to enact good laws that best serve all of our students and school staff, they need data that are as diverse and representative as our schools. As a federal statistical agency, NCES fulfills a Congressional mandate to collect, analyze, and report statistics on the condition of U.S. education and is the primary source that policymakers and other decisionmakers rely on for education data. These efforts include administrative data collections and cross-sectional, longitudinal, and assessment surveys that gather information to help the education sector better understand early childhood, K–12, and postsecondary education nationally and internationally.
The NTPS exemplifies the utility of NCES data. NTPS data are available both nationally and by state (via the NTPS State Dashboard and DataLab) and are used by policymakers and researchers to make funding and other policy decisions. NCES also helps decisionmakers, researchers, and the public use and make sense of the data by providing access to NTPS datasets and publishing reports, such as numerous NTPS reports, the Condition of Education, and the Digest of Education Statistics.
The NTPS collects data about school conditions and the demographics of public and private K–12 teachers and principals directly from school staff themselves, providing critical data on educators’ perspectives and experiences in schools every day.
The NTPS has been collected in one form or another since 1987–88—when it was known as the Schools and Staffing Survey (SASS)—and was last conducted during the 2020–21 school year amid the coronavirus pandemic. The 2023–24 NTPS is currently being conducted.
Let’s use the NTPS to answer a few common questions about the role of federal education data.
1. Why do federal data matter to district policymakers if states and districts have their own local collections?
In a postpandemic world cleaved into “before” and “after,” policymakers at all levels need information on the condition of education across the country to craft policies that are truly reflective of the needs, challenges, and strengths of students and staff.
Since education in the United States is primarily a state and local responsibility, it can be difficult to make comparisons between states if we don’t have a federal agency collecting the data in a systematic and comparable way across the country. The NTPS, for example, publishes both public school data at the national and state levels and representative public and private school, principal, and teacher data for several characteristics (e.g., type of community in which a school is located; percentage enrollment of students of color; staff characteristics like race/ethnicity and years of experience).
Figure 1 shows an NTPS-based example of how using common questions across all school systems supports important cross-state comparisons. This is just one of hundreds of similar comparisons that have been made using NTPS data on topics such as teachers’ classroom experiences and principals’ challenges filling needed teacher vacancies. Comparisons can also focus on different school, principal, and teacher characteristics (e.g., type of community in which a school is located; level of training for staff; race/ethnicity of staff).
Figure 1. Percentage of public schools that provide instruction beyond the school day for students who need academic assistance: 2020–21
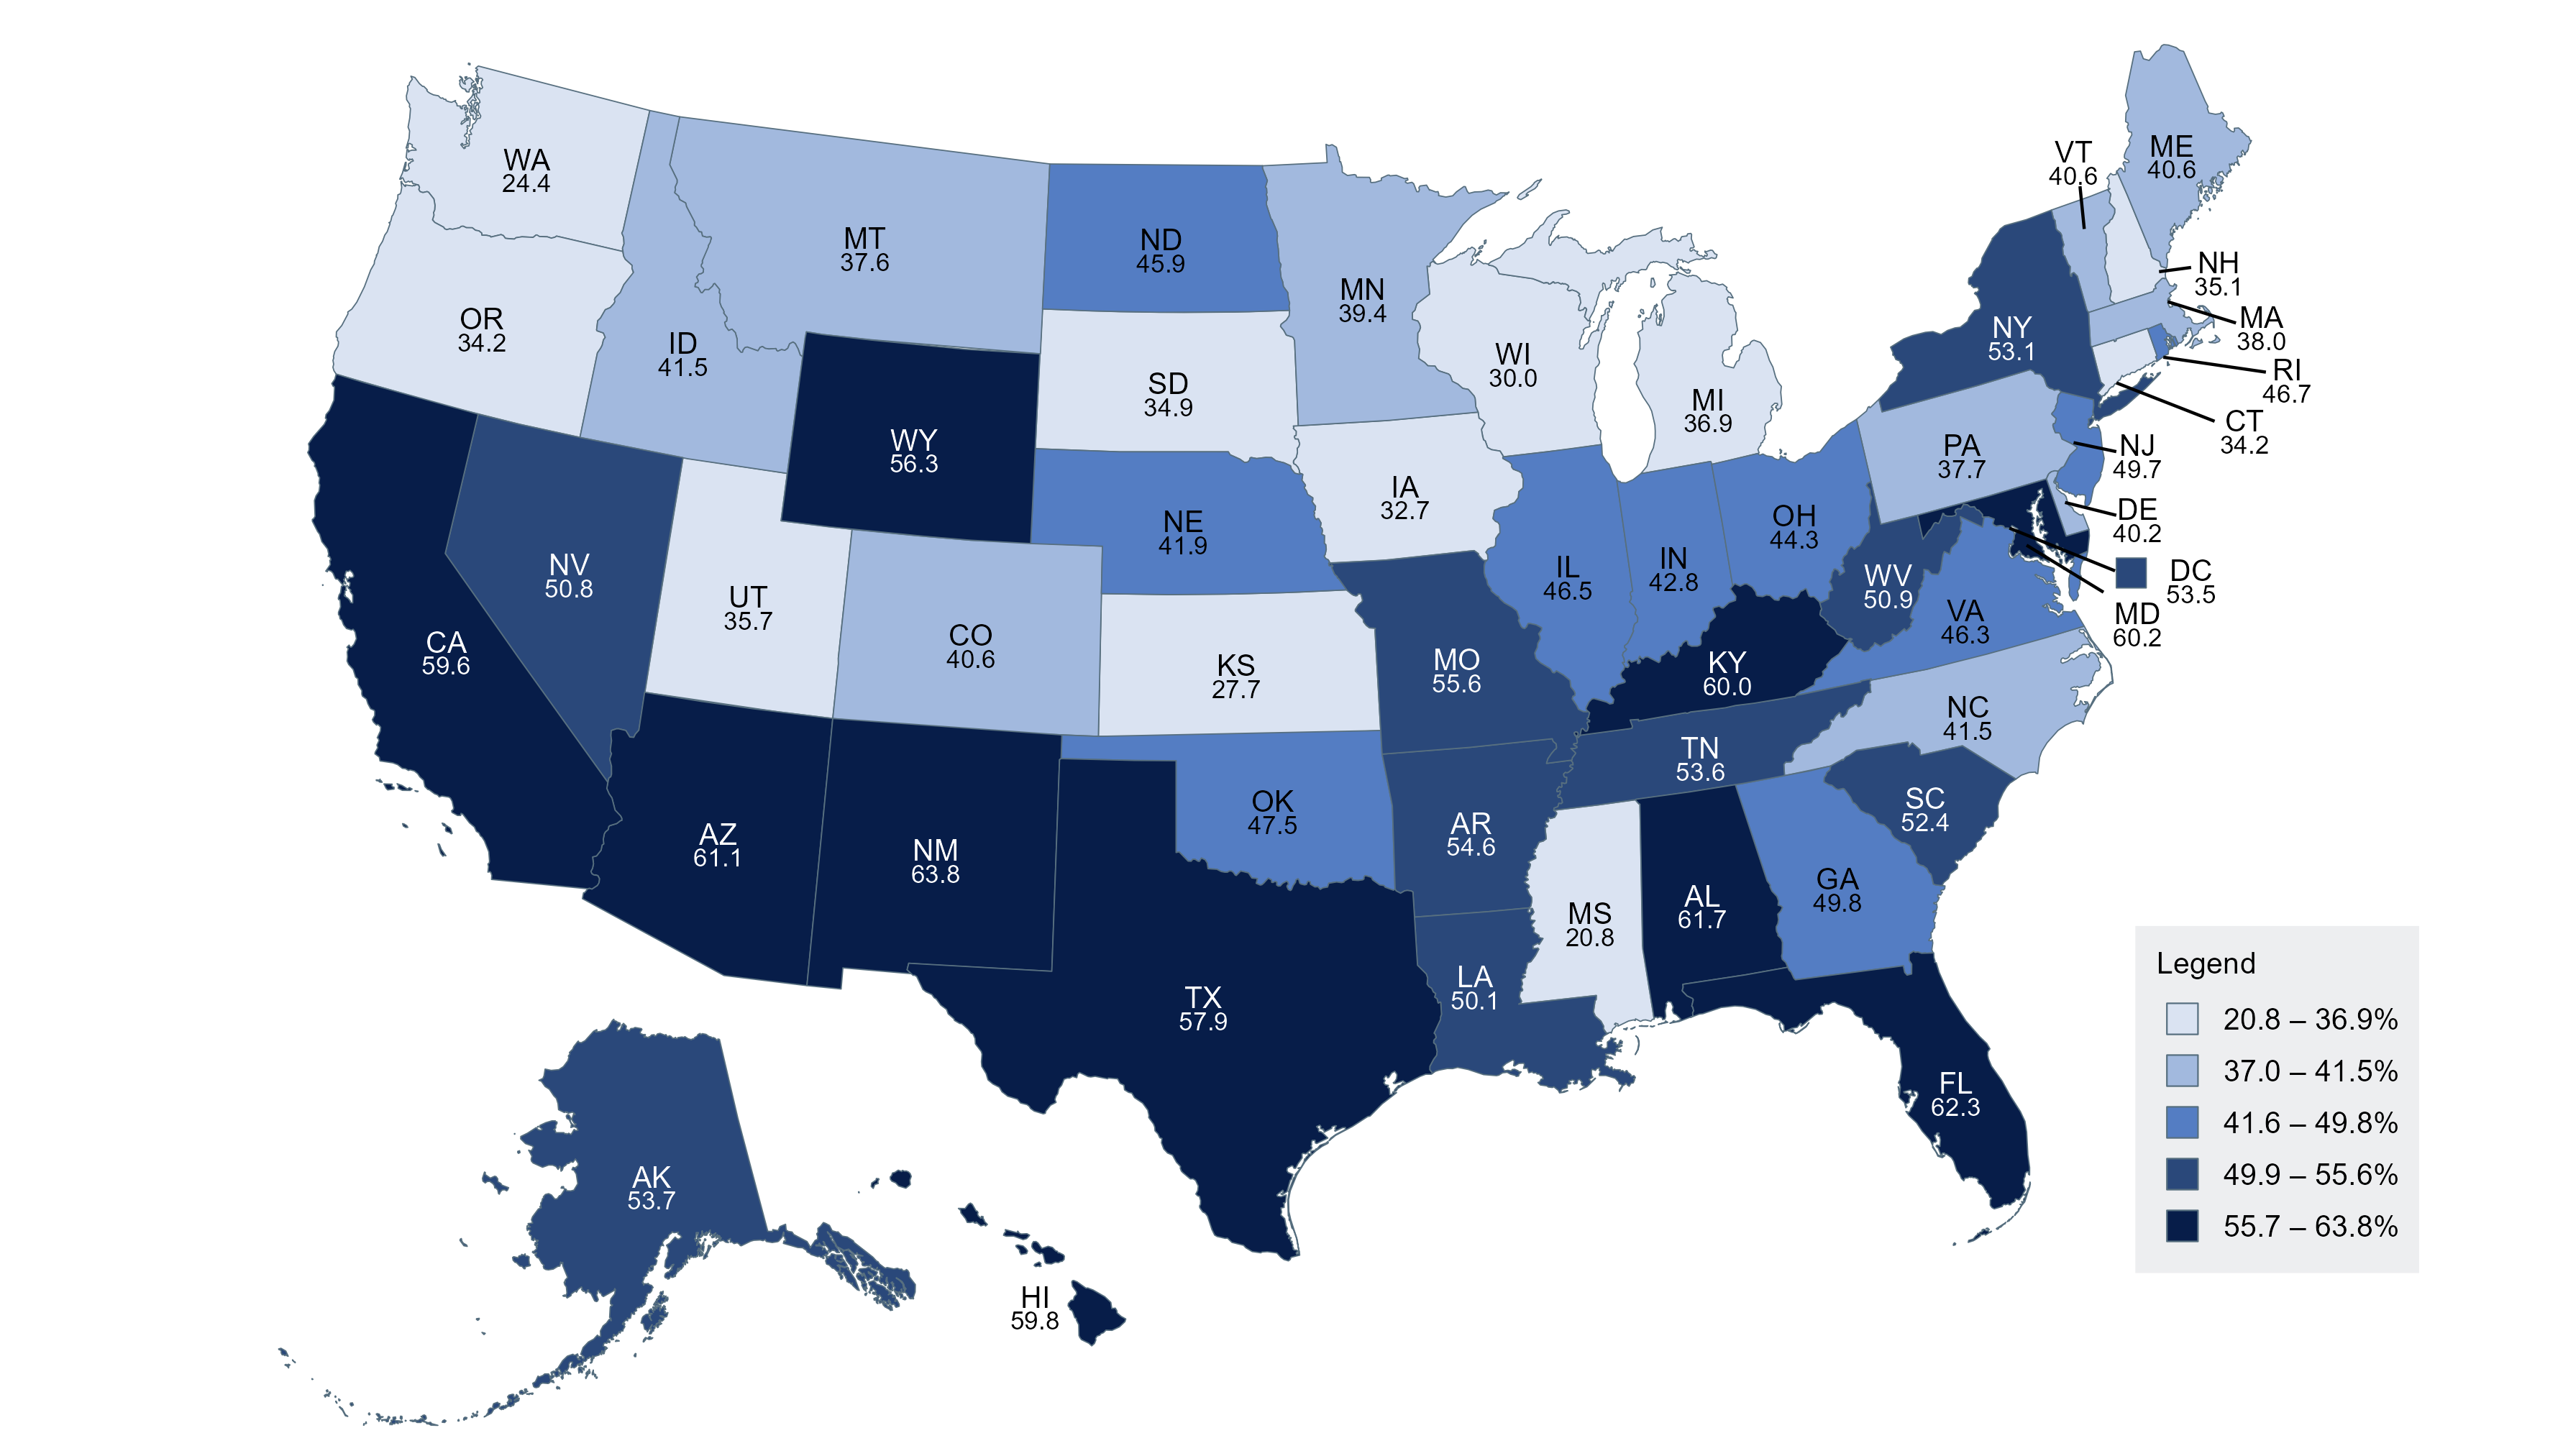
SOURCE: U.S. Department of Education, National Center for Education Statistics, National Teacher and Principal Survey (NTPS), “Public School Data File,” 2020–21.
The primary responsibility of state or district education decisionmakers is to use trustworthy data to support the needs of their local schools and families Thankfully, state, district, and school leadership don’t need to assume the full financial and logistical responsibility on their own when there are federal data available that can help with state and local data needs. The same federal education data underpinning congressional funding decisions, policy choices, and guidance can be used for numerous state, district, and school policy and practice decisions as well—if education leaders know where to look.
Federal, state, and district education agencies and schools all serve different roles in the education sector but have similar and mutually beneficial responsibilities and goals on behalf of students and school staff (figure 2).
Figure 2. Mutually beneficial relationships 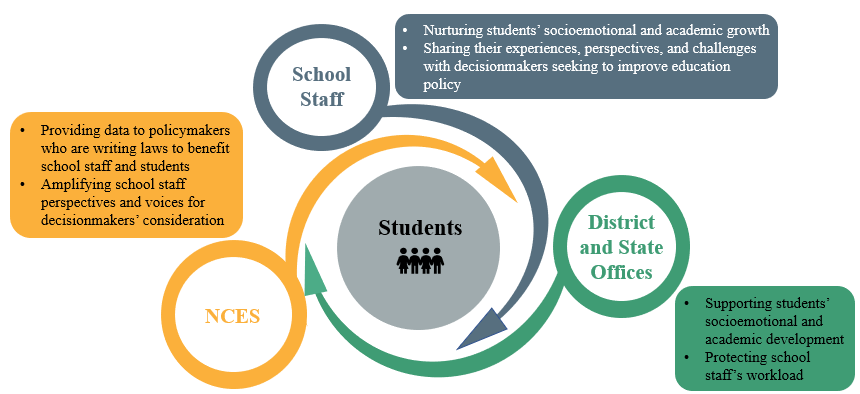
NCES and its predecessors have been congressionally mandated since 1867 to collect, analyze, and report data on the condition and progress of U.S. education for policymakers to use as a tool when making decisions to support our students and our school staff. National and state-level estimates from NCES surveys support state and district data efforts and strategic goals. For example, the California State Senate used state-level NTPS school start time data1 to inform SB:328 (a bill to require California school districts to shift middle and high school start times to no earlier than 8:30 a.m.), which was passed in 2017 and amended in 2021.
2. How do federal data benefit everyone in the education sector?
NCES produces unique data and information products that rely on statistics produced from data collected through state or district records and a suite of surveys, the majority of which come directly from responses given by educators, students, and families. For example, NCES produces an annual report to Congress called the Condition of Education. The Condition of Education summarizes and makes sense of data from more than 25 data collections administered by NCES and other government agencies. Federal policymakers also rely on other NCES reports, such as the annual Digest of Education Statistics, Projections of Education Statistics, and Report on Indicators of School Crime and Safety. For an example of the indicators available in the Condition of Education, see the figure below, which is from Characteristics of Traditional Public, Public Charter, and Private School Teachers.
Figure 3. Percentage distribution of teachers in traditional public, public charter, and private elementary and secondary schools, by highest degree earned: School year 2020–21
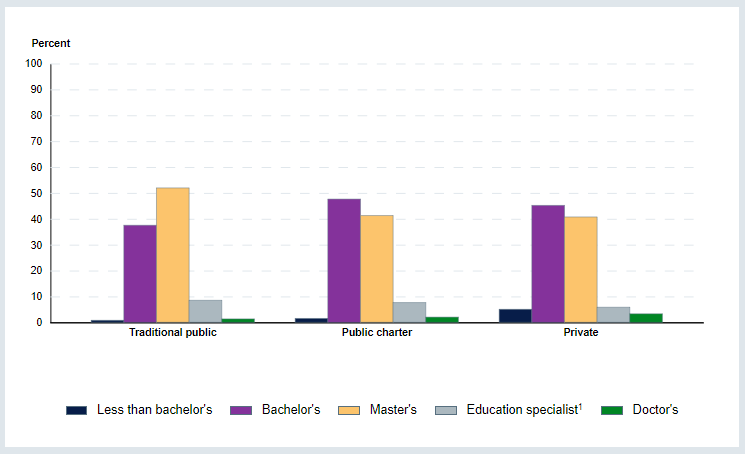
1 Education specialist degrees or certificates are generally awarded for 1 year’s work beyond the master’s level. Includes certificate of advanced graduate studies.
NOTE: Excludes teachers who teach only prekindergarten. Data are based on a head count of full-time and part-time teachers rather than on the number of full-time-equivalent teachers. Detail may not sum to totals because of rounding. Although rounded numbers are displayed, the figures are based on unrounded data.
SOURCE: U.S. Department of Education, National Center for Education Statistics, National Teacher and Principal Survey (NTPS), “Public School Teacher Data File” and “Private School Teacher Data File,” 2020–21. See Digest of Education Statistics 2022, tables 209.10 and 209.21.
The Condition of Education and other NCES reports and data products provide information on key topics in education to the U.S. Senate and House of Representatives, the White House Domestic Policy Council, and senior staff within many federal agencies including the Department of Education, Department of Health and Human Services (HHS), National Institutes of Health (NIH), Department of Justice (DOJ), and Department of Agriculture (USDA). Some of the recent policy initiatives and research initiatives supported by NTPS data include the following:
In part 2 of this blog series, we will present the challenges and opportunities created by using federal education data to inform policymaking at the federal, state, and district levels.
NCES would like to thank every district, school, administrator, teacher, parent, and student who has previously approved or participated in an NCES survey. We wouldn’t be able to produce our reports and data products without your participation.
We are currently conducting the 2023–24 NTPS to learn more about school and educator experiences following the pandemic. Find more information about the NTPS, including findings and details from prior collections.
By Maura Spiegelman and Julia Merlin, NCES
[1] The California State Senate Bill 328 referenced data from the Schools and Staffing Survey (SASS), which was the direct predecessor to the NTPS.