NCES Blog

National Center for Education Statistics

Research Roundup: NCES Celebrates Native American Heritage Month

Looking at data by race and ethnicity can provide a better understanding of education performance and outcomes than examining statistics that describe all students. In observation of Native American Heritage Month, this blog presents NCES findings on the learning experiences of American Indian/Alaska Native (AI/AN) students throughout their education careers.

Early Childhood Education

  • In 2019, 45 percent of AI/AN 3- to 4-year-olds and 83 percent of AI/AN 5-year-olds were enrolled in school.
     

K12 Education

  • The 2019 National Indian Education Study (NIES) surveyed students, teachers, and school principals about the experiences of AI/AN students in 4th and 8th grades.
     
    • How much do AI/AN students know about their culture?
      • Most 4th-grade AI/AN students reported having at least “a little” knowledge of their AI/AN tribe or group, with 17 percent reporting knowing “nothing.” About 19 to 23 percent reported having “a lot” of cultural knowledge across school types. (For more information, see NIES 2019, p. 11.)
         
    • Where do AI/AN students learn about their culture?
      • Family members were identified as the people who taught students the most about AI/AN history, with 45 percent of 4th-grade students and 60 percent of 8th-grade students so reporting. Teachers were the second most commonly identified group of people important for educating students on AI/AN cultural topics. (For more information, see NIES 2019, p. 12.)
         
    • How do teachers contribute to AI/AN student cultural knowledge?
      • A majority of AI/AN students had teachers who integrated AI/AN culture or history into reading lessons: overall, 89 percent of 4th-grade students and 76 percent of 8th-grade students had teachers who reported using these concepts in reading lessons “at least once a year.” (For more information, see NIES 2019, p. 16.)
         
    • What are AI/AN student trends on assessments in mathematics and reading?
      • Nationally, mathematics scores for AI/AN students from 2015 to 2019 remained unchanged for 4th-graders and declined for 8th-graders. Most states saw no change. (For more information, see NIES 2019, p. 46.)
         
  • In 2019, 52 percent of AI/AN 4th-grade students had access to a computer at home. (For more information, see NIES 2019, p. 45.)
     
  • There were 505,000 AI/AN students enrolled in public schools in 1995, compared with 490,000 AI/AN students in fall 2018 (the last year of data available).
     
  • In fall 2018, less than half of AI/AN students (40 percent) attended schools where minority students comprised at least 75 percent of the student population.
     
  • There are approximately 45,000 American Indian/Alaska Native students served by approximately 180 Bureau of Indian Education (BIE) schools located on 64 reservations in 23 states.
     
  • In school year 2018–19, the adjusted cohort graduation rate (ACGR) was 74 percent for AI/AN public school students. The ACGRs for AI/AN students ranged from 51 percent in Minnesota to 94 percent in Alabama and were higher than the U.S. average in eight states (Texas, Virginia, Louisiana, Tennessee, Connecticut, New Jersey, Alabama, and Kentucky).
     
  • In 2020, 95 percent of 25- to 29-year-olds who were AI/AN had completed at least high school.


Postsecondary Education

  • In academic year 2018–19, 14 percent of bachelor’s degrees conferred to AI/AN graduates were in a STEM field.
     
  • About 41 percent of AI/AN students who began seeking a bachelor’s degree full-time at a 4-year institution in fall 2013 completed that degree at the same institution within 6 years.


By Mandy Dean, AIR

Education at a Glance 2021: Putting U.S. Data in a Global Context

International comparisons provide reference points for researchers and policy analysts to understand trends and patterns in national education data and are important as U.S. students compete in an increasingly global economy.

Education at a Glance, an annual publication produced by the Organization for Economic Cooperation and Development (OECD), provides data on the structure, finances, and performance of education systems in 38 OECD countries, including the United States, as well as a number of OECD partner countries. The report also includes state-level information on key benchmarks to inform state and local policies on global competitiveness.

The recently released 2021 edition of the report shows that the United States is above the international average on some measures, such as participation in and funding of postsecondary education, but lags behind in others, such as participation in early childhood education programs. The report also presents some initial comparisons on countries’ responses to the COVID-19 pandemic.

Postsecondary Educational Attainment

The percentage of U.S. 25- to 34-year-olds with a postsecondary degree increased by 10 percentage points between 2010 and 2020, reaching 52 percent, compared with the OECD average of 45 percent (figure 1). Attainment rates varied widely across the United States in 2020, from 33 percent for those living in Nevada to 61 percent for those living in Massachusetts and 77 percent for those living in the District of Columbia.


Figure 1. Percentage of 25- to 34-year-olds with a postsecondary degree, by Organization for Economic Cooperation and Development (OECD) country: 2020

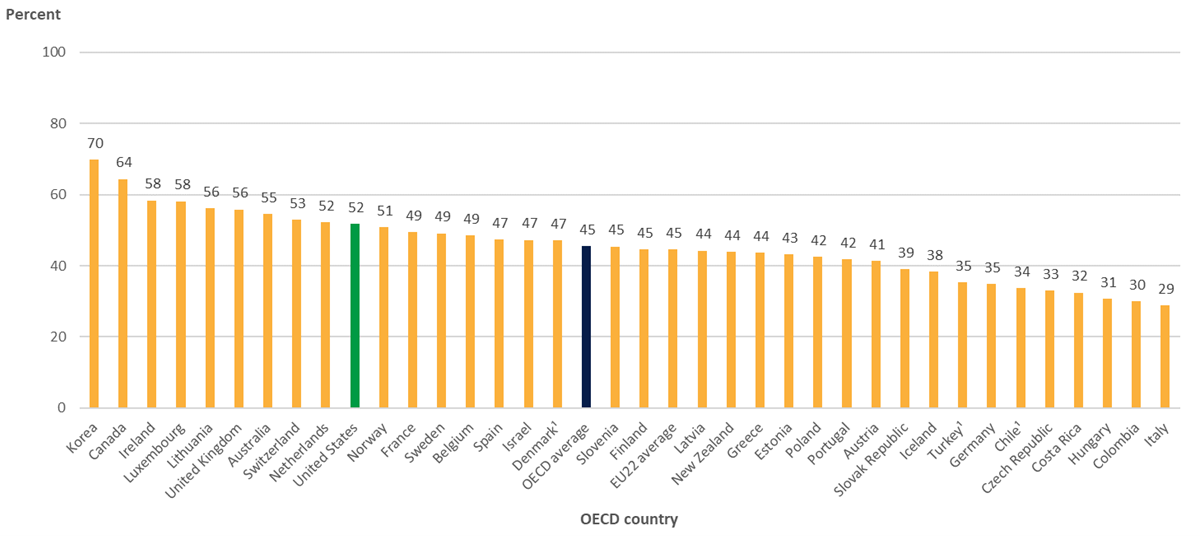
1 Year of reference differs from 2020. Refer to the source table for more details.
SOURCE: OECD (2021), Table A1.2. See Source section for more information and Annex 3 for notes.


In the United States in 2020, 25- to 34-year-old women were more likely than 25- to 34-year-old men to attain a postsecondary education: 57 percent of women had a postsecondary qualification, compared with 47 percent of men, a difference of 10 percentage points. Across OECD countries, the postsecondary education gap between 25- to 34-year-old men and women was wider (13 percentage points) than the gap in the United States (10 percentage points). In 2020, the postsecondary attainment rate of 25- to 34-year-old men in the United States was 8 percentage points higher than the OECD average, whereas the rate of 25- to 34-year-old women in the United States was 5 percentage points higher than the OECD average.

Postsecondary Education Spending

U.S. spending on postsecondary education is also relatively high compared with the OECD average, in both absolute and relative terms. The United States spent $34,036 per postsecondary student in 2018, the second-highest amount after Luxembourg and nearly double the OECD average ($17,065). Also, U.S. spending on postsecondary education as a percentage of GDP (2.5 percent) was substantially higher than the OECD average (1.4 percent). These total expenditures include amounts received from governments, students, and all other sources.

Early Childhood Education

The level of participation in early childhood education programs in the United States is below the OECD average and falling further behind. Between 2005 and 2019, average enrollment rates for 3- to 5-year-olds across OECD countries increased from 77 to 87 percent. In contrast, the rate in the United States remained stable at 66 percent during this time period. Among U.S. states, the 2019 enrollment rates for 3- to 5-year-olds ranged from less than 50 percent in Idaho and North Dakota to 70 percent or more in New York (70 percent), Vermont (76 percent), Connecticut (76 percent), New Jersey (77 percent), and the District of Columbia (88 percent).

COVID-19 Pandemic

Education at a Glance also presents a first look at countries’ responses to the COVID-19 pandemic. The spread of COVID-19 impeded access to in-person education in many countries around the world in 2020 and 2021. By mid-May 2021, 37 OECD and partner countries had experienced periods of full school closure since the start of 2020.

Despite the impact of the crisis on employment, the share of NEETs (those neither in employment nor education or training) among 18- to 24-year-olds did not greatly increase in most OECD and partner countries during the first year of the COVID-19 crisis. On average, the share of 18- to 24-year-old NEETs in OECD countries rose from 14.4 percent in 2019 to 16.1 percent in 2020. However, Canada, Columbia, and the United States experienced an increase of more than 4 percentage points. In the United States, the share of 18- to 24-year-old NEETs increased from 14.6 percent in 2019 to 19.3 percent in 2020.

In 2020, many postsecondary education institutions around the world closed down to control the spread of the COVID-19 pandemic, potentially affecting more than 3.9 million international and foreign students studying in OECD countries. Early estimates show the percentage of international students attending postsecondary institutions in the United States declined by 16 percent between 2020 and 2021.

Browse the full report to see how the United States compares with other countries on these and other important education-related topics and learn more about how other countries’ education systems responded to the COVID-19 pandemic.


By Rachel Dinkes, AIR

Online Training for the 2019 NHES Early Childhood Program Participation Survey Data and Parent and Family Involvement in Education Survey Data

The NCES National Household Education Survey (NHES) program administered two national surveys in 2019—the Early Childhood Program Participation (ECPP) survey and the Parent and Family Involvement in Education (PFI) survey. The ECPP survey collects information on young children’s care and education, including the use of home-based care with both relatives and nonrelatives and center-based care and education. The survey examines how well these care arrangements cover work hours, costs of care, location of care, the process of selecting care, and factors making it difficult to find care. The PFI survey collects information on a range of issues related to how families connect to schools, including information on family involvement with schools, school choice, homeschooling, virtual education, and homework practices.

NCES released data from the 2019 NHES administration on January 28, 2021. For each of the two surveys, this release includes the following:

  • Public-use data files, in ASCII, CSV, SAS, SPSS, Stata, and R
  • Restricted-use data files (in formats listed above and with codebook)
  • Public-Use Data File Codebook
  • Data File User’s Manual (for both public-use and restricted-use files)

That’s a lot of information! How should you use it? We suggest you start by viewing the NHES online data Distance Learning Dataset Training modules. The modules provide a high-level overview of the NHES program and the data it collects. They also include important considerations to ensure that your analysis takes into account the NHES’s complex sample design (such as applying weights and estimating standard errors).   

You should first view the five general NHES modules, which were developed for the 2012 NHES data. These modules are:

  • Introduction to the NHES
  • Getting Started with the NHES Data
  • Data Collected Through the NHES
  • NHES Sample Design, Weights, Variance, and Missing Data
  • Considerations for Analysis of NHES Data

A sixth module explains key changes in the 2019 ECPP and PFI surveys compared to their respective 2012 surveys:

  • Introduction to the 2019 NHES Data Collection

The sixth module also provides links to the 2019 ECPP and PFI data, restricted-use licensing information, and other helpful resources.

Now you are ready to go! If you have any questions, please contact us at NHES@ed.gov.

By Lisa Hudson, NCES

What Do Parents Look for When Choosing an Early Childhood Care Arrangement?

The short answer to this question is reliability. However, new 2019 data from the National Household Education Surveys (NHES) program indicate that parents typically consider many factors when choosing care arrangements for their young children.  

The Early Childhood Program Participation: 2019 survey found that 59 percent of children age 5 and under were in a care arrangement (including care from a relative other than a parent, care from a nonrelative, or attendance at a preschool or day care) in 2019. The parents of these children were asked how important various factors were when choosing their child’s care arrangement. The reliability of the arrangement was the factor most often rated as “very important”: 87 percent of children had parents who rated reliability as very important when choosing a care arrangement for their child (figure 1). This factor was followed by available times for care and qualifications of staff (75 and 72 percent, respectively). A majority of children’s parents also rated the following factors as very important:

  • Learning activities (68 percent)
  • Location (60 percent)
  • Time spent with other children (59 percent)
  • Cost (55 percent)

Figure 1. Among children age 5 and under who were not yet in kindergarten and were in at least one weekly care arrangement, percentage whose parents indicated that the factor was “very important” when choosing child’s care arrangement: 2019

SOURCE: Cui, J., and Natzke, L. (2020). Early Childhood Program Participation: 2019 (NCES 2020-075). U.S. Department of Education. Washington, DC: National Center for Education Statistics.


For many factors, the percentage of children whose parents rated the factor as very important when choosing a care arrangement was similar across the children’s age ranges. However, for 5 of the 11 factors, ratings varied depending on the child’s age. For example, the percentage of children whose parents rated time spent with other children as very important increased with the age of the child (figure 2). Similarly, learning activities were rated as very important more often for children ages 3–5 (74 percent) than for younger children (59 percent for children under age 1; 64 percent for children ages 1–2).


Figure 2.  Among children age 5 and under who were not yet in kindergarten and were in at least one weekly care arrangement, percentage whose parents indicated that the factor was “very important” when choosing child’s care arrangement, by age of child: 2019

SOURCE: Cui, J., and Natzke, L. (2020). Early Childhood Program Participation: 2019 (NCES 2020-075). U.S. Department of Education. Washington, DC: National Center for Education Statistics.


The opposite pattern was true for the number of children in group and website ratings. Both of these factors were rated as very important more often by parents of children under age 1 (51 and 35 percent, respectively) than by parents of children ages 3–5 (40 and 25 percent, respectively).

More detailed information about child care arrangements is available in Early Childhood Program Participation: 2019. For a look at why parents of K–12 students choose schools for their children, check out this blog post and the recent NCES release Parent and Family Involvement in Education: 2019.


By Lisa Hudson, NCES

NHES Data Files Provide Researchers Supplemental Information on Survey Respondents’ Communities

Increasingly, researchers are merging survey data with data from external sources, such as administrative data or different surveys, to enhance analyses. Combining data across sources increases the usefulness of the data while minimizing the burden on survey respondents.

In September, the National Household Education Surveys Program (NHES) released restricted-use supplemental geocode data files that use sample respondents’ addresses to integrate the 2016 NHES Parent and Family Involvement in Education (PFI), Early Childhood Program Participation (ECPP), and Adult Training and Education (ATES) survey data with data from other collections. The supplemental geocode files include additional geographic identifiers, characteristics of respondents’ neighborhoods and local labor markets, radius-based measures of household proximity to job search assistance and educational opportunities, and, for surveys focused on children, school district identifiers based on home addresses and school district characteristics.

The new data can complement researchers’ analyses of data from all three surveys. Researchers can expand their analyses of school choice and access to K–12 schooling options using the PFI survey data. Those interested in analyses of decisions about children’s early education can use the ECPP survey data to look at the availability of Head Start programs, preschools in private schools near children’s homes, and the prevalence of prekindergarten programs in local school districts. Researchers interested in nondegree credential attainment and training for work can use data from the ATES to find information on local labor markets and the number of American Job Centers near respondents’ homes.

The NHES:2016 restricted-use supplemental geocode files are available to restricted-use license holders to be used in conjunction with the NHES:2016 survey data files. To access the full set of NHES:2016 geocode supplemental restricted-use data files, apply for a restricted-use license. You can also browse the list of variables in the supplemental geocode files.


By Emily Isenberg and Sarah Grady, NCES