NCES Blog

National Center for Education Statistics

Education at a Glance 2019: Putting U.S. Data in a Global Context

International comparisons provide reference points for researchers and policy analysts to understand trends and patterns in national education data and are important as U.S. students compete in an increasingly global economy.

Education at a Glance, an annual publication produced by the Organisation for Economic Co-operation and Development (OECD), provides data on the structure, finances, and progress of education systems in 36 OECD countries, including the United States, as well as a number of OECD partner countries. The report also includes state-level information on key benchmarks to inform state and local policies on global competitiveness. 

The recently released 2019 edition of the report shows that the United States is above the international average on some measures, such as participation in and funding of higher education, but lags behind in others, such as participation in early childhood education programs.


Distribution of 25- to 34-Year-Olds With a College Education, by Level of Education

The percentage of U.S. 25- to 34-year-olds with an associate’s or bachelor’s degree increased by 8 percentage points between 2008 and 2018, reaching 49 percent, compared with the OECD average of 44 percent. However, the attainment rates varied widely across the United States in 2017, from 32 percent for those living in Louisiana and West Virginia to 58 percent for those living in Massachusetts and 73 percent for those living in the District of Columbia.

The percentage of U.S. students completing a bachelor’s degree within 4 years was 38 percent in 2018, about the same as the average among OECD countries with available data (39 percent); however, after an additional 2 years, the U.S. graduation rate (69 percent) was slightly above the OECD average of 67 percent (achieved after 3 years). While a higher percentage of U.S. young adults had completed a bachelor’s degree compared with young adults in other OECD countries, a lower percentage had completed a master’s or doctoral degree. Eleven percent of 25- to 34-year-olds in the United States had completed a master’s or doctoral degree, compared with an average of 15 percent across OECD countries.


Higher Education Spending

U.S. spending on higher education is also relatively high compared with the OECD average, in both absolute and relative terms. The United States spent $30,165 per higher education student in 2017, the second-highest amount after Luxembourg and nearly double the OECD average ($15,556). Also, U.S. spending on higher education as a percentage of GDP (2.5 percent) was substantially higher than the OECD average (1.5 percent). These total expenditures include amounts received from governments, students, and all other sources. 


Early Childhood Education

Contrasting with enrollment patterns at the higher education level, the level of participation in early childhood education programs in the United States is below the OECD average and falling further behind. Between 2005 and 2017, average enrollment rates for 3- to 5-year-olds across OECD countries increased from 76 to 86 percent. In contrast, the rate in the United States remained stable at 66 percent during this time period. Among U.S. states, the 2017 enrollment rates for 3- to 5-year-olds ranged from less than 50 percent in Idaho, North Dakota, and Wyoming to more than 70 percent in Connecticut, the District of Columbia, and New Jersey.

Going deeper into the data, on average, 88 percent of 4-year-olds in OECD countries were enrolled in education programs in 2017, compared with 66 percent in the United States. The enrollment rate for 3-year-olds in the United States was 42 percent, compared with the OECD average of 77 percent.


Gender Gaps in Employment

Education at a Glance also looks at employment and other outcomes from education. The report found that the 2017 gender gap in employment rates was lower for those who had completed higher levels of education. This pattern holds in the United States, where the gender gap in the employment rate was particularly high among 25- to 34-year-olds who had not completed high school. For this age group, the employment rate was 73 percent for men and 41 percent for women, a difference of 32 percentage points, compared with the average difference of 28 percentage points across OECD countries. The gender gap in the employment rate was 14 percentage points among U.S. adults with only a high school education and 7 percentage points among those who had completed college.

In 2017, the gender differences in average earnings were also wider in the United States than in the OECD averages. These gender gaps in earnings between male and female full-time workers existed across all levels of education. In the United States, college-educated 25- to 64-year-old women earned 71 percent of what their male peers earned. This gender gap was wider than for all other OECD countries except for Chile, the Czech Republic, Hungary, Israel, Italy, Mexico, Poland, and the Slovak Republic.

This is just a sample of the information that can be found in Education at a Glance 2019. You can also find information on the working conditions of teachers, including time spent in the classroom and salary data; student/teacher ratios; college tuitions and loans; and education finance and per student expenditures. Education at a Glance also contains data on the international United Nations Sustainable Development Goals related to education.

Browse the full report to see how the United States compares with other countries on these important education-related topics.


Percentage of 25- to 34-year-olds with a college education, by level of education: 2018

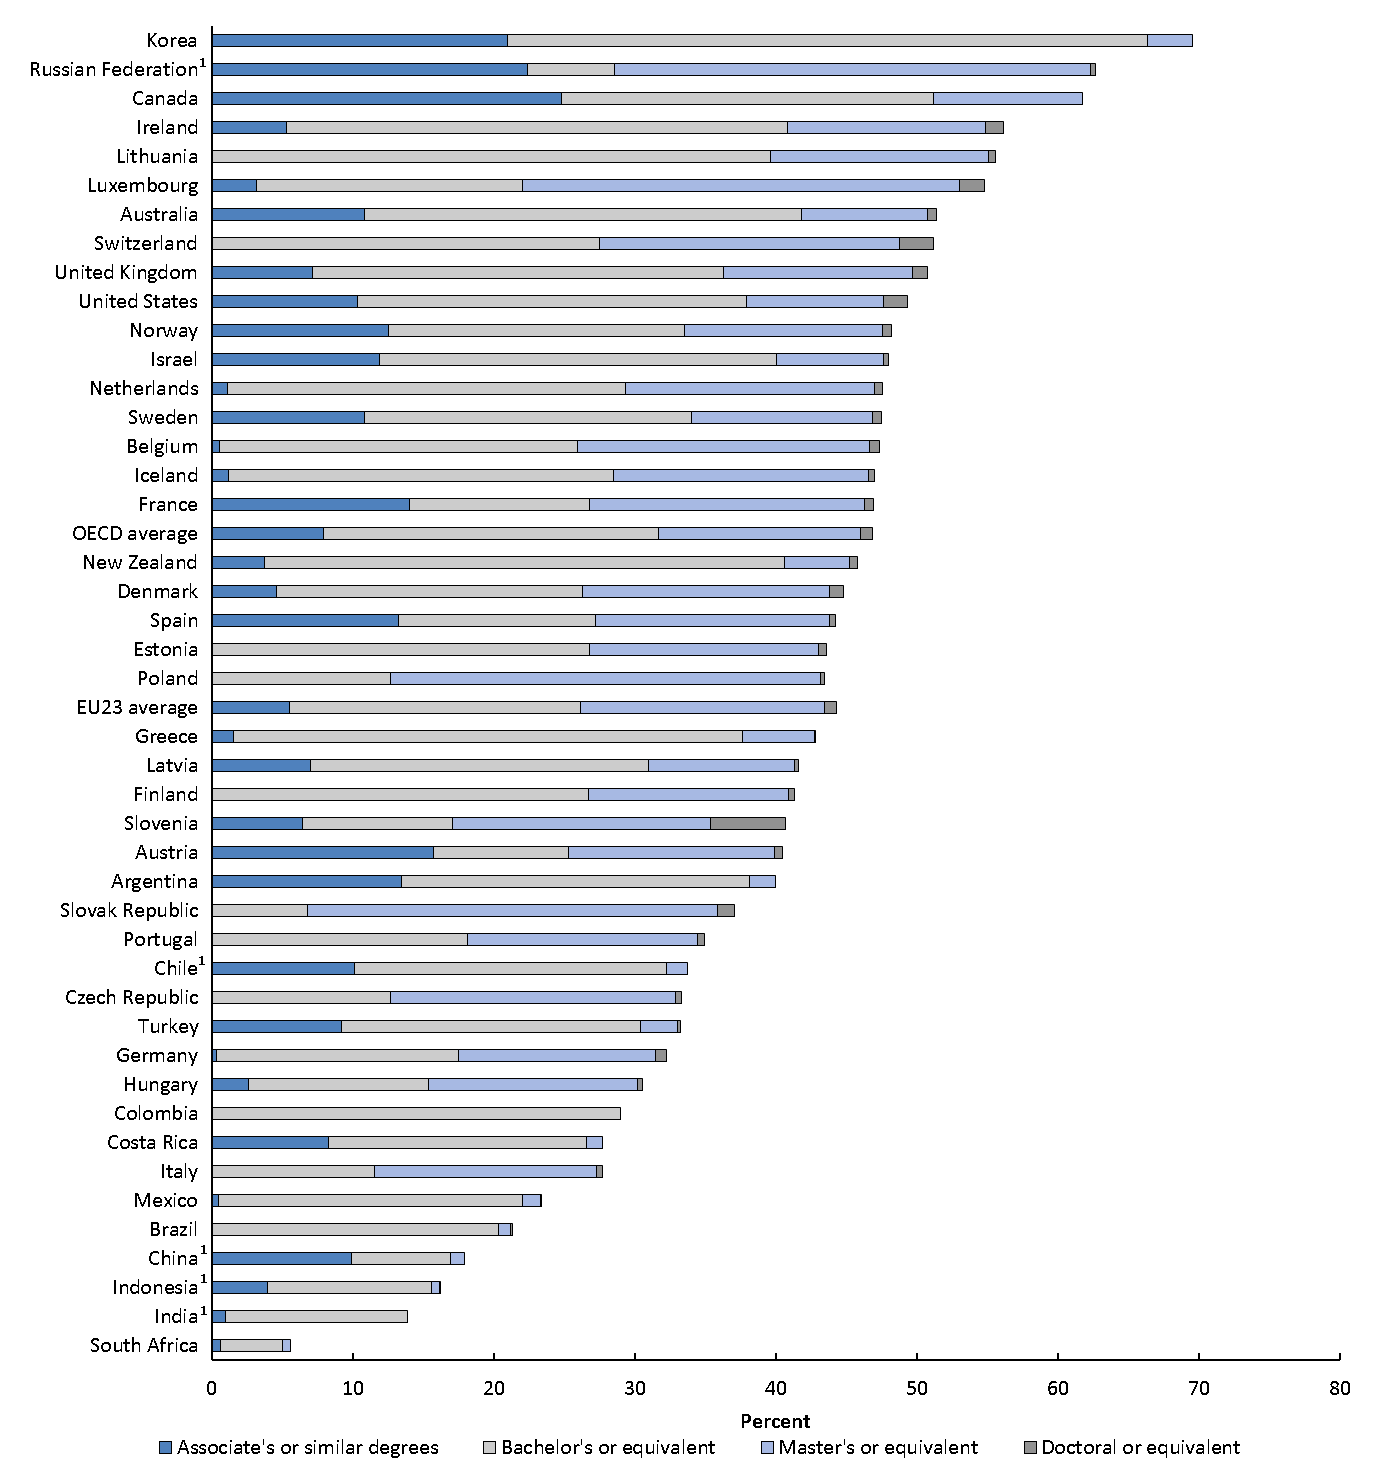
1 Year of reference differs from 2018 (see NOTE).                                                                                                                                       

NOTE: Reporting of some countries is not consistent with international categories. Please refer to Education at a Glance Database, http://stats.oecd.org. for details. Comparisons follow International Standard Classification of Education (ISCED) 2011 education levels: “Associate’s or similar degrees” refers to ISCED 2011 level 5, “Bachelor’s or equivalent” refers to level 6, “Master’s or equivalent” refers to level 7, and “Doctoral or equivalent” refers to level 8. Countries are ranked in descending order of the total percentage of tertiary-educated 25- to 34-year-olds. See Annex 3 for additional notes (https://doi.org/10.1787/f8d7880d-en).

SOURCE: Organisation for Economic Co-operation and Development (2019), Education at a Glance Database, http://stats.oecd.org


By Thomas Snyder 

Announcing the Condition of Education 2018 Release

We are pleased to present The Condition of Education 2018, a congressionally mandated annual report summarizing the latest data on education in the United States. This report is designed to help policymakers and the public monitor educational progress. This year’s report includes 47 indicators on topics ranging from prekindergarten through postsecondary education, as well as labor force outcomes and international comparisons. 

In addition to the regularly updated annual indicators, this year’s spotlight indicators highlight new findings from recent NCES surveys. The first spotlight indicator examines the choices and costs that families face as they select early childhood care arrangements. Drawing on data from the NCES National Household Education Survey, the indicator finds that early childhood care expenses were higher in 2016 than in 2001. For example, families’ average hourly out-of-pocket expenses for center-based care were 72 percent higher in 2016 ($7.60) than in 2001 ($4.42), in constant 2016–17 dollars. The indicator also finds that in 2016, some 57 percent of children under the age of 6 had parents who reported there were good choices for child care where they lived. Among children whose parents reported difficulty finding child care in 2016, some 32 percent cited cost as the primary reason. The complete indicator, Early Childhood Care Arrangements: Choices and Costs, contains more information about how these findings varied by family income, race/ethnicity, locale (urban, suburban, town, or rural), and children’s age.


Average hourly out-of-pocket child care expense for children under 6 years old and not yet in kindergarten whose families paid for child care, by primary type of child care arrangement: 2001 and 2016

1 Center-based arrangements include day care centers, Head Start programs, preschools, prekindergartens, and childhood programs.
NOTE: Estimates include only those children whose families paid at least part of the cost out of pocket for their child to receive nonparental care at least weekly.
SOURCE: U.S. Department of Education, National Center for Education Statistics, Early Childhood Program Participation Survey of the National Household Education Surveys Program (ECPP-NHES: 2001 and 2016). See Digest of Education Statistics 2017, table 202.30c.


The second spotlight describes the characteristics of teachers who entered the teaching profession through an alternative route to certification program. Compared to those who entered through a traditional route, higher percentages of alternative route teachers in 2015–16 were Black (13 vs. 5 percent), Hispanic (15 vs. 8 percent), of Two or more races (2 vs. 1 percent), and male (32 vs. 22 percent), and lower percentages were White (66 vs. 83 percent). Overall, 18 percent of public school teachers in 2015–16 had entered teaching through an alternative route to certification program. The percentages were higher among those who taught career or technical education (37 percent), natural sciences (28 percent), foreign languages (26 percent), English as a second language (24 percent), math and computer science (22 percent), and special education (20 percent). The analysis also examines how the prevalence of alternative route teachers varies between charter schools and traditional public schools, between high and low poverty schools, and between schools that enroll high or low percentages of racial/ethnic minority students. For more findings from this analysis of data from the National Teacher and Principal Survey, see the complete indicator, Characteristics of Public School Teachers Who Completed Alternative Route to Certification Programs.


Percentage distribution of public elementary and secondary school teachers, by route to certification and race/ethnicity: 2015–16

NOTE: Teachers were asked whether they entered teaching through an alternative route to certification program, which is a program that was designed to expedite the transition of nonteachers to a teaching career (for example, a state, district, or university alternative route to certification program). Detail may not sum to totals because of rounding. Race categories exclude persons of Hispanic ethnicity. Data for American Indian/Alaska Native teachers who entered teaching through a traditional route and Pacific Islander teachers who entered teaching through traditional and alternative routes round to zero and are not displayed.
SOURCE: U.S. Department of Education, National Center for Education Statistics, National Teacher and Principal Survey (NTPS), “Public School Teacher Data File,” 2015–16. See Digest of Education Statistics 2017, table 209.24.


The third spotlight presents data on average student loan balances for students completing graduate degrees. Using data from the National Postsecondary Student Aid Study, this indicator examines how average student loan balances changed between 1999–2000 and 2015–16, and how those trends varied by degree type. Among graduate school completers who had student loans for undergraduate or graduate studies, average student loan balances increased for all degree types (in constant 2016–17 dollars). For example, average student loan balances for students who completed research doctorate degrees, such as a Ph.D., doubled during this time period, from $53,500 to $108,400 (an increase of 103 percent). Average student loan balances increased by 90 percent for those who completed professional doctorate degrees, such as medical doctorates and law degrees (from $98,200 to $186,600). The complete indicator, Trends in Student Loan Debt for Graduate School Completers, also describes how average student loan balances varied among specific degree programs, such as medical doctorates, law degrees, and master’s degrees in business administration.


Average cumulative student loan balance for graduate school completers, by degree type: Selected years, 1999–2000 through 2015–16

1 Includes chiropractic, dentistry, law, medicine, optometry, pharmacy, podiatry, and veterinary medicine. 
NOTE: Data refer to students who completed graduate degrees in the academic years indicated. Includes student loans for undergraduate and graduate studies. Average excludes students with no student loans.
SOURCE: U.S. Department of Education, National Center for Education Statistics, 1999–2000, 2003–04, 2007–08, 2011–12, and 2015–16 National Postsecondary Student Aid Study (NPSAS:2000, NPSAS:04, NPSAS:08, NPSAS:12, and NPSAS:16). See Digest of Education Statistics 2017, table 332.45.


The Condition includes an At a Glance section, which allows readers to quickly make comparisons within and across indicators, and a Highlights section, which captures key findings from each indicator. The report contains a Reader’s Guide, a Glossary, and a Guide to Sources that provide additional background information. Each indicator provides links to the source data tables used to produce the analyses.

As new data are released throughout the year, indicators will be updated and made available on The Condition of Education website. In addition, NCES produces a wide range of reports and datasets designed to help inform policymakers and the public. For more information on our latest activities and releases, please visit our website or follow us on Twitter, Facebook, and LinkedIn.

By James L. Woodworth, NCES Commissioner 

The experiences of our nation’s young children from kindergarten through fourth grade

By Jill Carlivati McCarroll and Gail M. Mulligan

In 2014–15, boys had higher fourth-grade math scores than girls, but no significant differences were found in boys’ versus girls’ fourth-grade reading knowledge and skills. These findings come from the most recent data release for the Early Childhood Longitudinal Study, Kindergarten Class of 2010–11 (ECLS-K:2011). A recently released report provides a first look at the status of students who were in kindergarten for the first time during the 2010-11 school year and were in fourth grade in 2014-15. The longitudinal nature of this study allows for a comparison of trends over time. For example, differences in math scores between boys and girls were also observed in third grade but not in earlier grades. No significant differences in reading results for boys and girls have been detected in any grade between kindergarten and fourth. More data on assessment scores, as well as the demographic and family characteristics of the cohort of students who were first-time kindergartners in 2010-11, are available in the reports.

The series of Early Childhood Longitudinal Studies are consistently some of the most popular NCES studies due in large part to the fact that they provide comprehensive and reliable data on important topics such as child development, school readiness, and early school experiences. The ECLS-K:2011 was designed to provide data that can be used to describe and to better understand children’s development and experiences in the elementary grades, and how children’s early experiences relate to their later development, learning, and experiences in school. The study is longitudinal, meaning that it followed the same group of children over time; in the case of the ECLS-K:2011, children were followed from their kindergarten year (the 2010-11 school year) until the spring of 2016, when most of the children were in the fifth grade.

All planned waves of data through fifth grade have been collected and staff at the National Center for Education Statistics (NCES) are hard at work releasing reports of the findings as well as the data from all rounds of the study. Researchers, educators, policy makers, and other interested members of the public now have access to much of the important data from the ECLS-K:2011, with additional reports and data releases on their way.

The diverse sample of children who participated in the ECLS-K:2011 is nationally representative of students who were in kindergarten in U.S. schools in the 2010-11 school year. Information on children’s cognitive, social, emotional, and physical development was collected every year using direct child assessments and surveys for the adults central to the children’s education. Adults surveyed for the study included the children’s parents/guardians, their teachers, their school administrators, and their kindergarten before- and after-school care providers. Topics covered by the surveys included the children’s home environment, home educational activities, school environment, classroom environment, classroom curriculum, teacher qualifications, and before- and after-school care. 

Public-use data from the kindergarten through fourth-grade rounds of the ECLS-K:2011 are now available online. A restricted-use dataset with data from the kindergarten through fourth-grade rounds is also available to qualified researchers with an IES Restricted-use Data License. For information on licensing, please see https://nces.ed.gov/pubsearch/licenses.asp. The schedule of future data releases is available on the ECLS website.

For more information on the ECLS-K:2011 as well as the other ECLS studies, please see our homepage or email the ECLS study team at ECLS@ed.gov.  

Risk Factors and Academic Outcomes in Kindergarten through Third Grade

By Amy Rathbun, AIR and Joel McFarland

Previous NCES research has shown that students with family risk factors tend to have lower average scores than their peers on academic assessments.[1] Risk factors can include coming from a low-income family or single-parent household, not having a parent who completed high school, and living in a household where the primary language is not English. How common is it for children entering U.S. kindergartens to have certain types of family risk factors? And, how do children with risk factors at kindergarten entry perform on academic assessments compared to their peers?  A new spotlight from The Condition of Education 2017 helps to answer these questions.

The spotlight focuses on children experiencing two types of risk factors - living in poverty (i.e., in households with income below the federal poverty threshold) and not having a parent who completed high school, as well as the combination and lack of the two risk factors. Data come from the Early Childhood Longitudinal Study, Kindergarten Class of 2010–11 (ECLS-K:2011). During the 2010–11 school year, 6 percent of first-time kindergartners had both risk factors , 18 percent had the single risk factor of living in poverty, and 2 percent had the single risk factor of not having a parent who completed high school. About 75 percent had neither of these two risk factors present during their kindergarten year.


Percentage distribution of fall 2010 first-time kindergartners, by risk factors related to parent education and poverty: School year 2010–11

NOTE: Detail may not sum to totals because of rounding.
SOURCE: U.S. Department of Education, National Center for Education Statistics, Early Childhood Longitudinal Study, Kindergarten Class of 2010–11 (ECLS-K:2011), Kindergarten–Third Grade Restricted-Use Data File. See Digest of Education Statistics 2016, table 220.39.


Are there differences in the prevalence of risk factors by student and family characteristics?

There were differences in the prevalence of family risk factors in relation to children’s race/ethnicity, primary home language, and family composition. For instance, it was more common for Hispanic students (15 percent) than for Black and Asian students (8 percent each) to have both risk factors, and these percentages were all higher than the percentage for White students (1 percent). Also, 23 percent of first-time kindergartners whose primary home language was not English had both the risk factor of living in poverty and the risk factor of not having a parent who completed high school, compared with 2 percent of kindergartners whose primary home language was English.

Does children’s performance in reading, math, and science in kindergarten through third grade differ based on risk factors?

Kindergarten students living in poverty and those with no parent that completed high school tended to score lower in reading, mathematics, and science over each of their first four years of school compared to their peers who had neither risk factor at kindergarten entry. For example, in the spring of third-grade, reading scores (on a scale of 0 to 141) were higher, on average, for students who had neither risk factor (114 points) than for those with the single risk factor of living in poverty (106 points), those with the single risk factor of not having a parent who completed high school (105 points), and those with both risk factors (102 points).[2]


Average reading scale scores of fall 2010 first-time kindergartners, by time of assessment and risk factors related to parent education and poverty: Fall 2010 through spring 2014

NOTE: Estimates weighted by W7C17P_7T170. Scores on the reading assessments reflect performance on questions measuring basic skills (print familiarity, letter recognition, beginning and ending sounds, rhyming words, and word recognition); vocabulary knowledge; and reading comprehension, including identifying information specifically stated in text (e.g., definitions, facts, and supporting details), making complex inferences from texts, and considering the text objectively and judging its appropriateness and quality. Possible scores for the reading assessment range from 0 to 141.
SOURCE: U.S. Department of Education, National Center for Education Statistics, Early Childhood Longitudinal Study, Kindergarten Class of 2010–11 (ECLS-K:2011), Kindergarten–Third Grade Restricted-Use Data File. See Digest of Education Statistics 2016, table 220.40.


For more information on family risk factors and children’s achievement in reading, mathematics, and science from the fall of kindergarten through the spring of third grade, see the spotlight on this topic in The Condition of Education 2017.

[1] Given that the spring third-grade reading scores have a mean of 110.2 points and a standard deviation (SD) of 12.3 points, this would mean the average score for children who had no risk factors was about 1.0 SD higher than the score for children with no risk factors.

[2] Rathbun, A., and West, J. (2004). From Kindergarten Through Third Grade: Children's Beginning School Experiences (NCES 2004–007). U.S. Department of Education. Washington, DC: National Center for Education Statistics. Retrieved March 2, 2017, from https://nces.ed.gov/pubsearch/pubsinfo.asp?pubid=2004007.


Changes in Children’s Nonparental Care Arrangements From 2001 to 2012

By Lauren Musu-Gillette

While the percentage of children in nonparental care arrangements remained unchanged between 2001 and 2012, the cost of those arrangements increased significantly. These findings come from a recently released report from NCES, The Years Before School: Children’s Nonparental Care Arrangements From 2001 to 2012. Childcare arrangements are influential in children’s early education, and can often be where children learn early literacy and numeracy skills that are important for kindergarten entry.[1]

While the percentage of children who participated in a nonparental care arrangement remained statistically unchanged from 2001 to 2012, there were shifts in the patterns of relative,[2] nonrelative,[3] and center-based care arrangements.[4] For instance, from 2001 to 2012, the percentage of children who had a relative care arrangement increased (from 22 percent to 26 percent) as did the percentage of children who had multiple arrangements (from 10 percent to 12 percent). In both 2001 and 2012, the greatest percentage of children participated in center-based care.


Percentage of children from birth to age 5 who are not yet in kindergarten, by type of nonparental care arrangement: 2001, 2005, and 2012

SOURCE: U.S. Department of Education, National Center for Education Statistics, National Household Education Surveys Program (NHES), Early Childhood Program Participation (ECPP) Survey, 2001, 2005, and 2012.


There were higher out-of-pocket hourly expenses for care in 2012 than in 2001 for children in all types of care arrangements. The expense for center-based care increased by 58 percent and that of relative care by 57 percent, while the expense for nonrelative care increased by 25 percent.


Percentage of children from birth to age 5 who are not yet in kindergarten, by type of weekly nonparental care arrangement and child’s age: 2001, 2005, and 2012

SOURCE: U.S. Department of Education, National Center for Education Statistics, National Household Education Surveys Program (NHES), Early Childhood Program Participation (ECPP) Survey, 2001, 2005, and 2012.


In 2012, out-of-pocket hourly expenses for children in center-based programs were the most expensive for families, averaging $6.70 per hour—60 percent higher than relative care ($4.18 per hour) and 27 percent higher than nonrelative care ($5.28 per hour).

Data used for this report come from the National Household Education Surveys Program (NHES) Early Childhood Program Participation Surveys (ECPP) collected every several years. This study is different from most NCES data collections in that it focuses on children before they enter formal schooling. In addition to collecting information on children’s early care and education arrangements, parents are also asked about early learning, such as how high the child can count and whether the child can recognize the letters of the alphabet. Learn more about the variables included in the study by visiting the website or accessing the First Look report.


[1] Flanagan, K.D., and McPhee, C. (2009). The Children Born in 2001 at Kindergarten Entry: First Findings From the Kindergarten Data Collections of the Early Childhood Longitudinal Study, Birth Cohort (ECLS-B) (NCES 2010-005). U.S. Department of Education. Washington, DC: Institute of Education Sciences, National Center for Education Statistics.

[2] Relative care: care provided by a relative (e.g., grandparent, aunt/uncle, brother/sister, or another relative) in either the child’s home or another home. Relative care does not include the child’s parents or guardians (e.g., a father or mother caring for the child).

[3] Nonrelative care: care provided by a nonrelative, either in the child’s home or another home. It includes care provided by home child care providers or neighbors, but not day care centers or preschools.

[4] Center-based care: care provided by day care centers, preschools, prekindergarten programs, Head Start programs, and other early childhood programs.