NCES is excited to announce the inclusion of new projected data as part of the Digest of Education Statistics: 2021. These new data include projections of education statistics through 2030 and account for impacts of the coronavirus pandemic.
Since 1964, NCES has produced the Projections of Education Statistics, which includes statistics ranging from elementary/secondary enrollment to teacher counts to postsecondary degrees earned. To produce these estimates, NCES uses models that apply historical trends in education to forecasted trends in demographics and the economy.
Each edition of the Projections provides revisions to estimates from the year before. These revisions can be the result of designed model improvements or incidental changes to the underlying data that feed the models. With the long-term impacts of the pandemic uncertain, NCES made minimal changes to the projection models in favor of consistency (for more information on how these forecasts have been produced historically, see the Technical Appendixes). However, due to the disruption of the coronavirus pandemic, changes to underlying data were more pronounced than usual.
For example, enrollment levels—particularly during compulsory elementary and secondary grades—are strongly determined by the size of the school-aged population. NCES’s projections rely on population projections, which are licensed from IHS Markit. IHS Markit’s population projections reflect a decline in birth rates during the coronavirus pandemic.1 These population projections will impact projected enrollment levels as smaller birth cohorts mature to school age.
Specifically, Digest table 203.10 reports projected data for enrollment in public elementary and secondary schools by grade over time. Between fall 2019 and fall 2020, total public school enrollment dropped by 3 percent (figure 1). By 2030, total public school enrollment is projected to decrease another 4 percent. However, public school enrollments are projected to be higher in 2021 than they were in 2020. Although public school enrollment is not projected to return to 2019 levels, it is projected to remain higher than 2020 levels through 2024. In other words, the projected decrease in public school enrollments over the next decade is not a direct continuation of the pandemic-related drop observed between fall 2019 and fall 2020. Rather, it is primarily a reflection of changes in the school-age population.
Figure 1. Annual percentage change in enrollment in public elementary and secondary schools: Fall 2010 to fall 2030
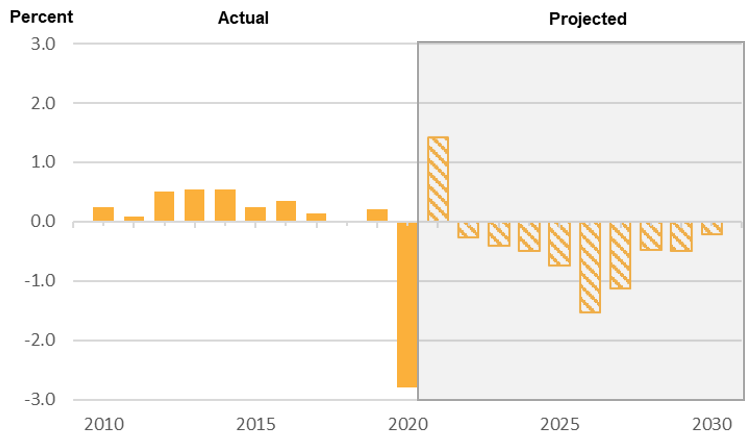
NOTE: Data are for the 50 states and the District of Columbia. Data include both traditional public schools and public charter schools. Data include imputations for nonreported prekindergarten enrollment in California for fall 2019 and 2020 and in Oregon for fall 2020. Data include imputations for nonreported enrollment for all grades in Illinois for fall 2020.
SOURCE: U.S. Department of Education, National Center for Education Statistics, Common Core of Data (CCD), "State Nonfiscal Survey of Public Elementary/Secondary Education," 2010–11 through 2020–21. See Digest of Education Statistics 2021, table 203.10.
The relationship between population and enrollment in elementary and secondary grades can be seen even more clearly by comparing projected enrollments for different grade levels. Children conceived during the pandemic will begin to age into first grade in large numbers beginning in 2027. In contrast, no children conceived during the pandemic will have aged into grade 9 by the end of the projection period in 2030. Figure 2 shows a pronounced dip in public school enrollment in grade 1 in 2027 and 2028, which is not present at grade 9. Specifically, public school enrollment in grade 1 is projected to be 8 percent lower in both 2027 and 2028 than in 2026. Meanwhile, the difference in these years for grade 9 is less than 1 percent (rounds to 0 percent). This is a direct reflection of projected declines in birth rates during the pandemic and the relationship between the school-age population and enrollment levels.
Figure 2. Enrollment in public schools, by selected grade: Fall 2010 through fall 2030
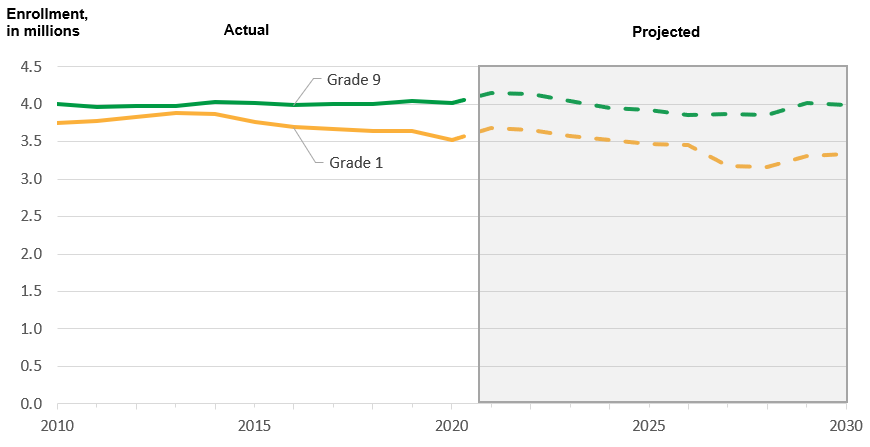
NOTE: Data are for the 50 states and the District of Columbia. Data include both traditional public schools and public charter schools. The total ungraded counts of students were prorated to prekindergarten through grade 8 and grades 9 through 12 based on the known grade-level distribution of a state. Data include imputations for nonreported prekindergarten enrollment in California for fall 2019 and 2020 and in Oregon for fall 2020. Data include imputations for nonreported enrollment for all grades in Illinois for fall 2020. Some data have been revised from previously published figures.
SOURCE: U.S. Department of Education, National Center for Education Statistics, Common Core of Data (CCD), "State Nonfiscal Survey of Public Elementary/Secondary Education," 2010–11 through 2020–21. See Digest of Education Statistics 2021, table 203.10.
All of NCES’s projections are heavily impacted by population forecasts. In addition, certain statistics—such as public school expenditures and postsecondary enrollments—are also shaped by economic forecasts. Like their population projections, IHS Markit’s economic forecasts have also factored in effects of the pandemic. This is another way in which forthcoming projections of education statistics account for pandemic-related impacts.
Digest tables featuring additional projections will be released on a rolling basis throughout the year. Be sure to bookmark this page for the most up-to-date tables.
Explore the first batch of tables from Digest 2021 with projected data:
- Enrollment in public elementary and secondary schools, by level and grade: Selected years, fall 1980 through fall 2030 (table 203.10)
- Enrollment in public elementary and secondary schools, by region, state, and jurisdiction: Selected years, fall 1990 through fall 2030 (table 203.20)
- Public school enrollment in prekindergarten through grade 8, by region, state, and jurisdiction: Selected years, fall 1990 through fall 2030 (table 203.25)
- Public school enrollment in grades 9 through 12, by region, state, and jurisdiction: Selected years, fall 1990 through fall 2030 (table 203.30)
- Enrollment and percentage distribution of enrollment in public elementary and secondary schools, by race/ethnicity and region: Selected years, fall 1995 through fall 2030 (table 203.50)
- Enrollment and percentage distribution of enrollment in public elementary and secondary schools, by race/ethnicity and level of education: Fall 1999 through fall 2030 (table 203.60)
- Public and private elementary and secondary teachers, enrollment, pupil/teacher ratios, and new teacher hires: Selected years, fall 1955 through fall 2030 (table 208.20)
- Current expenditures and current expenditures per pupil in public elementary and secondary schools: 1989–90 through 2030–31 (table 236.15)
Explore previous editions of the Projections of Education Statistics.
By Véronique Irwin, NCES