Statistics paint a portrait of our Nation. They provide important information that can help track progress and show areas that need attention. Beginning with the first Census in 1790, federal statistics have been used to allocate representation in Congress. Labor statistics have been gathered since the middle of the 19th century. And since 1870, the federal government has collected statistics on the condition and progress of American education.
One of the early Commissioners, John Eaton, lamented in his 1875 report to Congress that, “When the work of collecting educational statistics was begun by the Office, it was found that there was no authentic list of the colleges in the United States, or of academies, or normal schools, or schools of science, law, or medicine, or of any other class of educational institutions.” In the beginning, data were collected on basic items such as public school enrollment and attendance, teachers and their salaries, high school graduates, and expenditures. Over the years, the level of detail gradually has increased to address the needs of policy makers and the public. For example, data collections were expanded after WWII to provide more information on the growth of postsecondary education resulting from the Servicemen’s Readjustment Act, also known as the GI Bill.
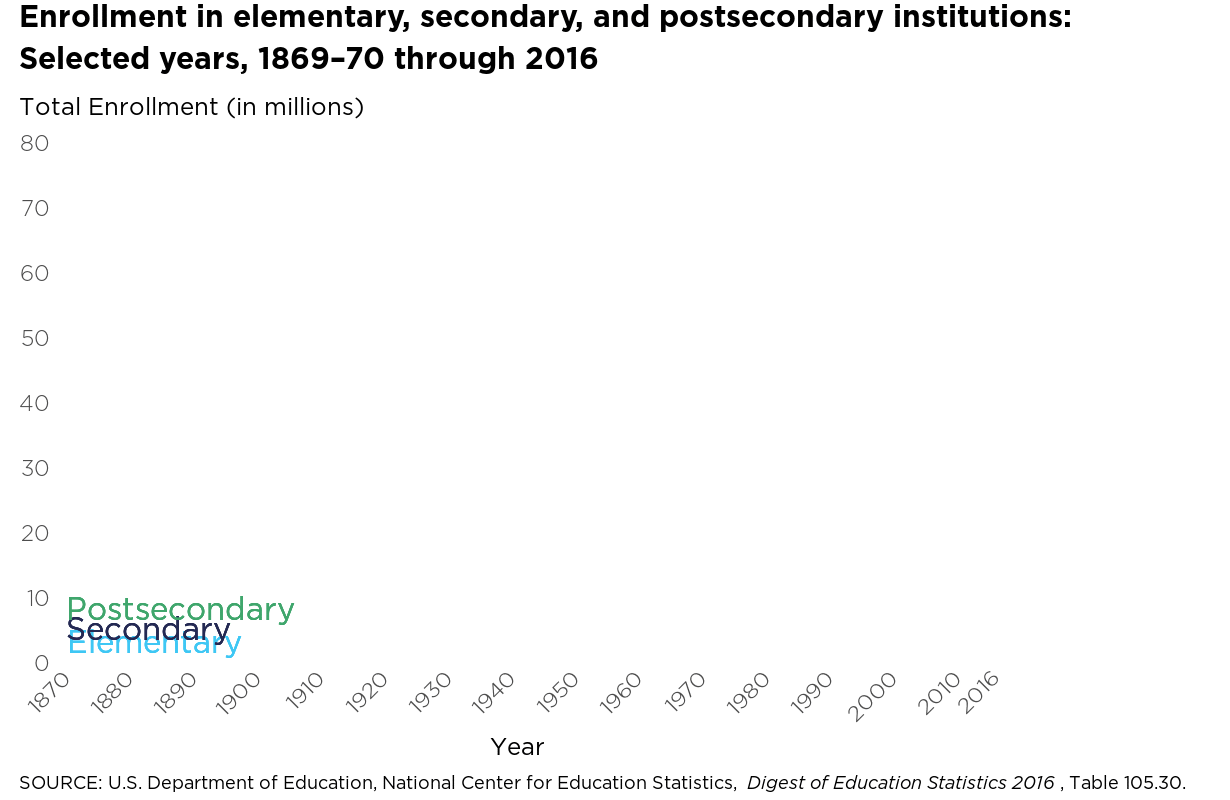
Patterns of enrollment change help to illustrate the growth in the nation’s education system. In 1900, relatively few students ever attended high school or college. Of the 17.1 million students in 1900, only about 0.6 million, 4 percent of students, were enrolled in grades 9 through 12 and 0.2 million, 1 percent of students, were enrolled in postsecondary education. During the first half of the 20th century, high school became a key part of the educational experience for most Americans. Between 1899-1900 and 1949-50, both population growth and an increase in the number of students attending high school and postsecondary education led to shifts in the distribution of students at different levels. Of the 31.2 million students in 1949-50, about 71 percent were enrolled in prekindergarten through grade 8, about 21 percent were enrolled in grades 9 through 12, and about 9 percent were enrolled in college. From 1949–50 to more recent years, enrollment in postsecondary education has become more common. Of the 75.7 million students enrolled in 2015, about 26 percent were enrolled in postsecondary education. About 52 percent of students were enrolled in prekindergarten through grade 8 in 2015, and about 22 percent were enrolled in grades 9 through 12.
In 1962, the National Center for Education Statistics was authorized by legislation, which underscored the expanding role of education statistics within the federal system. This new role was highlighted by major advances in gathering policy-relevant and research-oriented information about our education system through the establishment of the National Assessment of Educational Progress (NAEP) in the late 1960s and the beginning of the National Longitudinal Study of 1972. Elementary and secondary administrative record systems were expanded by working collaboratively with state education agencies through the Common Core of Data beginning in the late 1970s.
The Integrated Postsecondary Education Data System (IPEDS) was developed from existing systems to better meet the needs of institutional, state, and federal decision makers. At the same time, the Center developed new sample surveys to efficiently meet research and policy needs. These new surveys included the National Postsecondary Student Aid Study (1986-87), the Schools and Staffing Survey (1987-88) and the National Household Education Survey (1991).
NCES longitudinal studies have continued to strongly support research and policy analyses at all levels from early childhood to postsecondary education. One example was the groundbreaking Early Childhood Longitudinal Study, Birth Cohort (2001), which obtained nationally representative data on children from birth to kindergarten entry. NCES has continued a tradition of innovation by including digitally based assessments in the 2017 National Assessment of Educational Progress and by introducing interactive geographic mapping to our website. NCES strives to improve measures of the condition of education by collecting data that reflect the educational experiences of all students, while maintaining a faithful commitment to accuracy, transparency, and objectivity. Find out more about the history of NCES here or by visiting the NCES webpage at nces.ed.gov.
By Tom Snyder