NCES Blog

National Center for Education Statistics

Differences in Postsecondary Persistence by Student and School Characteristics

By Cris de Brey

About 70 percent of first-time postsecondary students who started at 2-year or 4-year colleges in 2011-12 were either still enrolled or had attained a degree or certificate three years later. But a recent spotlight in the Condition of Education shows that there are differences in postsecondary persistence based on the type of institution attended and student demographics. 

Given the economic and employment benefits of postsecondary education, it’s important that students who enroll in postsecondary education persist to degree completion. Persistent students are those that were enrolled at any institution or had attained a degree or certificate 3 years after first enrolling. The spotlight uses data from the Beginning Postsecondary Students Longitudinal Study and focuses on differences in persistence rates by demographic and college or university characteristics.

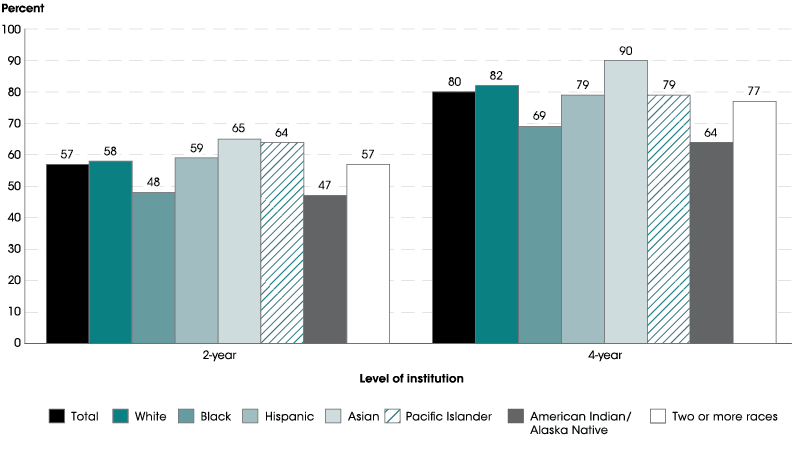
In spring 2014, the persistence rate for students who began at 2-year institutions in 2011–12 was 23 percentage points lower than for students who began at 4-year institutions (see Figure 1).


Figure 1. Persistence rates of first-time postsecondary students who began at 2- and 4-year institutions during the 2011–12 academic year, by race/ethnicity: Spring 2014
NOTE: Race categories exclude persons of Hispanic ethnicity. Students who first enrolled during the 2011–12 academic year are considered to have persisted if they were enrolled at any institution in Spring 2014 or had attained a degree or certificate by that time.
SOURCE: U.S. Department of Education, National Center for Education Statistics, 2012/14 Beginning Postsecondary Students Longitudinal Study (BPS:12/14). See Digest of Education Statistics 2016, table 326.50.


A gap between persistence rates at 2- and 4-year institutions was also observed for students who were White, Black, Hispanic, Asian, and of Two or more races. The difference in persistence rates between students who began at 2- and 4-year institutions ranged from 19 percentage points for Hispanic students to 25 percentage points for White students and Asian students.

Among students who began at 4-year institutions, Asian students had a higher persistence rate as of spring 2014 than White students. Both Asian and White students had a higher persistence rate than Hispanic, Black, and American Indian/Alaska Native students.

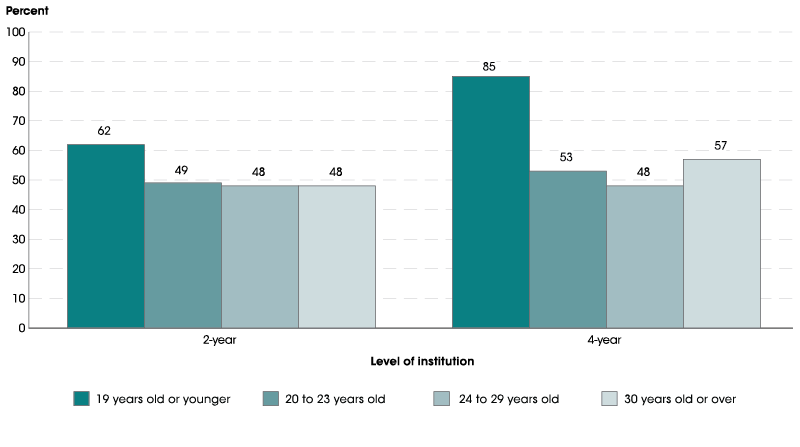
Looking at age differences, the persistence rate for students who were 19 years old or younger was higher than the rates for older students who began at both 2-year and 4-year institutions (see Figure 2).


Figure 2. Persistence rates of first-time postsecondary students who began at 2- and 4-year institutions during the 2011–12 academic year, by age when first enrolled: Spring 2014
NOTE: Students who first enrolled during the 2011–12 academic year are considered to have persisted if they were enrolled at any institution in Spring 2014 or had attained a degree or certificate by that time.
SOURCE: U.S. Department of Education, National Center for Education Statistics, 2012/14 Beginning Postsecondary Students Longitudinal Study (BPS:12/14). See Digest of Education Statistics 2016, table 326.50.


There was no measurable difference between the persistence rates for the oldest three age groups who began at either type of institution.

The persistence rate for students 19 years old or younger who began at 2-year institutions was 24 percentage points lower than the rate for their same-aged peers who began at 4-year institutions. Unlike the youngest students, there were no measurable differences in persistence rates by level of institution for students who began their postsecondary education when they were 20 to 23 years old, 24 to 29 years old, and 30 years old or over.

For more information on postsecondary persistence rates, see the full spotlight on this topic in the Condition of Education. 

Expanding Student Success Rates to Reflect Today’s College Students

By Gigi Jones

Since the 1990s, the Integrated Postsecondary Education Data System (IPEDS) has collected and published graduation rates for colleges and universities around the country. These rates were based on traditional college students—first-time, full-time degree- or certificate-seeking undergraduate students (FTFT) who, generally, enrolled right after high school.

While these data are insightful, some have argued the FTFT graduation rate only provides a part of the picture because it doesn’t consider non-traditional students, including those who are part-time students and transfers. This is an important point because, over the past decade, the number of non-traditional students has outpaced the increase in traditional students, mostly driven by growth in those who have transferred schools.  

The new IPEDS Outcome Measures survey was designed to help answer these changes. Starting with the 2015-16 collection cycle, entering students at more than 4,000 degree-granting institutions must be reported in one of four buckets, also called cohorts (see Figure below).

The FTFT cohort is similar to what has been collected since the 1990s, but the Outcome Measures adds three new student groups to the equation: 

  • First-time, part-time students (FTPT), who attend less than a full-time credit workload each term (typically less than 12-credits) and who have no prior postsecondary attendance; 
  • Non-first-time students, also known as transfer-in students, who are enrolled at a full-time level (NFTFT); and
  • Non-first-time students, also known as transfer-in students, who are enrolled at a part-time level (NFTPT).

For these four cohorts, postsecondary institutions report the awards conferred at two points of time after the students entered the institution: 6 years and 8 years. If students did not receive an award, then institutions must report their enrollment status one of three ways: 1) Still enrolled at the same institution; 2) Transferred out of the institution; or 3) Enrollment status is unknown.

These changes help respond to those who feel that the FTFT graduation rates do not reflect the larger student population, in particular public 2-year colleges that serve a larger, non-traditional college student population. Since 2008, steps have been taken to construct and refine the data collection of non-traditional college students through a committee of higher education experts (PDF) and public Technical Review Panels (see summaries for panels 37, 40 and 45).

The 2016-17 preliminary Outcome Measures data were released on October 12, as part of a larger report on IPEDS winter data collection. The data for individual schools can be found on our College Navigator site.  The final data for 2015-16 will be released in early 2018. Sign up for the IES News Flash to be notified when the new data are released or follow IPEDS on Twitter. You can also visit the IPEDS Outcome Measures website for more information. 

While this is an important step in the process, we are continuing to improve the data collection process. Starting with the 2017-18 Outcome Measures collection, the survey includes more groups (i.e., Pell Grant v. Non-Pell Grant recipients), a third award status point (4-years after entry), and the identification of the type of award (i.e., certificates, Associate’s, and Bachelor’s). Watch for the release of these data in fall 2018. 

EDITOR'S NOTE: This post was updated on October 12 to reflect the release of Outcome Measures data.

Education at a Glance 2016: Situating Education Data in a Global Context

By Lauren Musu-Gillette

Putting educational and economic outcomes in the United States within a global context can help researchers, policy makers, and the public understand how individuals in the U.S. compare to their peers internationally.  Education at a Glance, an annual publication produced by the Organisation for Economic Co-operation and Development (OECD), provides data on the structure, finances and progress of education systems in the 35 OECD countries, including  the U.S., as well as a number of partner countries. This type of data is important to understand as our students compete in an increasingly global society.

The recently released 2016 edition of the report indicates that the U.S. is above the average on some measures, but there are others presented in the report in which the U.S. lags behind our international peers.

For instance, the share of U.S. adults with a postsecondary education remains above the OECD average. In the U.S., 45 percent of adults, ages 25-64, have at least some postsecondary education, which is 10 percentage points above the OECD average. However, this advantage is shrinking because the postsecondary enrollment in other OECD countries is increasing more rapidly than in the U.S., where enrollment rates have begun to level off.

The United States continues to be a global leader in attracting international students to attend our postsecondary institutions at the postbaccalaureate level. In 2014, international students made up only 3.5 percent of students enrolled in bachelor’s or equivalent programs, compared with 9% in master’s or equivalent programs and 35% in doctoral or equivalent programs. The U.S., along with the United Kingdom and France, attract more than half of master's and doctoral international students worldwide.

In terms of labor market outcomes, gender disparities in earnings are wider in the U.S. than the OECD average. Among adults in the U.S. with postsecondary education, women earn only 68% of what men earn. This gender gap is larger than the gap for all other OECD countries except Brazil, Chile, Israel, Mexico and the Slovak Republic. Similar gaps exist for males and females in the U.S. across all levels of education.

This is just a small slice of the information that can be found in Education at a Glance 2016. You can also find a wealth of other data on topics of perennial interest, such as the percentage of 3- and 4-year-olds enrolled in early childhood education programs; working conditions of teachers, including time spent in the classroom and salary data; and education finance and per-student expenditures. A relatively new feature is an international comparison for states and other subnational units on key education indicators.

Browse the full report to see how the U.S. compares to other countries on these important education-related topics.

Back to School by the Numbers

By Dana Tofig, Communications Director, Institute of Education Sciences

Across the country, hallways and classrooms are full of activity as students head back to school for the 2016–17 academic year. Each year, the National Center for Education Statistics (NCES) compiles some back-to-school facts and figures that give a snapshot of our schools and colleges for the coming year. You can see the full report on the NCES website, but here are a few “by-the-number” highlights. You can also click on the hyperlinks throughout the blog to see additional data on these topics.

The staff of NCES and the Institute of Education Sciences hopes our students, teachers, administrators and families have an outstanding school year!


50.4 million

The number of students expected to attend public elementary and secondary schools this year—slightly more than the 2015–16 school year. The racial and ethnic profile of these students will continue to shift, with 24.6 million White students, 7.8 million Black students, 13.3 million Hispanic students, 2.7 million Asian/Pacific Islanders students, 0.5 million  American Indian/Alaska Native students, and 1.5 million students who are two or more races. About 5.2 million students are expected to attend private schools.


16.1

The expected number of public school students per teacher in fall 2016. This ratio hasn’t changed much since 2000, when it was 16.0. However, the pupil/teacher ratio is lower in private schools—12.1—and has fallen since 2000, when it was 14.5. 


$11,600

This is the projected per-student expenditure in public elementary and secondary schools in 2016–17. Adjusting for inflation, per student expenditures are expected to rise about 1.5 percent over last school year.


3.5 million

The number of students expected to graduate from high school this academic year—nearly 3.2 million from public school and more than 310,000 from private schools.


20.5 million

This is the number of students expected to attend American colleges and universities this fall—an increase of 5.2 million since fall 2000. About 11.7 million of these students will be female, compared with 8.8 million males. About 13.3 million will attend four-year institutions and 7.2 million will attend two-year institutions.


14.5% and 16.5%

These percentages represent college students who were Black and Hispanic, respectively, in 2014. From 2000 to 2014, the percent of college students who were Black rose 2.8 percentage points (from 11.7 percent to 14.5 percent) and the percent of college students who were Hispanic rose 6.6 percentage points (from 9.9 percent to 16.5 percent).


$16,188 and $41,970

These are the average annual prices for undergraduate tuition, fees, room, and board at public and private non-profit institutions, respectively, for the 2014–15 academic year. The average annual price at private, for-profit institutions was $23,372. 


A Milestone for Education Statistics: The 50th edition of the Digest of Education Statistics

By Tom Snyder

For more than five decades, the Digest of Education Statistics has been addressing the data needs of a wide array of people, from policymakers who require a reliable, unbiased foundation for decision-making to researchers who seek to unravel the complex facts underlying key issues of the day; from reporters who need in-depth information for education-related news stories to organizational leaders who rely on annually updated data to steer their course. The Digest also serves the needs of everyday citizens who may be curious about such things as the number of high school graduates in the United States, the latest trends in postsecondary costs and financial assistance, or the earnings of employees with various types of degrees.

Released on April 28, Digest of Education Statistics 2014 is the 50th in a series of reports that has been issued annually since 1962, except for combined editions for the years 1977-78, 1983-84, and 1985-86. The Digest provides a compilation of statistical information covering the broad field of American education from prekindergarten through graduate school. Subject matter includes the number of schools and colleges, teachers, enrollments, and graduates, in addition to data on educational attainment, finances, federal funds for education, libraries, and international education.

The Digest continues a long tradition of recurring statistical reports issued by NCES and its predecessor agencies. From 1869-70 to 1916-17, statistical data were included in the Annual Report of the Commissioner of Education. A similar report, the Biennial Survey of Education in the United States, was issued every other year from 1917-18 to 1957-58.

By the summer of 1962, the need for an annual statistical summary report had become obvious to agency staff, and the first edition of the Digest was published. Dr. Vance Grant, who played a leading role in developing the first edition of the Digest, continued to direct the project until the 1985-86 edition. During these years, the Digest responded to the growing data needs of policymakers by adding new information on children with disabilities, preprimary education, career and technical education, educational attainment, and salary data. In 1987, I took over the responsibility of publishing the Digest, and we have continued to make changes that meet the needs of the policy community. This includes expanding the quantity of state-level tables, constructing tables to show institution-level data for large school districts and colleges, and adding more racial/ethnic data.

Beginning with the 1995 edition, a strong web presence was developed for the Digest, reflecting increased needs for digital access to education data. The full tabular content of the report is presented on the NCES website in HTML format, and a spreadsheet version of each statistical table is also available for users to download. The 2013 edition introduced a revamped web structure and table-numbering system that makes it easier for users to quickly find the latest version of a specific table, as well as to explore all the tables that are currently available on a specific topic. Rather than numbering the entire set of tables sequentially, the latest editions of the Digest use a subject-matter numbering sequence that will remain the same year after year. The most current versions of Digest tables are posted to the website on a rolling basis, before the entire edition of the report has been completed.

Over the years, the Digest has evolved as an education data resource that continues to support the information needs of our modern society. The newly released 2014 edition provides convenient online access to 594 tables covering the full range of education topics.