The COVID-19 pandemic has brought enormous challenges to the education system, including a historic decline in enrollment in fall 2020—the largest since during World War II. Due to the relatively small decrease in the number of teachers, there was a significant drop in the pupil/teacher ratio.
The National Center for Education Statistics (NCES) releases key statistics, including school staffing data, compiled from state administrative records through the Common Core of Data (CCD). In 2019, about 48 percent of public school staff were teachers (3.2 million) and 13 percent were instructional aides (0.9 million). NCES’s new School Pulse Panel survey found that in January 2022, about 61 percent of public schools with at least one vacancy reported that the pandemic increased the number of teacher and staff vacancies, and 57 percent of schools with at least one vacancy found that the pandemic forced them to use teachers outside their normal duty areas.
Pupil/teacher ratios provide a measure of the quantity of instructional resources available to students by comparing the number of students with the total full-time equivalent (FTE) of all teachers, including special education teachers. The public and private elementary and secondary average class size is larger than the pupil/teacher ratio since it normally does not factor into team teaching, specialty teachers, or special education classes. Between fall 2019 and fall 2020, enrollment in public elementary and secondary schools1 decreased by 2.7 percent.2 This decrease was larger than the 0.2 percent (6,700)3 decrease in the number of public school teachers. Since fall 2020, public school enrollment decreased by a larger amount than did the number of teachers. Thus, the pupil/teacher ratio declined in school year 2020–21 by a relatively large 0.5 pupils per teacher, from 15.9 to 15.4 pupils per teacher (figure 1). This is the largest 1-year decrease in more than 4 decades. In comparison, the pupil/teacher ratio for private schools was 11.4 in 2019–20 (the latest year of actual data available). It is worth noting that pupil/teacher ratios vary across schools with different characteristics (table 208.10).
Viewed over a longer term, the pupil/teacher ratio in public schools in 2019–20 (15.9) was only slightly lower than in 2010–11 (16.0), so nearly all the change during the 2010–11 to 2020–21 period occurred in the last year. The pupil/teacher ratio for private schools decreased from 12.5 in 2010–11 to 11.4 in 2019–20.
Figure 1. Pupil/teacher ratio in public and private elementary and secondary schools: 2010–11 to 2020–21
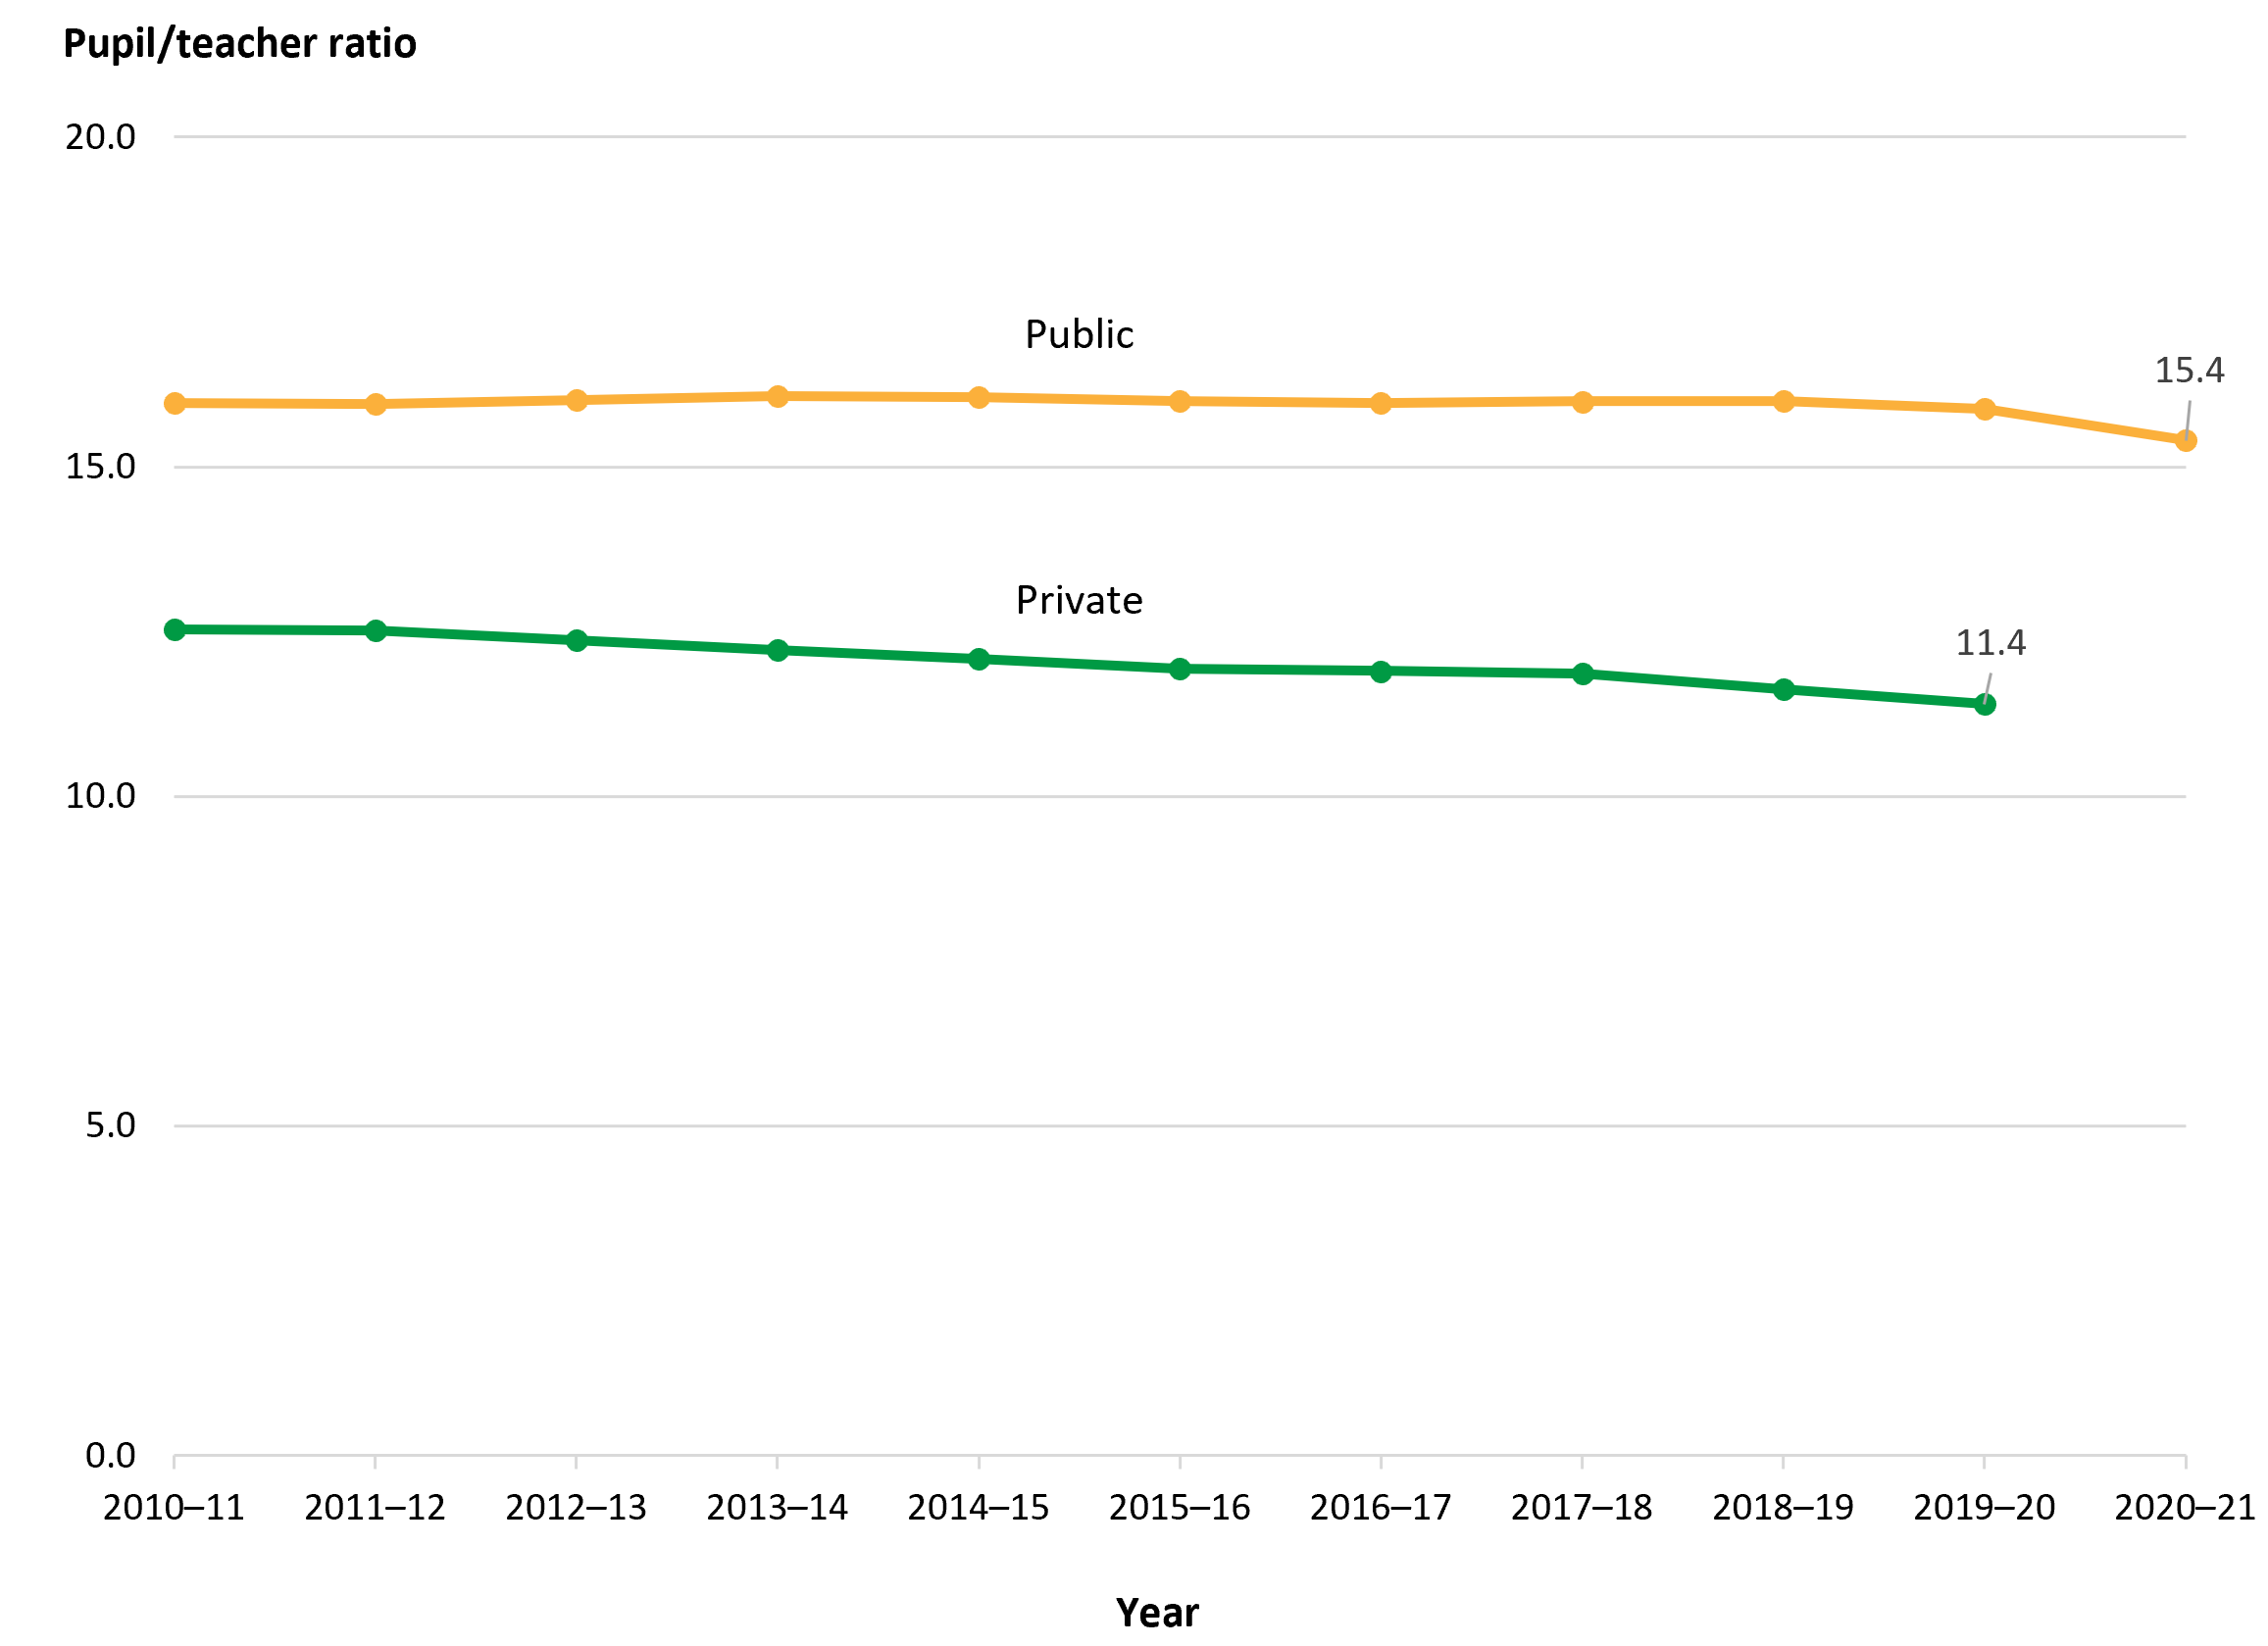
NOTE: Data in this figure represent the 50 states and the District of Columbia. Data for teachers are expressed in full-time equivalents (FTE). Counts of private school enrollment include prekindergarten through grade 12 in schools offering kindergarten or higher grades. Counts of private school teachers exclude teachers who teach only prekindergarten students. Counts of public school teachers and enrollment include prekindergarten through grade 12. The pupil/teacher ratio includes teachers for students with disabilities and other special teachers, while these teachers are generally excluded from class size calculations. Ratios for public schools reflect totals reported by states and differ from totals reported for schools or school districts. The school year 2020–21 pupil/teacher ratio shown in this figure includes only states which reported both membership and FTE teacher counts for SY 2020–21.
SOURCE: U.S. Department of Education, National Center for Education Statistics, Digest of Education Statistics 2021, table 208.20; Common Core of Data, table 2.
The declines in pupil/teacher ratios in public schools were not consistent across states between 2019–20 and 2020–21 (figure 2). The relatively large enrollment decreases in many states—along with the smaller decreases or even increases in the number of teachers in fall 2020—led to decreases in the pupil/teacher ratios for most states. Three states (Nevada, Florida, and Ohio) reported increases in their pupil/teacher ratios, and the rest of the states reporting data had decreases in their pupil/teacher ratios. The states with the largest decreases in their pupil/teacher ratios were Indiana (-1.3 pupils per teacher), Arizona (-1.1 pupils per teacher), Kansas (-0.9 pupils per teacher), and Kentucky (-0.9 pupils per teacher).4
Figure 2. Change in pupil/teacher ratios in public elementary and secondary schools, by state: 2019–20 to 2020–21
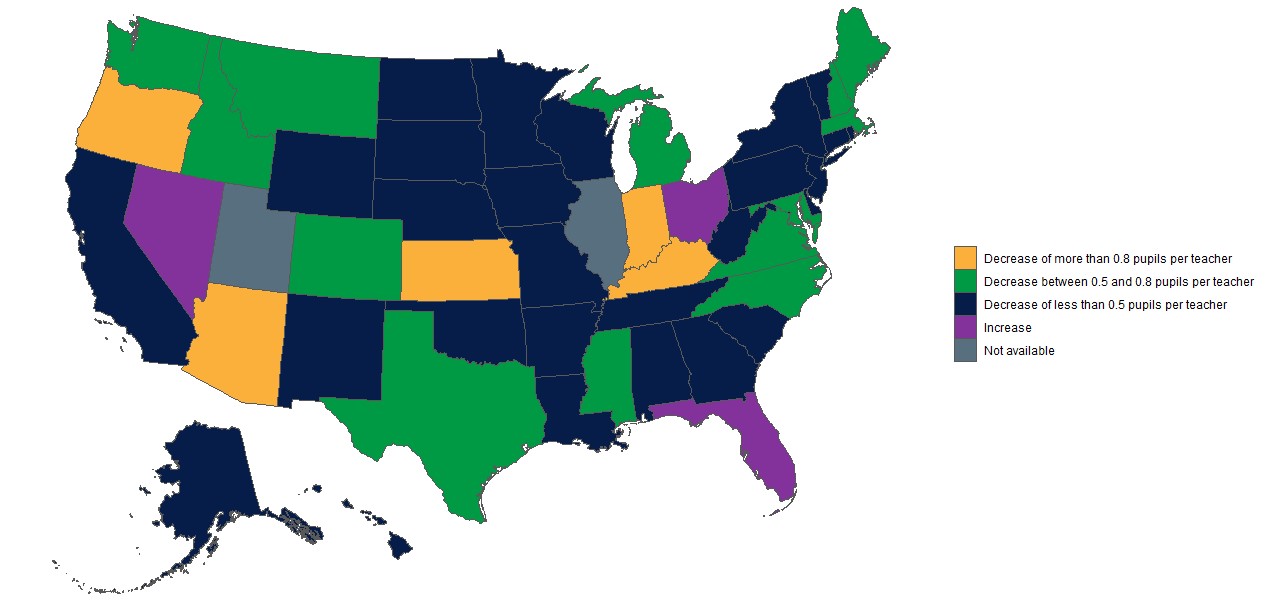
NOTE: Data for Illinois and Utah are not available.
SOURCE: U.S. Department of Education, National Center for Education Statistics, Common Core of Data (CCD), “State Nonfiscal Public Elementary/Secondary Education Survey,” 2019–20 v.1a, table 2, and 2020–21 v.1a, table 2.
By Tom Snyder, AIR
[1] Counts of public school teachers and enrollment include prekindergarten through grade 12.
[2] Enrollment data are for fall of the school year while pupil/teacher ratios are based on school years.
[3] Includes imputed teacher FTE data for Illinois and Utah.
[4] Although Oregon had a 2 pupil per teacher decrease based on the Summary Table 2 for 2019–20 and 2020–21, Oregon did not submit prekindergarten data for 2020–21, so the ratios were not comparable.