NCES Blog

National Center for Education Statistics

New Data Available on Prevalence of Recognized Student Acceptance Groups

Schools can help to foster students’ understanding of diversity and create environments where students feel safe and welcome. One way to do this is by organizing student groups whose purpose is to promote acceptance of other students. The School Survey on Crime and Safety (SSOCS) collected data on the presence of recognized student acceptance groups during the 2015–16 school year from a nationally representative sample of 3,500 K–12 public schools. The questionnaire asked whether schools had student groups that promote acceptance of students’ sexual orientations[i] and gender identities,[ii] of students with disabilities, and of cultural diversity.

Among all public schools, groups that promote acceptance of students with disabilities were most common. Some 27 percent of schools reported having a student group that promotes acceptance of students with disabilities during the 2015­–16 school year, compared with 21 percent that reported having a student group that promotes acceptance of cultural diversity and 12 percent that reported having a student group that promotes acceptance of students’ sexual orientations and gender identities.


Figure 1. Percentage of public schools reporting the presence of recognized student acceptance groups, by school level and purpose of student group: School year 2015–16

1Primary schools are defined as schools in which the lowest grade is not higher than grade 3 and the highest grade is not higher than grade 8. Middle schools are defined as schools in which the lowest grade is not lower than grade 4 and the highest grade is not higher than grade 9. High schools are defined as schools in which the lowest grade is not lower than grade 9 and the highest grade is not higher than grade 12. The total also includes combined schools. Combined schools are schools that have a combination of grades that cannot be categorized as primary, middle, or high schools, including K–12 schools. 
2Sexual orientation was defined for respondents as one’s emotional or physical attraction to the same and/or opposite sex. Gender identity was defined for respondents as one’s inner sense of one’s own gender, which may or may not match the sex assigned at birth. Different people choose to express their gender identity differently. For some, gender may be expressed through, for example, dress, grooming, mannerisms, speech patterns, and social interactions. Gender expression usually ranges between masculine and feminine, and some transgender people express their gender consistent with how they identify internally, rather than in accordance with the sex they were assigned at birth. An example of a student group to promote acceptance of students' sexual orientations and gender identities provided to respondents was a Gay-Straight Alliance.
3An example of a student group to promote acceptance of students with disabilities provided to respondents was Best Buddies.
4An example of a student group to promote acceptance of cultural diversity provided to respondents was a Cultural Awareness Club.
NOTE: Responses were provided by the principal or the person most knowledgeable about school crime and policies to provide a safe environment. Although rounded numbers are displayed, the figures are based on unrounded data. 
SOURCE: U.S. Department of Education, National Center for Education Statistics (NCES), 2015–16 School Survey on Crime and Safety (SSOCS), 2016. See table 37.


All three types of acceptance groups were more common in high schools than in middle or primary schools. The most common type of student acceptance group varied by school level. For example, among middle schools, the percentage of schools that reported having a student group that promotes acceptance of students with disabilities (32 percent) was higher than the percentage that reported having a student group that promotes acceptance of cultural diversity (22 percent) or acceptance of students’ sexual orientations and gender identities (12 percent). This pattern was similar for primary schools. Among high schools, the percentage of schools that reported having a student group that promotes acceptance of students’ sexual orientations and gender identities (50 percent) was higher than the percentage that reported having a student group that promotes acceptance of students with disabilities (45 percent).

During the 2015–16 school year, all three types of student acceptance groups were more commonly found in schools in cities and suburbs than in schools in rural areas. For example, 30 percent of schools in cities and 26 percent of schools in suburbs reported having a student group that promotes acceptance of cultural diversity, compared with 10 percent of schools in rural areas.


Figure 2. Percentage of public schools reporting the presence of recognized student acceptance groups, by purpose of student group and school locale: School year 2015–16

1Sexual orientation was defined for respondents as one's emotional or physical attraction to the same and/or opposite sex. Gender identity was defined for respondents as one's inner sense of one's own gender, which may or may not match the sex assigned at birth. Different people choose to express their gender identity differently. For some, gender may be expressed through, for example, dress, grooming, mannerisms, speech patterns, and social interactions. Gender expression usually ranges between masculine and feminine, and some transgender people express their gender consistent with how they identify internally, rather than in accordance with the sex they were assigned at birth. An example of a student group to promote acceptance of students' sexual orientations and gender identities provided to respondents was a Gay-Straight Alliance.
2An example of a student group to promote acceptance of students with disabilities provided to respondents was Best Buddies.
3An example of a student group to promote acceptance of cultural diversity provided to respondents was a Cultural Awareness Club.
NOTE: Responses were provided by the principal or the person most knowledgeable about school crime and policies to provide a safe environment.
SOURCE: U.S. Department of Education, National Center for Education Statistics (NCES), 2015–16 School Survey on Crime and Safety (SSOCS), 2016. See table 37.


You can find more information on school crime and safety in NCES publications, including Crime, Violence, Discipline, and Safety in U.S. Public Schools: Findings From the School Survey on Crime and Safety: 2015–16 and the 2017 Indicators of School Crime and Safety.


By Rachel Hansen, NCES, and Melissa Diliberti, AIR


[i]Sexual orientation was defined for respondents as one’s emotional or physical attraction to the same and/or opposite sex.

[ii]Gender identity was defined for respondents as one’s inner sense of one’s own gender, which may or may not match the sex assigned at birth. Different people choose to express their gender identity differently. For some, gender may be expressed through, for example, dress, grooming, mannerisms, speech patterns, and social interactions. Gender expression usually ranges between masculine and feminine, and some transgender people express their gender consistent with how they identify internally, rather than in accordance with the sex they were assigned at birth.

National Spending for Public Schools Increases for Third Consecutive Year in School Year 2015-16

Spending on elementary and secondary education increased in school year 2015–16 (Fiscal Year 2016). At the national level, education spending has recovered from the economic downturn between 2009 and 2013. This is the third consecutive year spending increased, reversing a decline in spending for the prior four years after adjusting for inflation. These findings come from a recently released report from the National Center for Education Statistics (NCES).

The First Look report, Revenues and Expenditures for Public Elementary and Secondary Education: School Year 2015–16 (Fiscal Year 2016) is based on data from the National Public Education Finance Survey (NPEFS), a component of the Common Core of Data (CCD).  

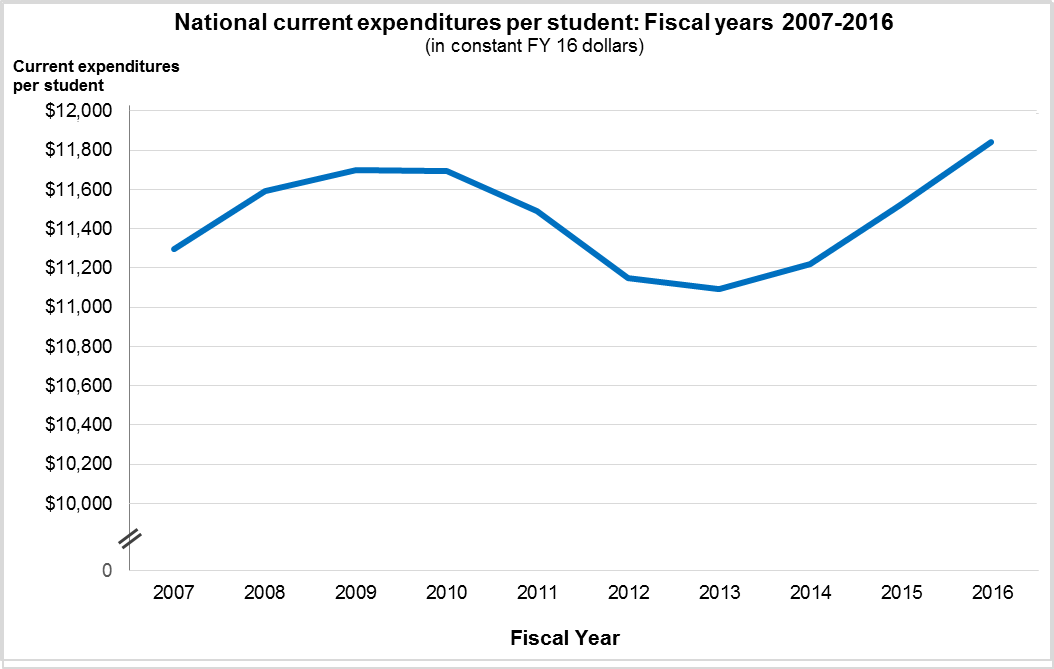
The amount spent per student for the day-to-day operation of public elementary and secondary schools rose to $11,841 in Fiscal Year (FY) 16.[1] Current expenditures per student increased by 2.9 percent between FY 15 and 16, following on the heels of an increase of 3.2 percent from the prior year, after adjusting for inflation.[2]  Although spending per student was higher in FY 16 than in FY 07, it had decreased each year from FY 09 to FY 13.

NOTE: Spending is reported in constant FY 16 dollars, based on the Consumer Price Index (CPI).
SOURCE: U.S. Department of Education, National Center for Education Statistics, Common Core of Data (CCD), "National Public Education Financial Survey," fiscal years 2007 through 2016.


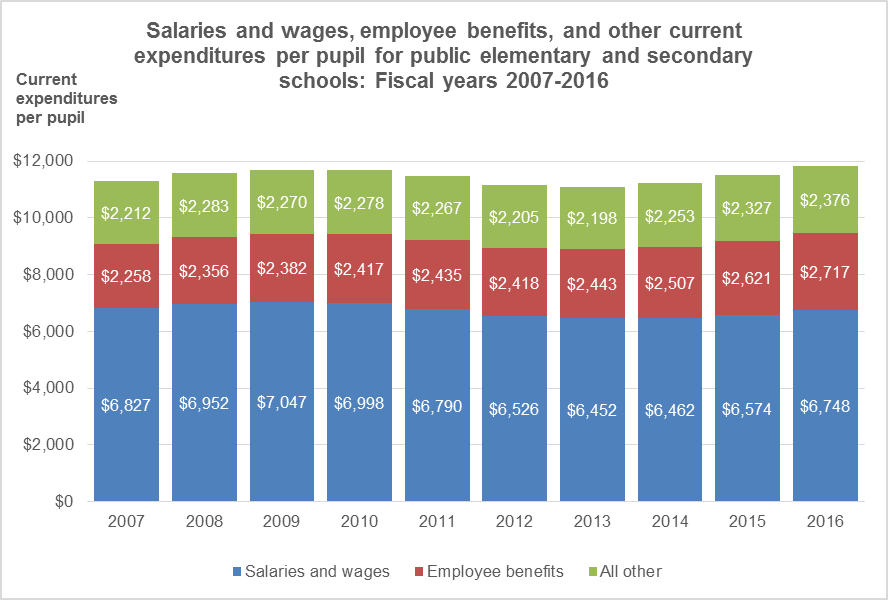
Salaries and wages make up the largest proportion of current expenditures, but have increased at a much slower rate than employee benefits or other expenditures.[3]  After peaking at $7,047 per pupil in FY 09, salaries and wages declined to a low of $6,452 per pupil in FY 2013, and increased to $6,748 per pupil in FY 16.

The proportion of salaries and wages in current expenditures per pupil decreased from 60.2 percent in FY 09 to 57.0 in FY 16. In contrast, the proportion of employee benefits in current expenditures per pupil increased from 20.4 percent in FY 09 to 22.9 percent in FY 16.

NOTE: Spending is reported in constant FY 16 dollars, based on the Consumer Price Index (CPI).
SOURCE: U.S. Department of Education, National Center for Education Statistics, Common Core of Data (CCD), "National Public Education Financial Survey," fiscal years 2007 through 2016.


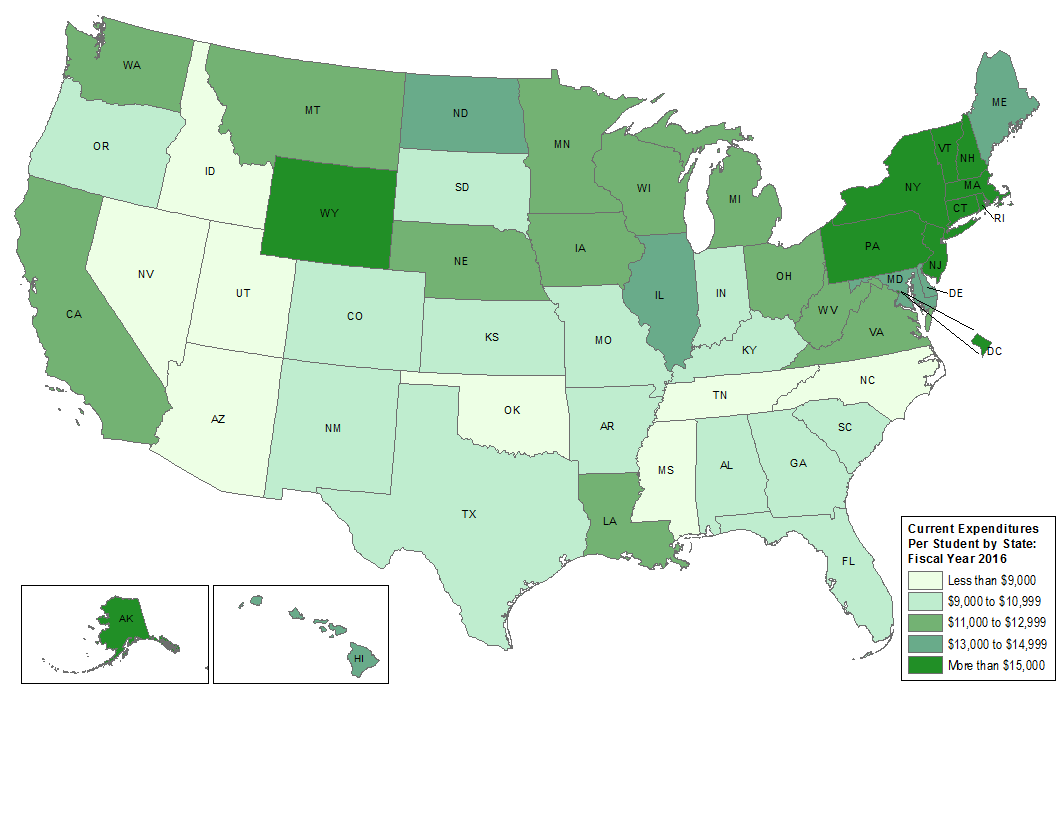
At the state level, spending on current expenditures per student ranged from a low of $7,006 in Utah to a high of $22,231 in New York. Current expenditures per student were at least 40 percent higher than the national average in the following states and jurisdictions:

  • New York ($22,231)
  • District of Columbia ($21,135)
  • Connecticut ($19,615)
  • New Jersey ($19,041)
  • Vermont ($19,023)
  • Alaska ($17,510)
  • Massachusetts ($16,986)

Current expenditures per student for public elementary and secondary education, by state: Fiscal year 2016
SOURCE: U.S. Department of Education, National Center for Education Statistics, Common Core of Data (CCD), "National Public Education Financial Survey," fiscal year 2016


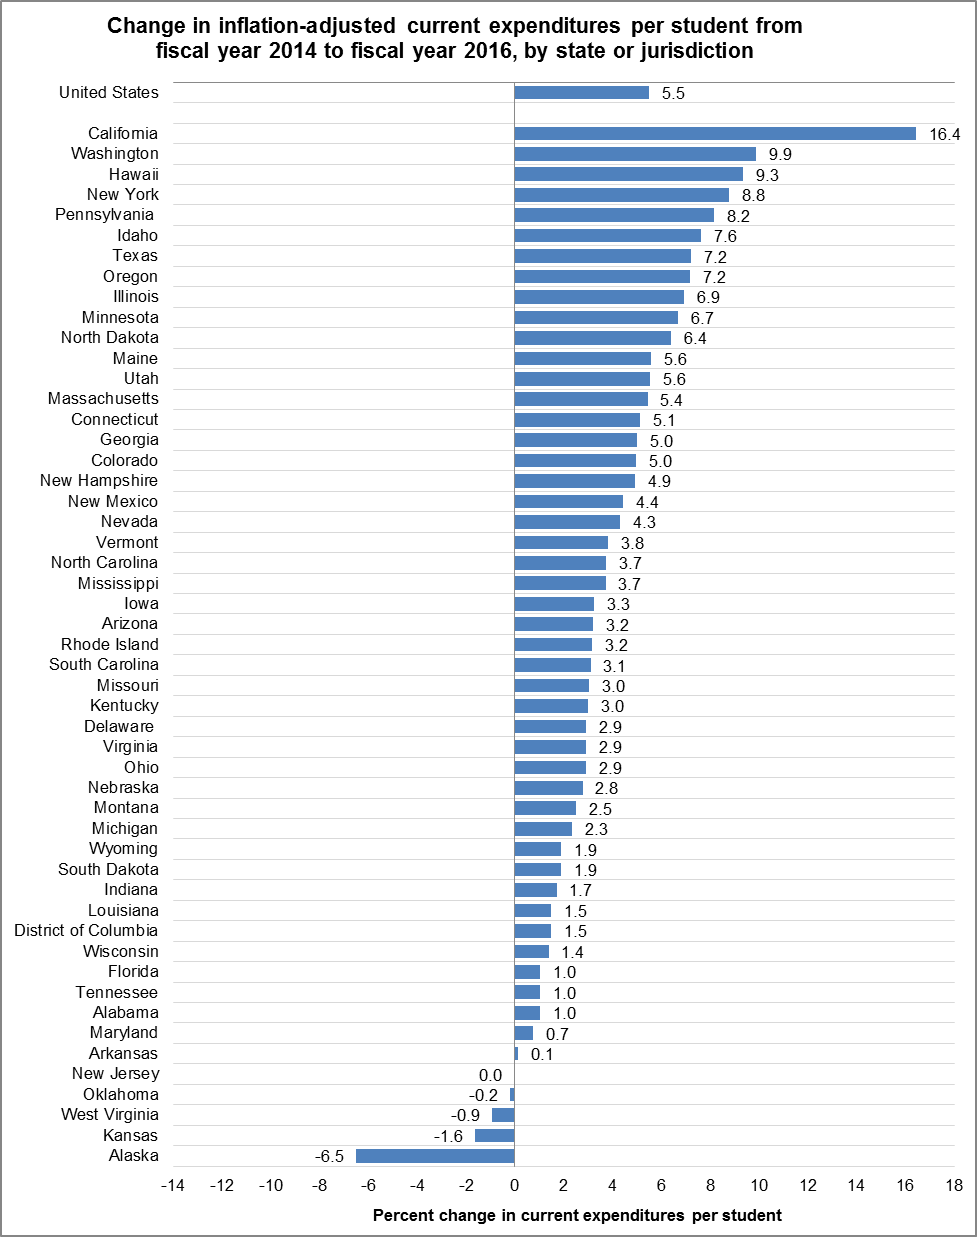
Between FY 14 and FY 16, current expenditures per student increased by 3 percent or more in 29 states, and by 1 to less than 3 percent in 15 states. Increases in current expenditures per student from FY 14 to FY 16 were highest in California (16.4 percent), Washington (9.9 percent), Hawaii (9.3 percent), New York (8.8 percent), and Pennsylvania (8.2 percent).  

NOTE: Spending is reported in constant FY 16 dollars, based on the Consumer Price Index (CPI).
SOURCE: U.S. Department of Education, National Center for Education Statistics, Common Core of Data (CCD), "National Public Education Financial Survey," fiscal years 2014 and 2016. 


The recently released report also presents national and state data on public school funding by source.[4] Total education funding increased by 4.0 percent (from $652.1 to $678.4 billion) from FY 15 to FY 16 following an increase of 3.3 percent from FY 14 to FY 15.  Local funding increased by 3.7 percent (from $291.1 to $303.8 billion), state funding increased by 4.9 percent (from $303.6 to $318.6 billion), and federal funding slightly increased by 1.1 percent (from $55.4 to $56.0 billion).
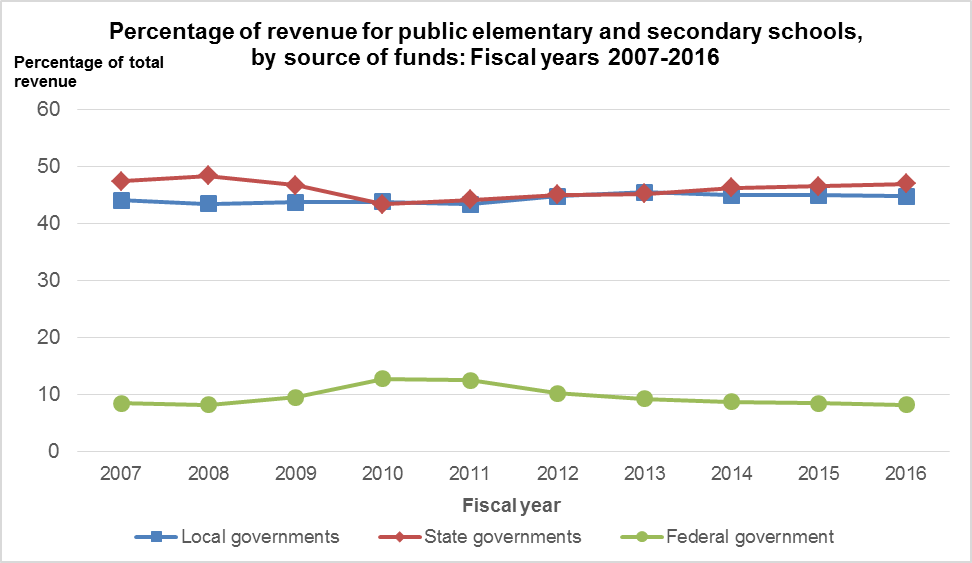

SOURCE: U.S. Department of Education, National Center for Education Statistics, Common Core of Data (CCD), "National Public Education Financial Survey," fiscal years 2007 through 2016.


The percentage of total funding from federal sources accounted for approximately 9 percent of total funding in both FY 07 and FY 16; however, there were notable fluctuations during this period. The federal percentage increased from 8.2 percent of funding in FY 08 to 12.5 percent of funding in FY 11. In part, this increase reflects the impact of the American Recovery and Reinvestment Act (ARRA). As the funds from the program were spent, the federal percentage decreased from 10.2 percent of total funding in FY 12 to 8.3 percent in FY 16.

Local sources accounted for 44.8 percent of total funding in FY 16, and have been relatively stable over the past 10 years. The percentage of total funding from state sources decreased from a high of 48.3 percent in FY 08 to 43.4 percent in FY 10, and has since increased to 47 percent in FY 16.


[1] Spending refers to current expenditures. Current expenditures are comprised of expenditures for the day-to-day operation of schools and school districts for public elementary and secondary education, including expenditures for staff salaries and benefits, supplies, and purchased services. Current expenditures include instruction, instruction-related, support services (e.g., social work, health, and psychological services), and other elementary/secondary current expenditures, but exclude expenditures on capital outlay, other programs, and interest on long-term debt. 

[2] In order to compare spending from one year to the next, expenditures are converted to constant dollars, which adjusts figures for inflation.

[3] Other expenditures include current expenditures other than salaries, wages, and employee benefits, such as purchased services, tuition, supplies, etc.

[4] Funding refers to revenues. Revenues are comprised of all funds received from external sources, net of refunds, and correcting transactions. Noncash transactions, such as receipt of services, commodities, or other receipts in kind are excluded, as are funds received from the issuance of debt, liquidation of investments, and nonroutine sale of property.


The Digital Divide: Differences in Home Internet Access

The expanding use of technology affects the lives of students both inside and outside the classroom. While exposure to learning technology inside schools and classrooms is important, access can also differ once those students are in their homes. It’s important for educators to be aware of the potential barriers to technology and internet access that students may face. A recent report from NCES, Student Access to Digital Learning Resources Outside the Classroom, highlighted some differences in home internet access for students.

The percentage of 5- to 17-year-old students with either no internet access or only dial-up access differed by students’ race/ethnicity.

Access also differed geographically. Remote rural locales had the highest percentage of students with either no internet access or only dial up access at home. Within these remote rural areas, the percentage of students lacking access differed by students’ race/ethnicity. Forty-one percent of Black students and 26 percent of Hispanic students living in remote rural areas had either no internet access or only dial up access at home. This was higher than the percentage of White students (13 percent) and Asian students (11 percent) living in remote rural areas who had either no internet access or only dial up access at home.   

The percentage of students who had no access to the Internet or only dial-up access was higher for students living below the poverty threshold (26 percent) than for students living between 100 and 185 percent of the poverty threshold (15 percent) and at greater than 185 percent of the poverty threshold (4 percent).

In 2015, the two most common main reasons for children ages 3 to 18 to not have home internet access were that it was too expensive or that the family did not believe they needed it/ were not interested in having it (38 percent each). Other main reasons for not having home internet access included that the home lacked a computer or a computer adequate for internet use (8 percent), internet service was not available in the area (5 percent), the Internet could be used somewhere else (3 percent), and privacy and security concerns (i.e., online privacy and cybersecurity and personal safety concerns) (2 percent). 

Browse the full report for more data on additional topics relating to differences in access to technology and the internet.


By Lauren Musu

A Closer Look at Charter School Characteristics

Charter school enrollment has grown significantly over time. Between fall 2000 and fall 2015, overall public charter school enrollment increased from 0.4 million to 2.8 million students, and the percentage of public school students who attended charter schools increased from 1 to 6 percent. The number of charter schools also increased during this period, from 1,990 to 6,860.

The characteristics of charter schools and traditional public schools differ in some ways. A higher percentage of charter schools are located in cities and a lower percentage are located in rural areas as compared to traditional public schools.

There are also some differences in the characteristics of students who attend charter schools and traditional public schools. A higher percentage of charter schools had higher percentages of minority students enrolled. In school year 2015–16, more than half of the students were White in 58 percent of traditional public schools. In comparison, 34 percent of charter schools had more than 50 percent White enrollment. In 9 percent of traditional public schools more than half of students were Black compared to 23 percent for charter schools. In 16 percent of traditional public schools, more than half of students were Hispanic compared to 25 percent for charter schools.

High-poverty schools are those in which more than 75 percent of students qualify for free or reduced-price lunch (FRPL) under the National School Lunch Program. In the 2015–16 school year, 24 percent of traditional public schools were high-poverty compared with 35 percent of public charter schools. In contrast, low-poverty schools–in which less than 25 percent of students qualify for FRPL–accounted for 16 percent of traditional public schools and 21 percent of public charter schools.

Access indicators from the Condition of Education on the characteristics of traditional public schools and public charter schools as well as charter school enrollment for more data!


By Lauren Musu

Trends in Graduate Student Loan Debt

Sixty percent of students who completed a master’s degree in 2015–16 had student loan debt, either from undergraduate or graduate school. Among those with student loan debt, the average balance was $66,000.[i] But there are many types of master’s degrees. How did debt levels vary among specific degree programs? And how have debt levels changed over time? You can find the answers, for both master’s and doctorate degree programs, in the Condition of Education 2018.

Between 1999–2000 and 2015–16, average student loan debt for master’s degree completers increased by:

  • 71 percent for master of education degrees (from $32,200 to $55,200),
  • 65 percent for master of arts degrees (from $44,000 to $72,800),
  • 39 percent for master of science degrees (from $44,900 to $62,300), and
  • 59 percent for “other” master’s degrees[ii] (from $47,200 to $75,100).

Average loan balances for those who completed master of business education degrees were higher in 2015–16 than in 1999–2000 ($66,300 vs. $47,400), but did not show a clear trend during this period.

Between 1999–2000 and 2015–16, average student loan debt for doctorate degree completers increased by:

  • 97 percent for medical doctorates (from $124,700 to $246,000),
  • 75 percent for other health science doctorates[iii] (from $115,500 to $202,400),
  • 77 percent for law degrees (from $82,400 to $145,500),
  • 104 percent for Ph.D.’s outside the field of education (from $48,400 to $98,800), and
  • 105 percent for “other (non-Ph.D.) doctorates[iv] (from $64,500 to $132,200).

While 1999–2000 data were unavailable for education doctorate completers, the average balance in 2015–16 ($111,900) was 66 percent higher than the average loan balance for education doctorate completers in 2003–04 ($67,300).

For more information, check out the full analysis in the Condition of Education 2018.


By Joel McFarland


[i] The average balances in this analysis exclude students with no student loans.

[ii] Includes public administration or policy, social work, fine arts, public health, and other.

[iii] Includes chiropractic, dentistry, optometry, pharmacy, podiatry, and veterinary medicine.

[iv] Includes science or engineering, psychology, business or public administration, fine arts, theology, and other.