NCES Blog

National Center for Education Statistics

CTE Statistics: New Information on How Adults Prepare for Work

By Lisa Hudson

Education provides students with the knowledge and skills needed to be informed citizens, productive workers, and responsible community members. Meeting one of these goals—preparing students for work—is the main goal of career and technical education (CTE, formerly known as vocational education). To monitor CTE in the United States, the National Center for Education Statistics (NCES) produces a comprehensive set of statistical data on CTE at the secondary and postsecondary levels, as well as on adult preparation for work. These statistics, and related reports, are available on the CTE Statistics website.

NCES recently released data related to preparation for work, which was collected as part of the 2016 Adult Education and Training Survey (ATES).  The ATES asked a nationally-representative sample of adults about their attainment of two often-overlooked work credentials—licenses and certifications—and about their completion of work experience programs (such as internships and apprenticeships).  The survey also examined the role of education in helping adults attain these credentials and complete these programs.

The data show that 21 percent of adults have a currently active license or certification, with 18 percent reporting they have a license and 6 percent reporting they have a certification (some adults have both). Additionally, completion of degree programs is related to the attainment of these work credentials. For example, having a certification or license is more common among adults who have a college degree than among adults with lower levels of education (see figure).  In addition, about two-thirds of the adults who have completed a certification or licensing program (67 percent) did so in conjunction with coursetaking after high school.


Findings are similar for work experience programs. Overall, 21 percent of adults have completed a work experience program, and 14 percent of adults have completed a work experience program that was part of an educational program after high school.

Finally, the ATES showed that work credentials and work experience programs are particularly common in the health care field. In fact, health care was the most common field in which both licenses and certifications were held (31 percent of credentialed adults), and the most common field in which adults had completed a work experience program (26 percent of program completers) .

The information discussed in this blog is drawn from the ATES “First Look” report. The CTE Statistics website also includes a summary of these key findings, and within the next year additional ATES statistics will be added to the website.  To sign up for automatic email notifications on when new material is added to the CTE Statistics website, visit the IES newsflash (under National Center for Education Statistics, check the box for “Adult and Career Education”).  We look forward to sharing future results with you!

Where Are They Now? Following up with High School Ninth-Graders Seven Years Later

By Lauren Musu-Gillette and Elise Christopher

Seventy-two percent of all fall 2009 ninth-graders had enrolled in postsecondary education by February 2016, about 3 years after most students had completed high school. Among these students who enrolled in postsecondary education, the majority (82 percent) had enrolled within 4 months of leaving high school. These findings come from the most recent wave
of the High School Longitudinal Study of 2009 (HSLS:09). HSLS:09 follows a nationally representative sample of students who were ninth-graders in fall 2009 from the beginning of high school into higher education and the workforce. 

Among all 2009 ninth-graders who had enrolled in postsecondary education by February 2016, about 36 percent first enrolled at a public 2-year college, 41 percent at a public 4-year college, 16 percent at a private nonprofit 4-year college, and the remainder (7 percent) attended a for-profit or other type of institution.

A higher percentage of females (77 percent) than males (68 percent) had enrolled in any postsecondary education by February 2016. Additionally, a higher percentage of Asian students (88 percent) had enrolled in postsecondary education than students of all other racial/ethnic groups shown. The percentage of enrollees was also higher for White students (76 percent) than for Black students (65 percent), Hispanic students (68 percent), and students of Other or Two or more races (69 percent).


Percentage of fall 2009 ninth-graders enrolled in postsecondary education as of February 2016, by race/ethnicity: 2016

NOTE: Race categories exclude persons of Hispanic ethnicity.
SOURCE: U.S. Department of Education, National Center for Education Statistics, High School Longitudinal Study of 2009 (HSLS:09) Second Follow-Up: A First Look at Fall 2009 Ninth-Graders in 2016.


Twenty-two percent of fall 2009 ninth-graders who had enrolled in postsecondary education after high school had not attained a postsecondary credential but were no longer enrolled as of February 2016. When asked to select one or more reasons for leaving postsecondary education without earning a credential, 48 percent selected personal or family reasons, 40 percent picked financial reasons, 24 percent chose academic reasons, 22 percent chose work-related reasons, and 9 percent chose none of these.

The data collected in this 2016 follow-up collection allow researchers to examine an array of outcomes among fall 2009 ninth-graders, including delayed high school completion, postsecondary enrollment, early postsecondary persistence and attainment, labor market experiences, family formation, and family financial support. Analyses of these outcomes can capitalize on data already gathered about the students in fall 2009, in spring 2012 (when most were 11th-graders), and in summer and fall 2013 (when most had completed high school). HSLS:09 is also collecting students’ postsecondary financial aid records and postsecondary transcripts in 2017 and 2018. A First Look report and data from these documents are scheduled for release in 2019.

Data for the second follow-up are available in several formats. Restricted-use data are currently available for analysis using the PowerStats and QuickStats tools in the DataLab suite. Public-use microdata are available for download via the Online Codebook

National Spending for Public Schools Increases for Second Consecutive Year in School Year 2014-15

By Stephen Q. Cornman and Lauren Musu-Gillette, NCES; Lei Zhou, Activate Research; and Malia Howell, U.S. Census Bureau

Nationally, spending on elementary and secondary education increased in school year 2014–15 (Fiscal Year 2015). This is the second consecutive year spending has increased, reversing a decline in spending for the prior four years after adjusting for inflation. These findings come from a recently released report from the National Center for Education Statistics (NCES).

The First Look report, Revenues and Expenditures for Public Elementary and Secondary Education: School Year 2014–15 (Fiscal Year 2015) is based on data from the National Public Education Finance Survey (NPEFS), a component of the Common Core of Data (CCD).

The amount spent per student for the day-to-day operation of public elementary and secondary schools rose to $11,454 in Fiscal Year (FY) 15.[1] Current expenditures per student increased by 2.8 percent between FY 14 and 15, following an increase of 1.2 percent from the prior year, after adjusting for inflation.[2]  Despite these recent increases, spending per student decreased each year from FY 09 to FY 13 and the FY 15 amount spent per student was lower than the amounts spent in FY 08, FY 09, and FY 10.


NOTE: Spending is reported in constant FY 15 dollars, based on the Consumer Price Index (CPI).
SOURCE: U.S. Department of Education, National Center for Education Statistics, Common Core of Data (CCD), "National Public Education Financial Survey," fiscal years 2006 through 2015.


At the state level, spending on current expenditures per student ranged from a low of $6,751 in Utah to a high of $20,744 in New York. In addition to New York, current expenditures per student were at least 40 percent higher than the national average in the following states and jurisdictions:

  • District of Columbia ($20,610);
  • Alaska ($20,191);
  • Connecticut ($19,020);
  • New Jersey ($18,838);
  • Vermont ($18,769);
  • Massachusetts ($16,566);
  • and Wyoming ($16,047).

Current expenditures per student for public elementary and secondary education, by state: Fiscal year 2015 

SOURCE: U.S. Department of Education, National Center for Education Statistics, Common Core of Data (CCD), "National Public Education Financial Survey," fiscal year 2015.


Between FY 14 and FY 15, current expenditures per student increased by 3 percent or more in 12 states, and by 1 to less than 3 percent in 23 states. Increases in current expenditures per student from FY 14 to FY 15 were highest in Alaska (8.6 percent), California (7.3 percent), Texas (4.8 percent), Illinois (4.7 percent), and Maine (4.6 percent).


NOTE: Spending is reported in constant FY 15 dollars, based on the Consumer Price Index (CPI).
SOURCE: U.S. Department of Education, National Center for Education Statistics, Common Core of Data (CCD), "National Public Education Financial Survey," fiscal years 2013 through 2015. 


The recently released report also presents national and state data on public school funding by source.[3] Total funding increased by 3.3 percent (from $628.2 to $648.6 billion) from FY 14 to FY 15, which primarily reflected funding increases at the local and state levels. Local funding increased by 3.3 percent (from $282.5 to $292.0 billion), state funding increased by 3.7 percent (from $290.7 to $301.6 billion), and federal funding remained about level with an increase of 0.2 percent (from $54.9 to $55.0 billion).


SOURCE: U.S. Department of Education, National Center for Education Statistics, Common Core of Data (CCD), "National Public Education Financial Survey," fiscal years 2006 through 2015. 


The percentage of total funding from federal sources accounted for approximately 9 percent of total funding in both FY 06 and FY 15; however, there were notable fluctuations during this period. The federal percentage increased from 8.2 percent of funding in FY 08 to 12.5 percent of funding in FY 11. In part, this increase reflects the impact of the American Recovery and Reinvestment Act (ARRA). As the funds from the program were spent, the federal percentage decreased from 10.2 percent of total funding in FY 12 to 8.5 percent in FY 15.

Local sources accounted for 45.0 percent of total funding in FY 15, and have been relatively stable over the past 10 years. The percentage of total funding from state sources decreased from a high of 48.3 percent in FY 08 to 43.4 percent in FY 10, and has since increased to 46.5 percent in FY 15.


[1] Spending refers to current expenditures. Current expenditures are comprised of expenditures for the day-to-day operation of schools and school districts for public elementary and secondary education, including expenditures for staff salaries and benefits, supplies, and purchased services. Current expenditures include instruction, instruction-related, support services (e.g., social work, health, and psychological services), and other elementary/secondary current expenditures, but exclude expenditures on capital outlay, other programs, and interest on long-term debt. 

[2] In order to compare spending from one year to the next, expenditures are converted to constant dollars, which adjusts figures for inflation.

[3] Funding refers to revenues. Revenues are comprised of all funds received from external sources, net of refunds, and correcting transactions. Noncash transactions, such as receipt of services, commodities, or other receipts in kind are excluded, as are funds received from the issuance of debt, liquidation of investments, and nonroutine sale of property.


Differences in Postsecondary Persistence by Student and School Characteristics

By Cris de Brey

About 70 percent of first-time postsecondary students who started at 2-year or 4-year colleges in 2011-12 were either still enrolled or had attained a degree or certificate three years later. But a recent spotlight in the Condition of Education shows that there are differences in postsecondary persistence based on the type of institution attended and student demographics. 

Given the economic and employment benefits of postsecondary education, it’s important that students who enroll in postsecondary education persist to degree completion. Persistent students are those that were enrolled at any institution or had attained a degree or certificate 3 years after first enrolling. The spotlight uses data from the Beginning Postsecondary Students Longitudinal Study and focuses on differences in persistence rates by demographic and college or university characteristics.

In spring 2014, the persistence rate for students who began at 2-year institutions in 2011–12 was 23 percentage points lower than for students who began at 4-year institutions (see Figure 1).


Figure 1. Persistence rates of first-time postsecondary students who began at 2- and 4-year institutions during the 2011–12 academic year, by race/ethnicity: Spring 2014

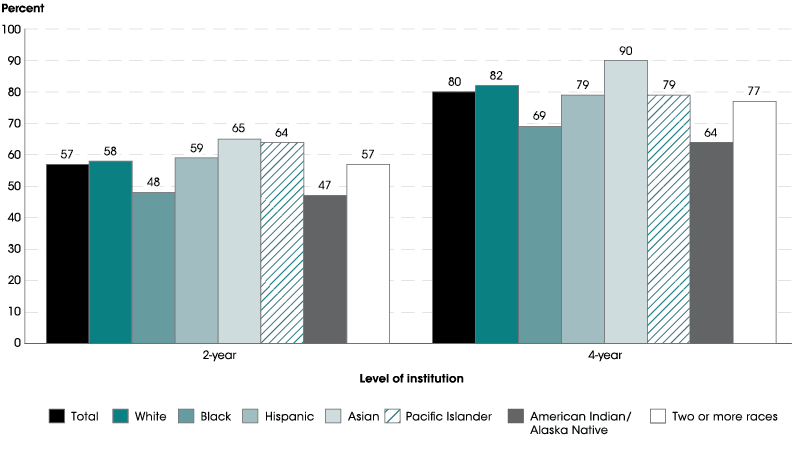
NOTE: Race categories exclude persons of Hispanic ethnicity. Students who first enrolled during the 2011–12 academic year are considered to have persisted if they were enrolled at any institution in Spring 2014 or had attained a degree or certificate by that time.
SOURCE: U.S. Department of Education, National Center for Education Statistics, 2012/14 Beginning Postsecondary Students Longitudinal Study (BPS:12/14). See Digest of Education Statistics 2016, table 326.50.


A gap between persistence rates at 2- and 4-year institutions was also observed for students who were White, Black, Hispanic, Asian, and of Two or more races. The difference in persistence rates between students who began at 2- and 4-year institutions ranged from 19 percentage points for Hispanic students to 25 percentage points for White students and Asian students.

Among students who began at 4-year institutions, Asian students had a higher persistence rate as of spring 2014 than White students. Both Asian and White students had a higher persistence rate than Hispanic, Black, and American Indian/Alaska Native students.

Looking at age differences, the persistence rate for students who were 19 years old or younger was higher than the rates for older students who began at both 2-year and 4-year institutions (see Figure 2).


Figure 2. Persistence rates of first-time postsecondary students who began at 2- and 4-year institutions during the 2011–12 academic year, by age when first enrolled: Spring 2014

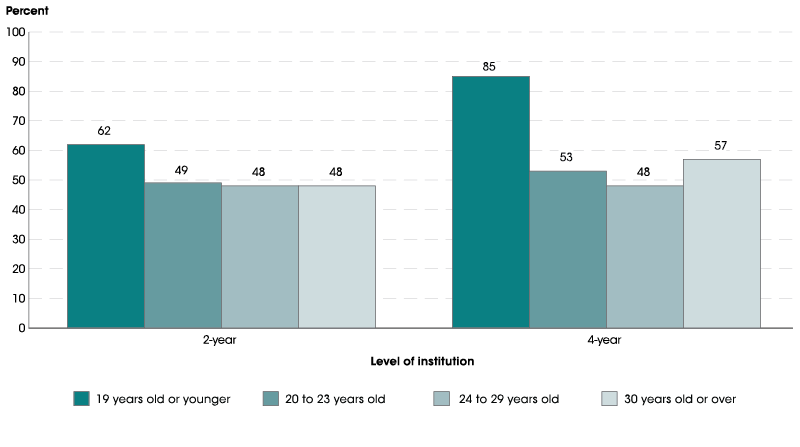
NOTE: Students who first enrolled during the 2011–12 academic year are considered to have persisted if they were enrolled at any institution in Spring 2014 or had attained a degree or certificate by that time.
SOURCE: U.S. Department of Education, National Center for Education Statistics, 2012/14 Beginning Postsecondary Students Longitudinal Study (BPS:12/14). See Digest of Education Statistics 2016, table 326.50.


There was no measurable difference between the persistence rates for the oldest three age groups who began at either type of institution.

The persistence rate for students 19 years old or younger who began at 2-year institutions was 24 percentage points lower than the rate for their same-aged peers who began at 4-year institutions. Unlike the youngest students, there were no measurable differences in persistence rates by level of institution for students who began their postsecondary education when they were 20 to 23 years old, 24 to 29 years old, and 30 years old or over.

For more information on postsecondary persistence rates, see the full spotlight on this topic in the Condition of Education. 

Expanding Student Success Rates to Reflect Today’s College Students

By Gigi Jones

Since the 1990s, the Integrated Postsecondary Education Data System (IPEDS) has collected and published graduation rates for colleges and universities around the country. These rates were based on traditional college students—first-time, full-time degree- or certificate-seeking undergraduate students (FTFT) who, generally, enrolled right after high school.

While these data are insightful, some have argued the FTFT graduation rate only provides a part of the picture because it doesn’t consider non-traditional students, including those who are part-time students and transfers. This is an important point because, over the past decade, the number of non-traditional students has outpaced the increase in traditional students, mostly driven by growth in those who have transferred schools.  

The new IPEDS Outcome Measures survey was designed to help answer these changes. Starting with the 2015-16 collection cycle, entering students at more than 4,000 degree-granting institutions must be reported in one of four buckets, also called cohorts (see Figure below).

The FTFT cohort is similar to what has been collected since the 1990s, but the Outcome Measures adds three new student groups to the equation: 

  • First-time, part-time students (FTPT), who attend less than a full-time credit workload each term (typically less than 12-credits) and who have no prior postsecondary attendance; 
  • Non-first-time students, also known as transfer-in students, who are enrolled at a full-time level (NFTFT); and
  • Non-first-time students, also known as transfer-in students, who are enrolled at a part-time level (NFTPT).

For these four cohorts, postsecondary institutions report the awards conferred at two points of time after the students entered the institution: 6 years and 8 years. If students did not receive an award, then institutions must report their enrollment status one of three ways: 1) Still enrolled at the same institution; 2) Transferred out of the institution; or 3) Enrollment status is unknown.

These changes help respond to those who feel that the FTFT graduation rates do not reflect the larger student population, in particular public 2-year colleges that serve a larger, non-traditional college student population. Since 2008, steps have been taken to construct and refine the data collection of non-traditional college students through a committee of higher education experts (PDF) and public Technical Review Panels (see summaries for panels 37, 40 and 45).

The 2016-17 preliminary Outcome Measures data were released on October 12, as part of a larger report on IPEDS winter data collection. The data for individual schools can be found on our College Navigator site.  The final data for 2015-16 will be released in early 2018. Sign up for the IES News Flash to be notified when the new data are released or follow IPEDS on Twitter. You can also visit the IPEDS Outcome Measures website for more information. 

While this is an important step in the process, we are continuing to improve the data collection process. Starting with the 2017-18 Outcome Measures collection, the survey includes more groups (i.e., Pell Grant v. Non-Pell Grant recipients), a third award status point (4-years after entry), and the identification of the type of award (i.e., certificates, Associate’s, and Bachelor’s). Watch for the release of these data in fall 2018. 

EDITOR'S NOTE: This post was updated on October 12 to reflect the release of Outcome Measures data.