NCES Blog

National Center for Education Statistics

New Education Data from the Household Pulse Survey

Recognizing the extraordinary information needs of policymakers during the coronavirus pandemic, NCES joined a partnership with the Census Bureau and four other federal statistical agencies to quickly develop a survey to gather key indicators of our nation’s response to the global pandemic. Thus, the experimental 2020 Household Pulse Survey began development on March 23, 2020, and data collection began on April 23, 2020. This new survey provides weekly national and state estimates, which are released to the public in tabular formats one week after the end of data collection.

The Household Pulse Survey gathers information from adults about employment status, spending patterns, food security, housing, physical and mental health, access to health care, and educational disruption. The education component includes questions about the following:

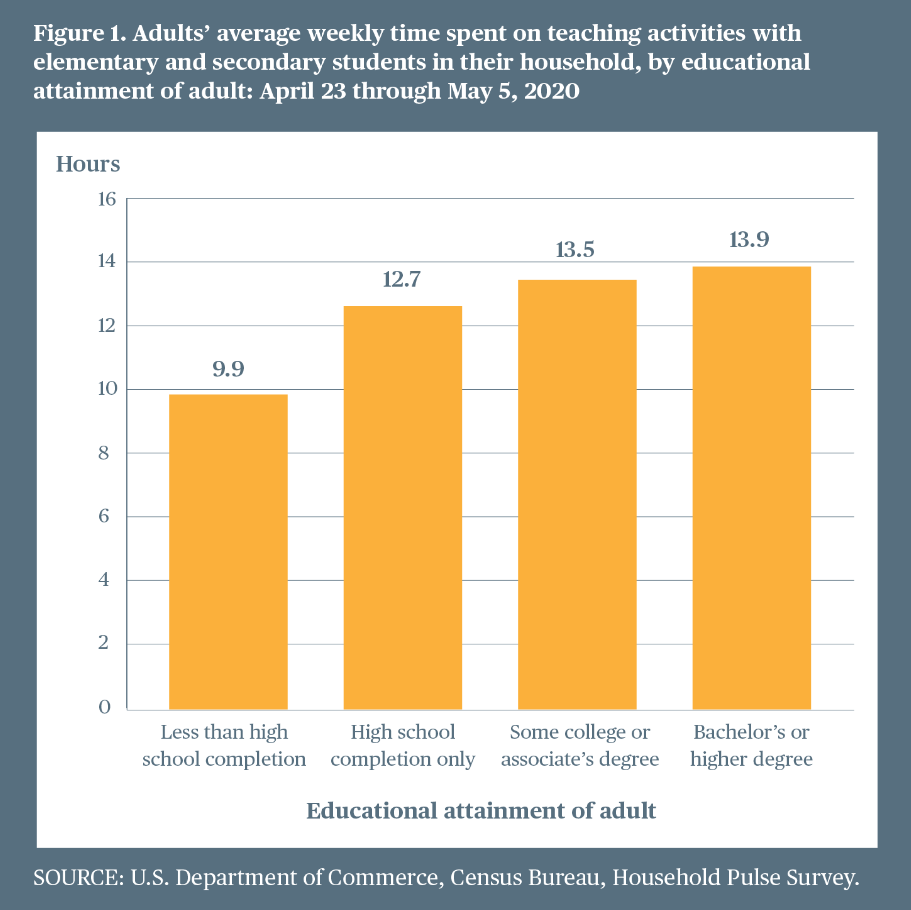
  • The weekly time spent on educational activities by students in public and private elementary and secondary schools
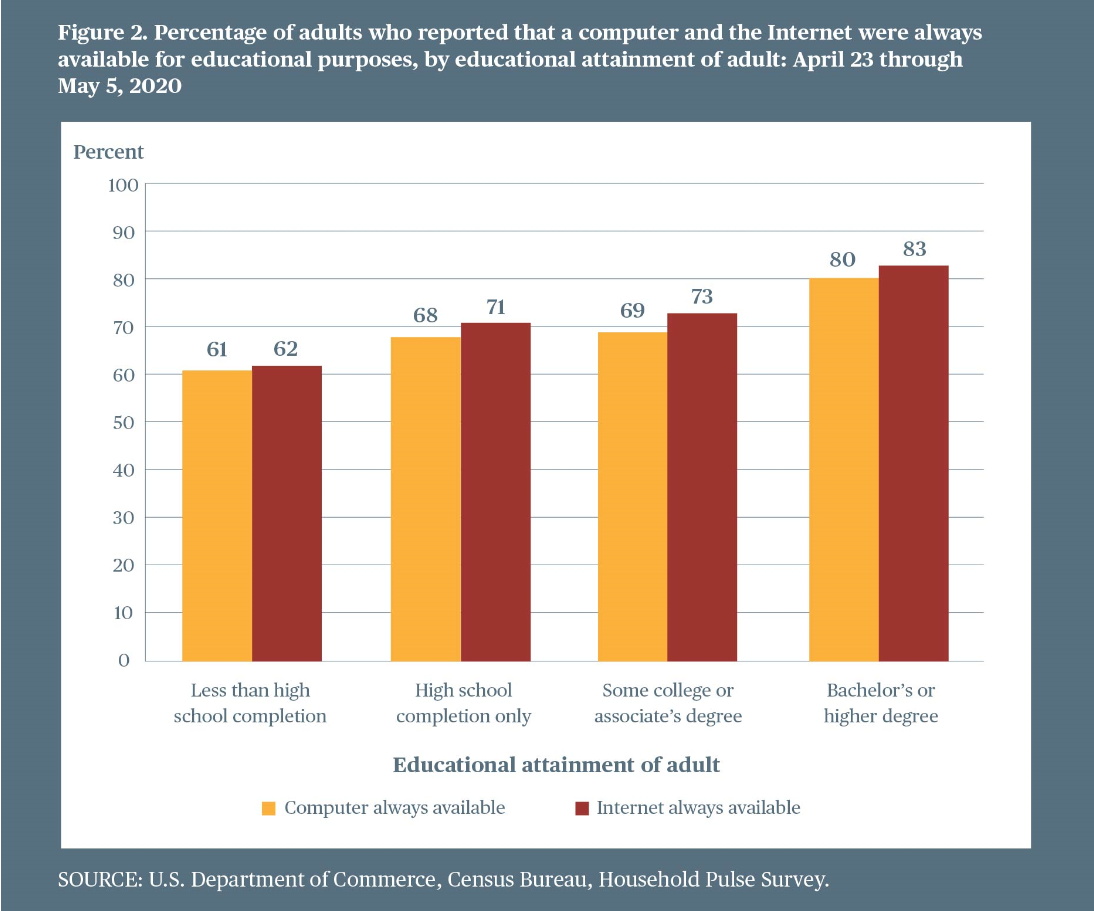
  • The availability of computer equipment and the Internet for instructional purposes
  • The extent to which computer equipment and the Internet for students were provided or subsidized

Since this survey is designed to represent adults 18 years old and over, the responses to the education questions concern students within the households of adults 18 years old and over, not the percentage of students themselves.

In the Household Pulse Survey during the weeks of April 23 through May 5, adults reported that their average weekly time spent on teaching activities with elementary and secondary students in their household was 13.1 hours. These results differed by educational attainment: adults who had not completed high school reported a weekly average of 9.9 hours in teaching activities with children, whereas adults with a bachelor’s or higher degree reported 13.9 hours (figure 1). In terms of the average weekly time spent on live virtual contact between students in their household and their teachers, adults reported a lower average of 4.1 hours.


Adults’ reports about the school instruction model need to be interpreted carefully because respondents could choose multiple types of approaches. A higher percentage of adults with a bachelor’s or higher degree (84 percent) reported that classes for elementary and secondary students in their household had moved to a format using online resources than did adults who had completed some college or an associate’s degree (74 percent), adults who had completed only high school (64 percent), or adults who had not completed high school (57 percent).

Higher percentages of adults with higher levels of education than of adults with lower levels of education reported that computers and the Internet were always available for educational purposes for elementary and secondary students in their households (figure 2).


The percentage of adults who reported that the school district provided a computer or digital device for children in their households to use at home for educational purposes was higher for adults who had not completed high school (44 percent) than for adults with a bachelor’s or higher degree (33 percent). Also, a higher percentage of adults who had not completed high school than of adults with higher levels of educational attainment reported financial assistance for student Internet access.

It is important to note that the speed of the survey development and the pace of the data collection efforts have led to policies and procedures for the experimental Household Pulse Survey that are not always consistent with traditional federal survey operations. Data should be interpreted with proper caution.  

More information on the Household Pulse Survey, detailed statistical tables, and microdata sets are available at https://www.census.gov/householdpulsedata. The Household Pulse Survey site includes breakouts of the data by other characteristics, such as race/ethnicity. In addition to participating in the development of this new survey, NCES has also generated new analyses based on existing data that respond to new needs for policy information, such as the availability of the Internet for student learning.


By Xiaolei Wang, AIR

NHES Data Files Provide Researchers Supplemental Information on Survey Respondents’ Communities

Increasingly, researchers are merging survey data with data from external sources, such as administrative data or different surveys, to enhance analyses. Combining data across sources increases the usefulness of the data while minimizing the burden on survey respondents.

In September, the National Household Education Surveys Program (NHES) released restricted-use supplemental geocode data files that use sample respondents’ addresses to integrate the 2016 NHES Parent and Family Involvement in Education (PFI), Early Childhood Program Participation (ECPP), and Adult Training and Education (ATES) survey data with data from other collections. The supplemental geocode files include additional geographic identifiers, characteristics of respondents’ neighborhoods and local labor markets, radius-based measures of household proximity to job search assistance and educational opportunities, and, for surveys focused on children, school district identifiers based on home addresses and school district characteristics.

The new data can complement researchers’ analyses of data from all three surveys. Researchers can expand their analyses of school choice and access to K–12 schooling options using the PFI survey data. Those interested in analyses of decisions about children’s early education can use the ECPP survey data to look at the availability of Head Start programs, preschools in private schools near children’s homes, and the prevalence of prekindergarten programs in local school districts. Researchers interested in nondegree credential attainment and training for work can use data from the ATES to find information on local labor markets and the number of American Job Centers near respondents’ homes.

The NHES:2016 restricted-use supplemental geocode files are available to restricted-use license holders to be used in conjunction with the NHES:2016 survey data files. To access the full set of NHES:2016 geocode supplemental restricted-use data files, apply for a restricted-use license. You can also browse the list of variables in the supplemental geocode files.


By Emily Isenberg and Sarah Grady, NCES

Bar Chart Race: Changing Demographics in Postsecondary Enrollment

Last month, we released a blog post showing the changes over time in public elementary and secondary school enrollment by race/ethnicity. Now, we’re taking a look at the changing demographics of postsecondary enrollment. The visuals below, which use data from an array of sources, depict the changes in fall enrollment of U.S. residents in degree-granting postsecondary institutions from 1976 to 2028 by race/ethnicity. It should be noted that the predicted enrollment does not take into account future impacts from the current coronavirus pandemic.


SOURCE: U.S. Department of Education, National Center for Education Statistics, Higher Education General Information Survey (HEGIS), “Fall Enrollment in Colleges and Universities” surveys, 1976 and 1980; Integrated Postsecondary Education Data System (IPEDS), “Fall Enrollment Survey” (IPEDS-EF:90-99); IPEDS Spring 2001 through Spring 2018, Fall Enrollment component; and Enrollment in Degree-Granting Institutions by Race/Ethnicity Projection Model, 1980 through 2028.


Here are some highlights from the data:

  • 1976: Of the 10.8 million U.S. residents enrolled in degree-granting postsecondary institutions, some 9.1 million, or 84 percent, identified as White. Lower percentages of postsecondary students identified as Black (10 percent), Hispanic (4 percent), Asian/Pacific Islander (2 percent), and American Indian/Alaska Native (1 percent).
  • 2002: The percentage of postsecondary enrollment made up of White students dropped below 70 percent.
  • 2003: Postsecondary enrollment of Black students surpassed 2.0 million for the first time in history.
  • 2006: About 17.2 million U.S. residents were enrolled in degree-granting postsecondary institutions, a 23 percent increase since 1996. Over this 10-year period, Hispanic and Black students had the largest increases (68 and 51 percent, respectively), compared with Asian/Pacific Islander, American Indian/Alaska Native, and White students (41, 32, and 13 percent, respectively). However, White students still accounted for 67 percent of total U.S. resident enrollment in 2006.
  • 2007: Postsecondary enrollment of Hispanic students surpassed 2.0 million for the first time in history.
  • 2010: U.S. resident enrollment in postsecondary degree-granting institutions peaked at 20.3 million.
  • 2012: Enrollment of Hispanic students surpassed enrollment of Black students, making Hispanic students the largest minority population enrolled in postsecondary education.
  • 2028: It is projected that enrollment of U.S. residents in postsecondary institutions will increase slightly between 2016 and 2028 (from 18.8 million to 18.9 million) but remain lower than the all-time high in 2010 (20.3 million). In 2028, it is projected that 52 percent of U.S. residents enrolled in postsecondary institutions will be White, 21 percent will be Hispanic, 15 percent will be Black, 7 percent will be Asian/Pacific Islander, 4 percent will be of Two or more races, and 1 percent will be American Indian/Alaska Native. The Census Bureau estimates that in 2030, roughly 56 percent of the population will identify as White, 14 percent as Black, 21 percent as Hispanic, 7 percent as Asian, and 4 percent as of Two or more races (https://www.census.gov/content/dam/Census/library/publications/2020/demo/p25-1144.pdf).


By Rachel Dinkes, AIR

NAEP Opens a Pathway to Exploring Student Problem Solving in Assessments

A newly released NCES First Look report, Response Process Data From the NAEP 2017 Grade 8 Mathematics Assessment (NCES 2020-068), introduces a new type of data—response process data—which was made available after the NAEP reading and math assessments transitioned from paper to digitally based assessments in 2017. These new datasets will allow researchers to go beyond analyzing students’ answers to questions as simply right or wrong; instead, researchers will be able to examine the amount of time students spend on questions, the pathways they take through the assessment sections, and the tools they use while solving problems. The new First Look report provides an overview of data that will be available when the restricted-use data files for the 2017 grade 8 mathematics response process data are released later this summer.

NAEP reporting has hinted previously at the promise of response process data. With the release of the 2017 mathematics assessment results, NCES included a feature on The Nation’s Report Card website to show the different steps students took while responding to a question that assessed their multiplication skills. The short video below shows that students used a total of 397 different sequences to group four digits into two factors that yield a given product. The most popular correct and incorrect answer paths are shown in the video. Response process data, such as those summarized in this example item, can open new avenues for understanding how students work through math problems and identifying more detailed elements of response processes that could lead to common math errors.


The First Look report describes the forthcoming data files that will enable researchers to access student response process data from two 30-minute blocks of grade 8 mathematics assessment questions (or a total of 29 test items) and a 15-minute survey questionnaire where students responded to questions about their demographic characteristics, opportunities to learn in and outside of school, and educational experiences. Researchers will be able to explore logs of the response process data collected from each student along with a file containing students’ raw responses and scored responses, time stamps, and demographics. In addition, researchers can explore a file that summarizes defined features of students’ interactions with the assessment, such as the number of seconds spent on specific questions or the number of times the calculator was opened across all students.

To explore this response process dataset, interested researchers should apply for a restricted-use license and request access to the files through the NCES website. By providing this dataset to a wide variety of researchers, NCES hopes to encourage and enable a new domain of research on developing best practices for the use and interpretation of student response process data.


By Jan Marie Alegre and Robert Finnegan, Educational Testing Service

Bar Chart Races: Changing Demographics in K–12 Public School Enrollment

Bar chart races are a useful tool to visualize long-term trend changes. The visuals below, which use data from an array of sources, depict the changes in U.S. public elementary and secondary school enrollment from 1995 to 2029 by race/ethnicity.


Source: U.S. Department of Education, National Center for Education Statistics, Common Core of Data (CCD), “State Nonfiscal Survey of Public Elementary and Secondary Education,” 1995–96 through 2017–18; and National Elementary and Secondary Enrollment by Race/Ethnicity Projection Model, 1972 through 2029.


Total enrollment in public elementary and secondary schools has grown since 1995, but it has not grown across all racial/ethnic groups. As such, racial/ethnic distributions of public school students across the country have shifted.

One major change in public school enrollment has been in the number of Hispanic students enrolled. Enrollment of Hispanic students has grown from 6.0 million in 1995 to 13.6 million in fall 2017 (the last year of data available). During that time period, Hispanic students went from making up 13.5 percent of public school enrollment to 26.8 percent of public school enrollment. NCES projects that Hispanic enrollment will continue to grow, reaching 14.0 million and 27.5 percent of public school enrollment by fall 2029.

While the number of Hispanic public school students has grown, the number of White public school students schools has steadily declined from 29.0 million in 1995 to 24.1 million in fall 2017. NCES projects that enrollment of White public school students will continue to decline, reaching 22.4 million by 2029. The percentage of public school students who were White was 64.8 percent in 1995, and this percentage dropped below 50 percent in 2014 (to 49.5 percent). NCES projects that in 2029, White students will make up 43.8 percent of public school enrollment.

The percentage of public school students who were Black decreased from 16.8 percent in 1995 to 15.2 percent in 2017 and is projected to remain at 15.2 percent in 2029. The number of Black public school students increased from 7.6 million in 1995 to a peak of 8.4 million in 2005 but is projected to decrease to 7.7 million by 2029. Between fall 2017 and fall 2029, the percentage of public school students who were Asian/Pacific Islander is projected to continue increasing (from 5.6 to 6.9 percent), as is the percentage who were of Two or more races (from 3.9 to 5.8 percent). American Indian/Alaska Native students account for about 1 percent of public elementary and secondary enrollment in all years.

For more information about this topic, see The Condition of Education indicator Racial/Ethnic Enrollment in Public Schools.


By Ke Wang and Rachel Dinkes, AIR