NCES Blog

National Center for Education Statistics

The “Where” of Going to College: Residence, Migration, and Fall Enrollment

Newly released provisional data from the Integrated Postsecondary Education Data System’s (IPEDS) Fall Enrollment (EF) survey provides an updated look at whether beginning college students are attending school in their home state or heading elsewhere.  

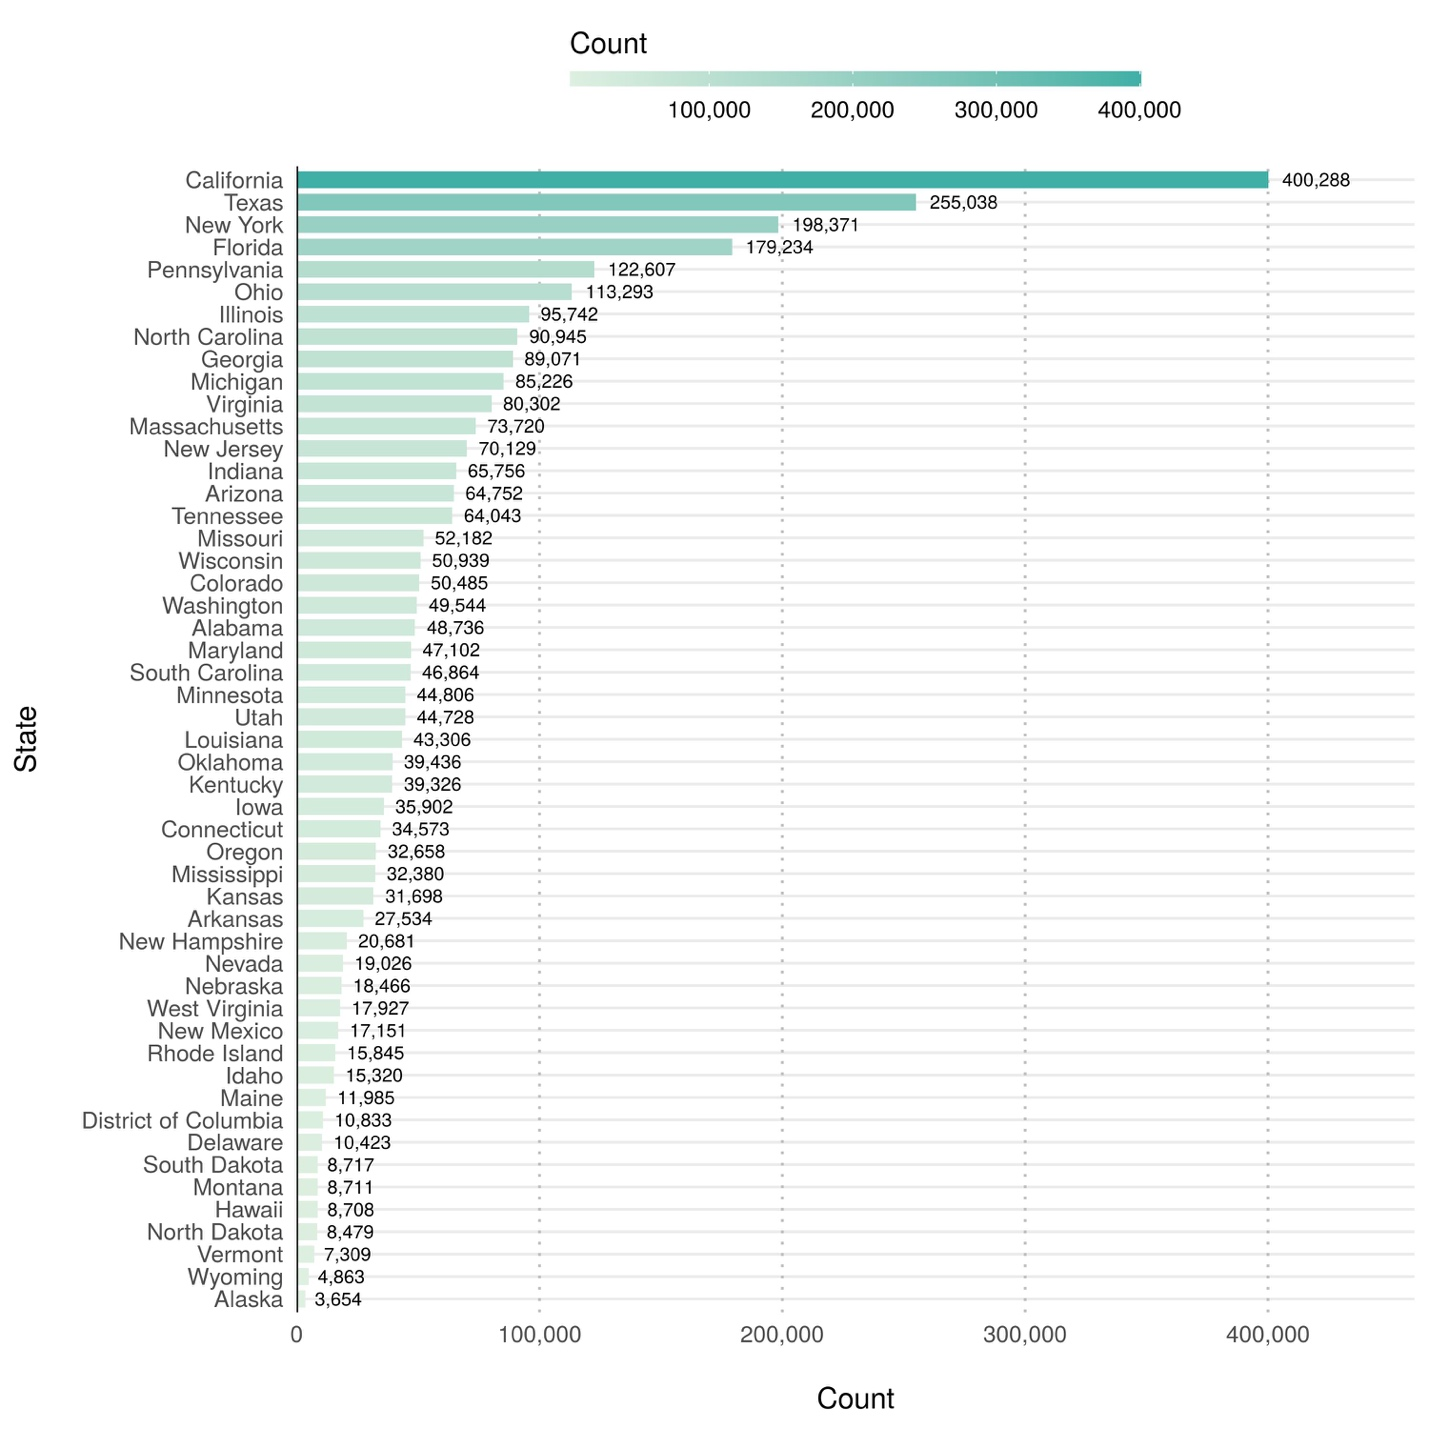
In fall 2018, the number of first-time degree/certificate-seeking students enrolled at Title IV postsecondary institutions (beginning college students) varied widely across states, ranging from 3,700 in Alaska to 400,300 in California (figure 1). College enrollment is strongly correlated with the number of postsecondary institutions within each state, as more populous and geographically large states have more institutional capacity to enroll more students. Most states (32 out of 50) and the District of Columbia enrolled fewer than 50,000 beginning college students in fall 2018 and only six states (California, Texas, New York, Florida, Pennsylvania, and Ohio) enrolled more than 100,000 beginning college students.


Figure 1. Number of first-time degree/certificate-seeking undergraduate students enrolled at Title IV institutions, by state or jurisdiction: Fall 2018SOURCE: U.S. Department of Education, National Center for Education Statistics, IPEDS, Spring 2019, Fall Enrollment component (provisional data).

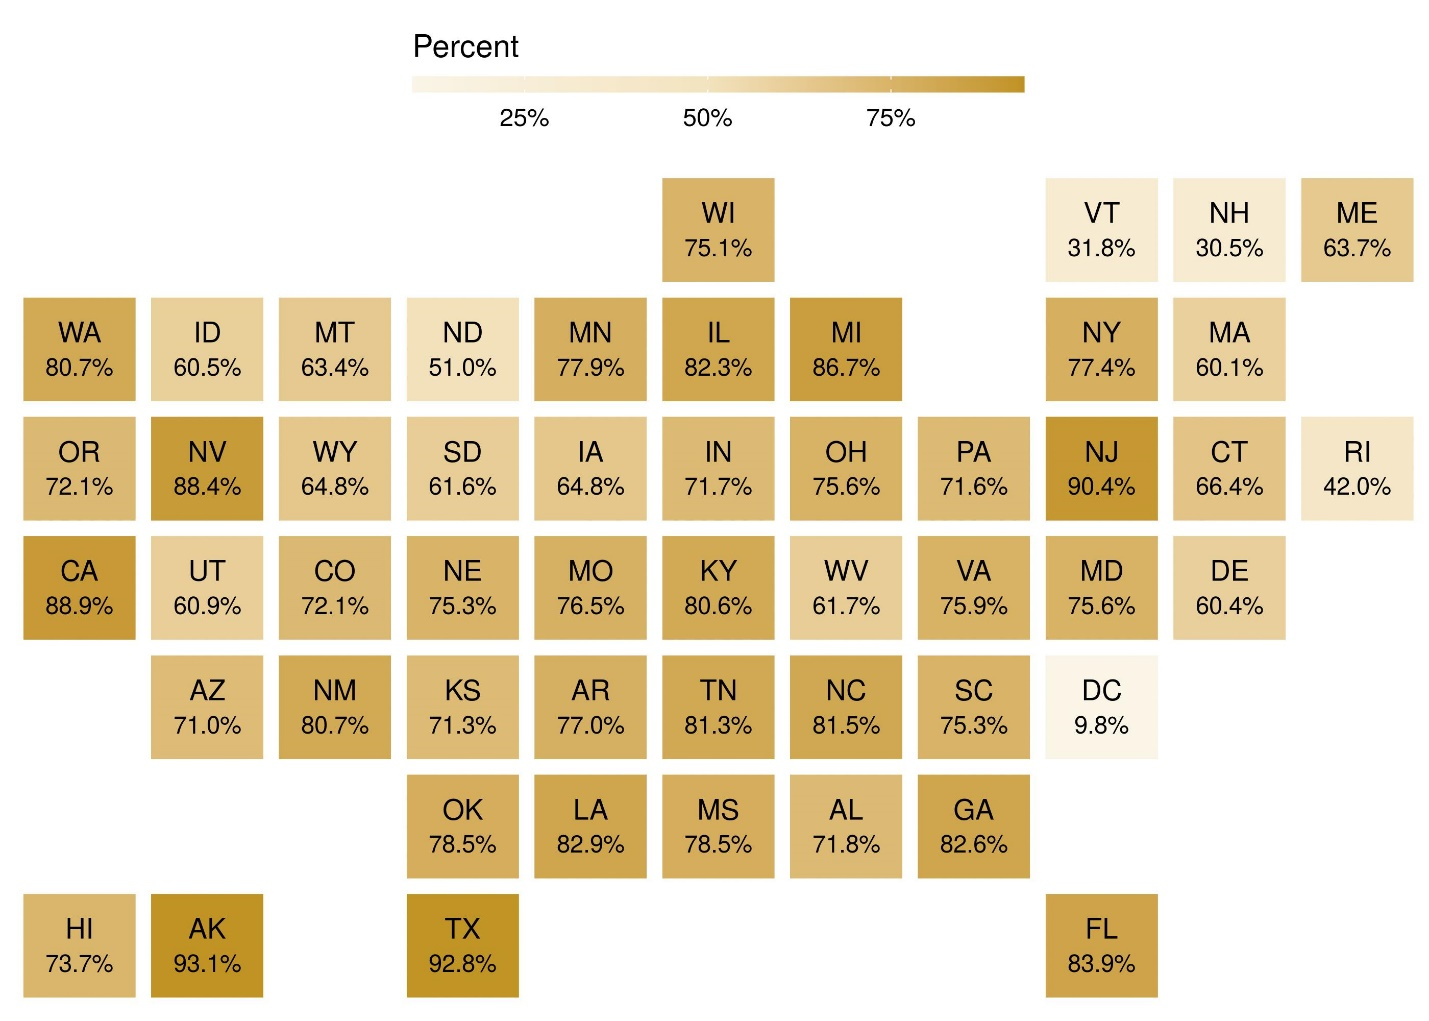
As a result of students migrating outside their home states to attend college, some postsecondary institutions enroll students who are not residents of the same state or jurisdiction in which it is located. Among beginning college students in fall 2018, the share of students who were residents of the same state varied widely, from 31 percent in New Hampshire to 93 percent in Texas and Alaska (figure 2). For a majority of states (27 out of 50), residents comprised at least 75 percent of total beginning college student enrollment. Only three states (Rhode Island, Vermont, and New Hampshire) and the District of Columbia enrolled more nonresidents than residents among their fall 2018 beginning college students.


Figure 2. Percent of first-time degree/certificate-seeking undergraduate students enrolled at Title IV institutions in the state or jurisdiction who are residents of the same state or jurisdiction: Fall 2018
SOURCE: U.S. Department of Education, National Center for Education Statistics, IPEDS, Spring 2019, Fall Enrollment component (provisional data).


States experience varying levels of out-migration (i.e., residents leaving the state to attend college) and in-migration (i.e., nonresidents coming into the state to attend college). For example, in fall 2018, California experienced the largest number of residents out-migrating to attend college in a different state (44,800) but gained 37,800 nonresidents in-migrating to attend college in the state, for an overall negative net migration of beginning college students (figure 3). In contrast, New York also experienced a large number of residents out-migrating for college (33,800) but gained 43,300 nonresidents, for an overall positive net migration of beginning college students.


Figure 3. Number of first-time degree/certificate-seeking undergraduate students at Title IV institutions who migrate into and out of the state or jurisdiction: Fall 2018
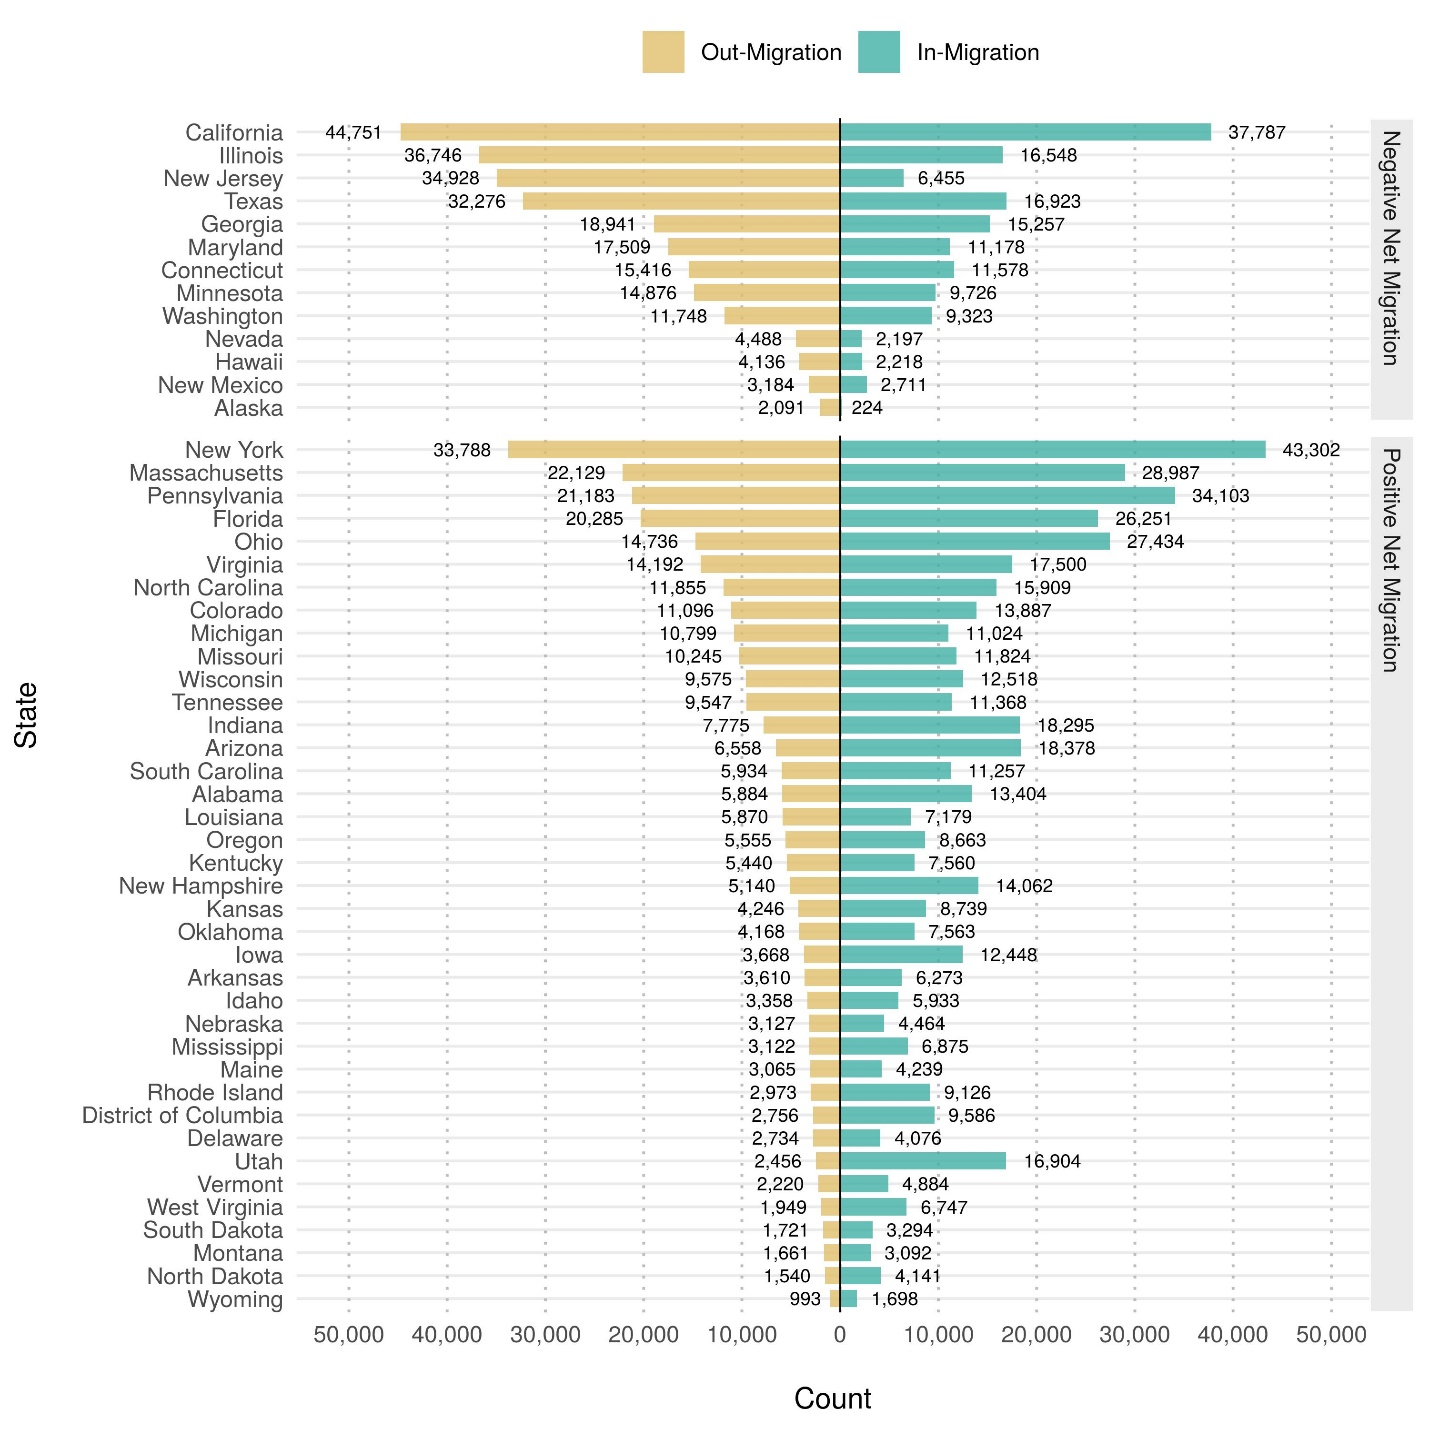
NOTE: The migration of students refers to students whose permanent address at the time of application to the institution is located in a different state or jurisdiction than the institution. Migration does not indicate a permanent change of address has occurred. Migration into the state or jurisdiction may include students who are nonresident aliens, who are from the other U.S. jurisdictions, or who reside outside the state or jurisdiction and are enrolled exclusively in online or distance education programs. Migration into the state or jurisdiction does not include individuals whose state or jurisdiction of residence is unknown.

SOURCE: U.S. Department of Education, National Center for Education Statistics, IPEDS, Spring 2019, Fall Enrollment component (provisional data).


Approximately three-quarters of states (37 out of 50) and the District of Columbia had a positive net migration of beginning college students in fall 2018 (figure 4). The remaining one-quarter of states (13 out of 50) had more residents out-migrate for college than nonresidents in-migrate for college, resulting in a negative net migration of beginning college students. Net migration varied widely by state, with New Jersey experiencing the largest negative net migration (28,500 students) and Utah experiencing the largest positive net migration (14,400 students).


Figure 4. Net migration of first-time degree/certificate-seeking undergraduate students at Title IV institutions, by state or jurisdiction: Fall 2018
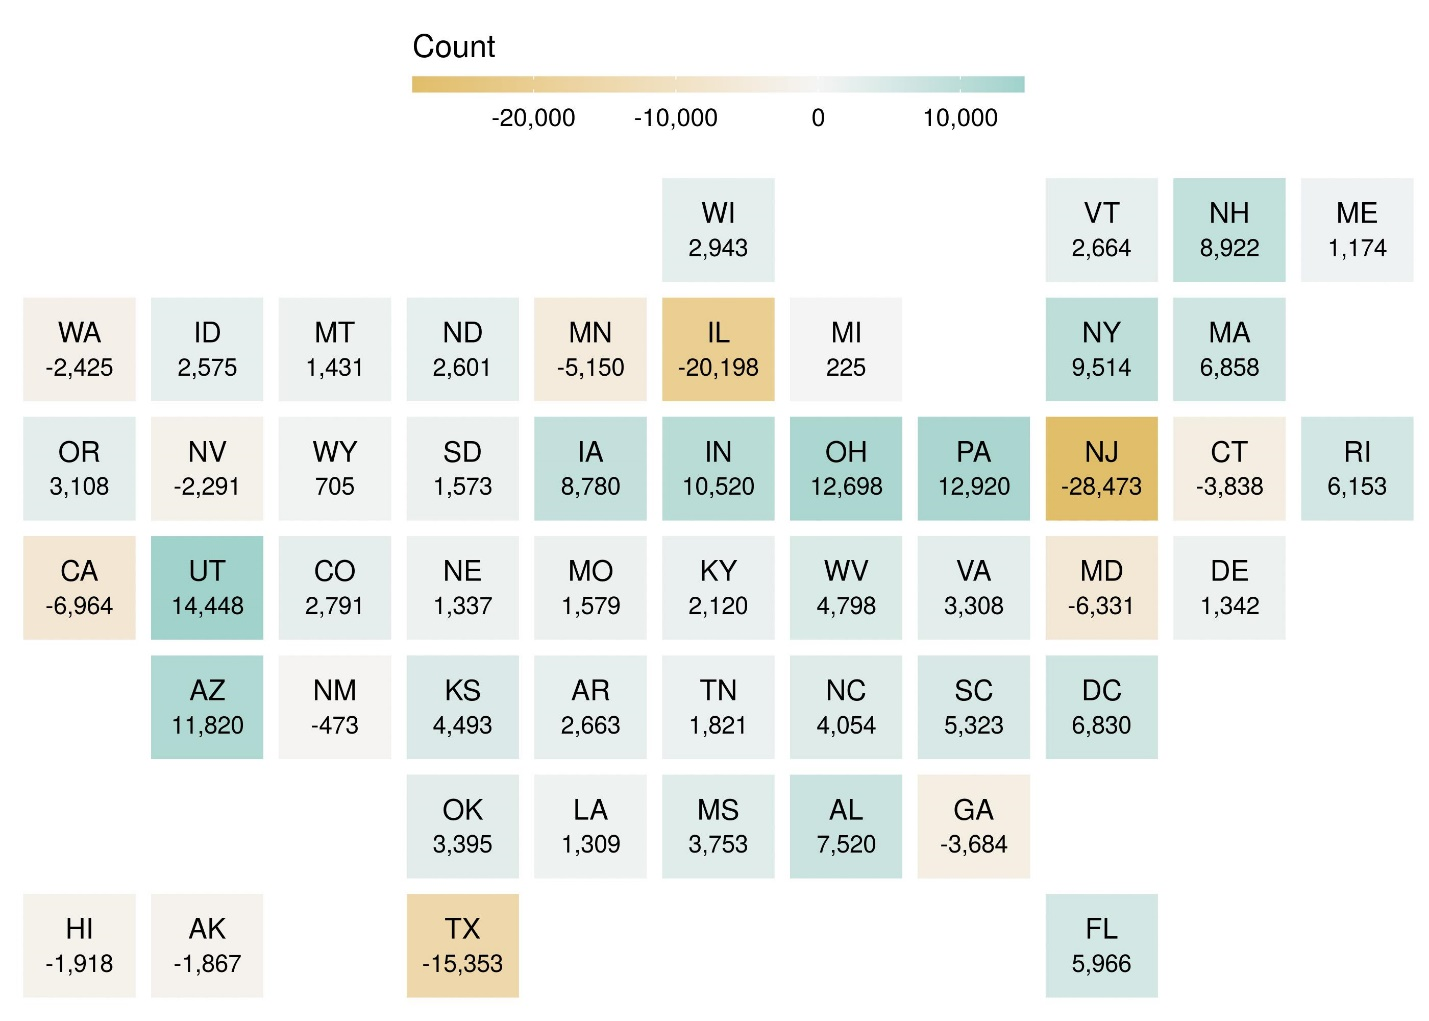
NOTE: Net migration is the difference between the number of students entering the state or jurisdiction to attend school (into) and the number of students (residents) who leave the state or jurisdiction to attend school elsewhere (out of). A positive net migration indicates more students coming into the state or jurisdiction than leaving to attend school elsewhere.

SOURCE: U.S. Department of Education, National Center for Education Statistics, IPEDS, Spring 2019, Fall Enrollment component (provisional data).


The newly released IPEDS Fall Enrollment data provide tremendous insights into the geographic mobility of beginning college students. Additional analyses on residence and migration can be conducted using the full IPEDS data files. For example, the data can identify to which states and types of institutions beginning college students out-migrate and, conversely, from which states postsecondary institutions recruit their incoming classes.


By Roman Ruiz, AIR

Announcing the Condition of Education 2020 Release

NCES is pleased to present The Condition of Education 2020, an annual report mandated by the U.S. Congress that summarizes the latest data on education in the United States. This report uses data from across the center and from other sources and is designed to help policymakers and the public monitor educational progress. This year’s report includes 47 indicators on topics ranging from prekindergarten through postsecondary education, as well as labor force outcomes and international comparisons.

The data show that 50.7 million students were enrolled in public elementary and secondary schools (prekindergarten through grade 12) and approximately 5.7 million students were enrolled in private elementary and secondary schools in fall 2017, the most recent year for which data were available. In school year 2017–18, some 85 percent of public high school students graduated on time with a regular diploma. This rate was similar to the previous year’s rate. About 2.2 million, or 69 percent, of those who completed high school in 2018, enrolled in college that fall. Meanwhile, the status dropout rate, or the percentage of 16- to 24-year-olds who were not enrolled in school and did not have a high school diploma or its equivalent, was 5.3 percent in 2018.

Total undergraduate enrollment in degree-granting postsecondary institutions in 2018 stood at 16.6 million students. The average net price of college for first-time, full-time undergraduates attending 4-year institutions was $13,700 at public institutions, $27,000 at private nonprofit institutions, and $22,100 at private for-profit institutions (in constant 2018–19 dollars). In the same year, institutions awarded 1.0 million associate’s degrees, 2.0 million bachelor’s degrees, 820,000 master’s degrees, and 184,000 doctor’s degrees.

Ninety-two percent of 25- to 34-year-olds in the United States had a high school diploma or its equivalent in 2018. In comparison, the average rate for the Organization for Economic Cooperation and Development (OECD) member countries was 85 percent. Some 49 percent of these individuals in the United States had obtained a postsecondary degree, compared with the OECD average of 44 percent. Similar to previous years, annual median earnings in 2018 were higher for 25- to 34-year-olds with higher levels of education. In 2018, U.S. 25- to 34-year-olds with a bachelor’s or higher degree earned 66 percent more than those with a high school diploma or equivalent.

The Condition of Education includes an Executive Summary, an At a Glance section, a Reader’s Guide, a Glossary, and a Guide to Sources, all of which provide additional background information. Each indicator includes references to the source data tables used to produce the indicator.

As new data are released throughout the year, indicators will be updated and made available on The Condition of Education website

In addition to publishing The Condition of Education, NCES produces a wide range of other reports and datasets designed to help inform policymakers and the public about significant trends and topics in education. More information about the latest activities and releases at NCES may be found on our website or at our social media sites on TwitterFacebook, and LinkedIn.


By James L. Woodworth, NCES Commissioner

New Data on Public and Private School Teacher Characteristics, Experiences, and Training

Teachers and principals have a critical impact on the education experience of students in the United States. The National Teacher and Principal Survey (NTPS) collects data from public and private school principals and teachers in order to better understand their characteristics and experiences. Using data collected during the 2017–18 school year, reports describing these findings for schools and principals were released in August 2019, and a new report about teachers was released in April 2020. During the 2015–16 school year, NTPS collected data about only public schools, principals, and teachers. The data collection for the 2017–18 school year included data about private schools, principals, and teachers as well.

Among the findings from the recently released teacher report are the following:

  • Race and ethnicity. Seventy-nine percent of all public school teachers in the 2017–18 school year were non-Hispanic White, 7 percent were non-Hispanic Black, and 9 percent were Hispanic. Among private school teachers, 85 percent were non-Hispanic White, 3 percent were non-Hispanic Black, and 7 percent were Hispanic.
     
  • Salary. Regular full-time teachers in public schools had a higher average base salary ($57,900) than regular full-time teachers in private schools ($45,300) in the 2017–18 school year.
     
  • Work outside of school. In the 2017–18 school year, 18 percent of public school teachers and 21 percent of private school teachers held jobs outside their school system during the school year.
     
  • Evaluation. In the 2017–18 school year, 78 percent of public school teachers and 69 percent of private school teachers were evaluated during the last school year.
     
    • ​Among teachers who were evaluated, higher percentages of private school teachers than public school teachers agreed with statements about the positive impact of evaluations on their teaching. Eighty-three percent of private school teachers agreed that the evaluation process helped them determine their success with students, 84 percent agreed that the evaluation process positively affected their teaching, and 81 percent agreed that the evaluation process led to improved student learning (figure 1). Comparable estimates for public school teachers were 72 percent, 73 percent, and 69 percent, respectively.


Figure 1. Percentage of teachers who agreed with different statements about the positive impact of evaluations, by school type: 2017–18


More information about these and other topics (including teachers’ years of experience, class size, and professional development) are available in the full report.

NTPS is a nationally representative survey of teachers and principals from public and private schools. For the public sector (but not the private sector), NTPS includes state representative data as well. NTPS uses scientifically proven methods to select a small sample of school faculty to provide information about major education issues related to school and staffing characteristics while minimizing the burden on teacher and principal communities. Without the cooperation and participation of districts and their teachers and principals, reports such as these could not be produced.

Data files for the 2017–18 NTPS will be released later this year. In order to protect the identities of respondents, researchers must apply for a restricted-use license to access the full restricted-use data files. Data will also be available through NCES’s online data tool, DataLab, where users can create custom tables and regressions without a restricted-use license.


By Maura Spiegelman, NCES

Bar Chart Race: States With the Highest Public School Enrollment

Recently, bar chart races have become a useful tool to visualize long-term trend changes. The visual below, which uses data from an array of sources, depicts the changes in U.S. public school enrollment from 1870 to 2020 by region: Northeast (green), South (orange), Midwest (light blue), and West (dark blue). Since 1870, states’ populations and public school enrollment have increased, with differential growth across the country.


Source: Report of the Commissioner of Education (1870–71, 1879–80, 1989–90, 1899–1900, and 1909–10); the Biennial Survey of Education in the United States (1919–20, 1929–30, 1939–40, and 1949–50); and the Statistics of State School Systems (1959–60). The intervening earlier years for these decades are estimated by NCES for the purposes of this visual, as are data from 1960 to 1964. Data for 1965 to 1984 are from the Statistics of Public Elementary and Secondary Day Schools. Data for 1985 and later years are from the Common Core of Data and Projections.


Here are some highlights from the data:

  • 1870: All of the top 10 states for public school enrollment—including the top 3 states of New York, Pennsylvania, and Ohio—were in the Northeast and Midwest. No states from the South or West were in the top 10 at this time.
  • 1879: A state in the South—Tennessee—entered the top 10 for the first time.
  • 1884: Texas first entered the top 10 and, as of 2020, has never left the top 10.
  • 1891: Illinois displaced Ohio as the state with the third-highest public school enrollment.
  • 1916: A state in the West—California—entered the top 10 for the first time and, as of 2020, California has never left the top 10.
  • 1935: Texas displaced Illinois as the state with the third-highest public school enrollment. New York and Pennsylvania still remained the two states with the highest public school enrollments.
  • 1942: California displaced Texas as the state with the third-highest public school enrollment. In 1947, California displaced Pennsylvania as the state with the second-highest public school enrollment. In 1953, California overtook New York and became the state with the highest public school enrollment.
  • 1959: Florida entered the top 10 for the first time and was in the top 4 by 1990.
  • 1980: Texas displaced New York as the state with the second-highest public school enrollment.
  • 2014: Florida displaced New York as the state with the third-highest public school enrollment.

Projections indicate that the 10 states with the highest public school enrollment in fall 2020 will be California (6.3 million), Texas (5.5 million), Florida (2.9 million), New York (2.7 million), Illinois (2.0 million), Georgia (1.8 million), Pennsylvania (1.7 million), Ohio (1.7 million), North Carolina (1.6 million), and Michigan (1.5 million).


By Rachel Dinkes, AIR

The Prevalence of Written Plans for a Pandemic Disease Scenario in Public Schools

The coronavirus pandemic has impacted our daily lives in unprecedented ways and raised questions about how prepared our institutions, including our public schools, are for a national health crisis. The School Survey on Crime and Safety (SSOCS), which collects data from a nationally representative sample of 4,800 K–12 public schools, asks schools to report on whether or not they have a written plan that describes the procedures to be performed in select scenarios. Data from the 2017–18 SSOCS show a strong majority of the nation’s schools have a written plan for certain emergency scenarios, such as natural disasters, active shooters, and bomb threats, but fewer than half have a written plan for a pandemic disease.

Schools can play an important role in slowing the spread of diseases and protecting vulnerable students and staff, in part by implementing strategies to help ensure safe and healthy learning environments.[1] The close proximity of students and staff in classroom settings can increase the risk of community transmission of diseases, which is why schools should work in close collaboration and coordination with local health departments on decisions related to determining risks and implementing school-based strategies. One aspect of school efforts to maintain safety is to have a plan in place for procedures to prevent and mitigate the spread of diseases. These plans may include guidelines on prevention efforts; coordination with local health officials; cleaning and disinfecting school spaces; communicating with staff, parents, and students; making decisions on short- and long-term dismissal of students; and implementing strategies to continue education and other supports for students.

Forty-six percent of public schools reported they had a written plan for procedures to be performed in the event of pandemic disease during the 2017–18 school year (figure 1). This percentage was lower than the percentage of schools reporting that they had written plans for every other type of scenario asked about in the SSOCS questionnaire with the exception of hostage scenarios, for which the percentage of schools with such a plan was not measurably different.


Figure 1. Percentage of public schools that had a written plan describing procedures to be performed in various crisis scenarios: School year 2017–18

1Examples of natural disasters provided to respondents were earthquakes or tornadoes.
2"Active shooter" was defined for respondents as an individual actively engaged in killing or attempting to kill people in a confined and populated area; in most cases, active shooters use firearm(s) and there is no pattern or method to their selection of victims.
3Examples of chemical, biological, or radiological threats or incidents provided to respondents were the release of mustard gas, anthrax, smallpox, or radioactive materials.
NOTE: Responses were provided by the principal or the person most knowledgeable about school crime and policies to provide a safe environment.
SOURCE: U.S. Department of Education, National Center for Education Statistics, 2017–18 School Survey on Crime and Safety (SSOCS), 2018.


There were few measurable differences in the percentages of schools reporting plans for pandemic disease when looking across school characteristics. However, some differences were observed based on the enrollment size of the school. In 2017–18, the percentage of schools with enrollments of less than 300 students that reported having a written plan for pandemic disease (38 percent) was lower than the corresponding percentages of schools with enrollments of 300 to 499 students (48 percent), 500 to 999 students (48 percent), and 1,000 or more students (49 percent) (figure 2). However, in no enrollment size group did a majority of schools have a written plan.


Figure 2. Percentage of public schools that had a written plan describing procedures to be performed in a pandemic disease scenario, by enrollment size: School year 2017–18

NOTE: Responses were provided by the principal or the person most knowledgeable about school crime and policies to provide a safe environment.
SOURCE: U.S. Department of Education, National Center for Education Statistics, 2017–18 School Survey on Crime and Safety (SSOCS), 2018.


Prior to the 2017–18 school year, SSOCS asked schools about written plans for pandemic flu, rather than pandemic disease. While comparisons of these prior estimates to the 2017–18 estimates on pandemic disease plans should be made with caution, reviewing previous estimates for pandemic flu plans may provide some insight into how schools may have been prepared for similar outbreaks in the past.

Estimates of schools’ reports of written plans for pandemic flu followed no clear pattern between the 2007–08 and 2015–16 school years. Fifty-one percent of schools reported having a plan for pandemic flu in 2015–16, which was lower than the percentage that reported such a plan in 2009–10 (69 percent)[2] but higher than the percentage that reported such plan in 2007–08 (36 percent) (figure 3).


Figure 3. Percentage of public schools that had a written plan describing procedures to be performed in a pandemic flu or pandemic disease scenario, by school year: Selected years, 2007–08 to 2017–18

NOTE: SSOCS:2008, SSOCS:2010, and SSOCS:2016 asked schools to report on whether or not their school had a written plan to be performed in the scenario of pandemic flu, while the item was modified for SSOCS:2018 to ask schools about written plans for pandemic disease. Due to this change, comparisons of estimates between SSOCS:2018 and earlier years should be made with caution. Responses were provided by the principal or the person most knowledgeable about school crime and policies to provide a safe environment.
SOURCE: U.S. Department of Education, National Center for Education Statistics, 2017–18 School Survey on Crime and Safety (SSOCS), 2018.


You can find more information on these and other data from the School Survey on Crime and Safety in NCES publications, including Crime, Violence, Discipline, and Safety in U.S. Public Schools: Findings From the School Survey on Crime and Safety: 2017–18 and the Digest of Education Statistics, table 233.65.


By Jana Kemp, AIR


[1]Centers for Disease Control (CDC) Interim Guidance for Administrators of US K–12 Schools and Childcare Programs. Retrieved March 18, 2020, from https://www.cdc.gov/coronavirus/2019-ncov/community/schools-childcare/guidance-for-schools.html.

[2]From April 2009 to April 2010, a novel influenza A (H1N1) virus pandemic occurred in the United States and across the world; schools’ reports of plans for pandemic flu during the 2009–10 school year may reflect heightened awareness and responses to the H1N1 pandemic. See https://www.cdc.gov/flu/pandemic-resources/2009-h1n1-pandemic.html for more information.