NCES Blog

National Center for Education Statistics

New Data Show Growth in Online Bullying

A vast majority of middle and high school students have an online presence, resulting in heightened awareness and concern about cyberbullying. A new report from the National Center for Education Statistics (NCES) shows that reports of students being bullied online or by text are growing.

According to results from Student Reports of Bullying: Results From the 2017 School Crime Supplement to the National Crime Victimization Survey, 20 percent of students reported being bullied during the 201617 school year. Of those students, 15 percent reported being bullied online or by text, which is an increase from 11.5 percent during the 201415 school year.

During the 201617 school year, students’ reports of bullying online or by text were found to differ by sex, race, and school level. For instance, three times as many female students reported being bullied online or by text (21 percent) as male students (7 percent), and about 17 percent of White students reported being bullied online or by text, compared with 12 percent of students of other races. Also, a higher percentage of high school students reported being bullied online or by text (19 percent) than middle school students (12 percent).

In the 2017 School Crime Supplement (SCS), students reported being bullied online or by text in higher percentages than did students being bullied only in person in three key types of bullying.

  • Students who reported being bullied online said they were made fun of, called names, or insulted more often (74 percent) than students who reported being bullied in person only (63 percent).
  • 90 percent of students bullied online reported that rumors were spread about them, compared to 62 percent of those who reported being bullied in person only.  
  • 39 percent of students being bullied online reported that they were excluded from activities on purpose, compared to 23 percent of students who reported being bullied in person only.


Browse the full report for more bullying estimates from the 2016–17 school year.


By Rachel Hansen


References

Lessne, D., and Yanez, C. (2016). Student Reports of Bullying: Results From the 2015 School Crime Supplement to the National Crime and Victimization Survey (NCES 2017-015). U.S. Department of Education. Washington, DC: National Center for Education Statistics. Retrieved March 28, 2019, from https://nces.ed.gov/pubs2017/2017015.pdf.

Yanez, C., and Seldin, M. (2019). Student Reports of Bullying: Results From the 2017 School Crime Supplement to the National Crime and Victimization Survey (NCES 2019-054). U.S. Department of Education. Washington, DC: National Center for Education Statistics. Forthcoming.

Differences in Postsecondary Enrollment and Employment by Socioeconomic Status

New data suggest that the socioeconomic status of high school freshmen plays a role in their future education and employment.  

The data come from the NCES High School Longitudinal Study of 2009 (HSLS:09), which follows a nationally representative group of ninth-graders. In 2009, NCES measured the socioeconomic status (SES) of these students by collecting data on the income, occupation, and educational attainment of their parents or guardians. In 2016, NCES conducted a follow-up survey with the 2009 ninth-graders, gathering data on their educational and employment status.   

Data show that 2009 ninth-graders who were in the lowest-SES category were 20 percentage points more likely to be neither enrolled in postsecondary education nor working in 2016 than those in the highest-SES category (figure 1). These students were also 50 percentage points less likely to be enrolled in postsecondary institutions than those in the highest-SES category (figure 2).


These findings are just a glimpse into the insights on socioeconomic mobility that HSLS:09 can generate by linking data on parent and child educational attainment and employment.

Check out our recent spotlight indicator in the Condition of Education for more information on how the educational and employment outcomes of young adults varied in relation to family socioeconomic status.


By Joel McFarland


Introducing the 2020 Classification of Instructional Programs (CIP) and Its Website

The National Center for Education Statistics (NCES) is pleased to announce the release of the 2020 Classification of Instructional Programs (CIP), which reflects the various programs of study being offered at postsecondary institutions around the country. This is the sixth edition of the CIP and contains more than 300 new programs of study, which can be searched on the new 2020 CIP website.

The CIP is updated about every 10 years to reflect changes in instructional program structures and the introduction of new fields of study. Beginning next year, postsecondary institutions will use the 2020 CIP when they report the degrees and certificates awarded for the 2020 Integrated Postsecondary Education Data System (IPEDS) Completions Survey.

The CIP is a taxonomy of instructional programs that provides a classification system for the thousands of different programs offered by postsecondary institutions. Its purpose is to facilitate the organization, collection, and reporting of fields of study and program completions. CIP Codes and IPEDS Completions Survey data are used by many different groups of people for many different reasons. For instance, economists use the data to study the emerging labor pools to identify people with specific training and skills. The business community uses IPEDS Completions Survey data to help recruit minority and female candidates in specialized fields, by identifying the numbers of these students who are graduating from specific institutions.  Prospective college students can use the data to look for institutions offering specific programs of postsecondary study at all levels, from certificates to doctoral degrees.

To allow sufficient time for institutions to update their reporting systems, NCES is releasing the 2020 CIP and the new website approximately one year before it will be implemented.


The 2020 CIP website has many features, including multiple search options, an FAQ section, resources, a help page, and contact information. Users can search the 2020 CIP by code or keyword and the resource page contains lists of new, moved, and deleted CIP codes as well as Word and Excel versions of the 2020 CIP and 2010 CIP. The website also contains an online data tool called the CIP Wizard, which enables users to focus on changes at a specific institution between the 2010 and 2020 CIPs.


The CIP Wizard requires users to specify an institution by either name or IPEDS ID, a unique identification number assigned by NCES. The Wizard then searches the last 3 years of the IPEDS Completions Survey and compiles the CIP codes used by that institution. The Wizard also crosswalks an institution’s 2010 CIP codes to its 2020 CIP Codes and generates a report that categorizes the codes into the following categories:

  • No substantive changes—codes that did not change from the previous version of the CIP
  • New codes—codes that were added to this version of the CIP
  • Moved codes—codes that were relocated and have two references: one in the former location  and one in the current location
  • Deleted codes—codes that were removed from the previous version of the CIP

By looking through the CIP Wizard report, an institution can see exactly what changes have been made to the CIP codes it used in the last 3 years of Completions Survey data.


The CIP Wizard also suggests new CIP codes that might be of interest to the user, allows the user to export a report as either a Word or Excel file, and creates a file of CIP codes that can be uploaded to an institution’s reporting system.

Over the next several months, NCES will be preparing web-based tutorials on how to use the CIP website and the CIP Wizard. Until then, users can reference a list of frequently asked questions and a detailed help document, and also submit  questions by email to CIP2020@ed.gov.


By Michelle Coon

New Report Shows Increased Diversity in U.S. Schools, Disparities in Outcomes

The school-age population in the United States is becoming more racially and ethnically diverse. An NCES report released in February 2019, Status and Trends in the Education of Racial and Ethnic Groups 2018, examines how education experiences and outcomes vary among racial/ethnic groups. The report contains 36 indicators that cover preprimary to postsecondary education, as well as family background characteristics and labor force outcomes.

Between 2000 and 2017, the percentage of 5- to 17-year-olds who were White decreased from 62 to 51 percent, while the percentage who were Hispanic increased from 16 to 25 percent.


Figure 1. Percentage distribution of the U.S. resident population ages 5–17, by race/ethnicity: 2000 and 2017

# Rounds to zero.

NOTE: Data are for the resident population as of July 1 of the indicated year.

SOURCE: U.S. Department of Commerce, Census Bureau, 2000 Population Estimates, retrieved August 14, 2012, from http://www.census.gov/popest/data/national/asrh/2011/index.html; and 2017 Population Estimates, retrieved September 5, 2017, from https://www.census.gov/data/datasets/2016/demo/popest/nation-detail.html. See Digest of Education Statistics 2017, table 101.20.


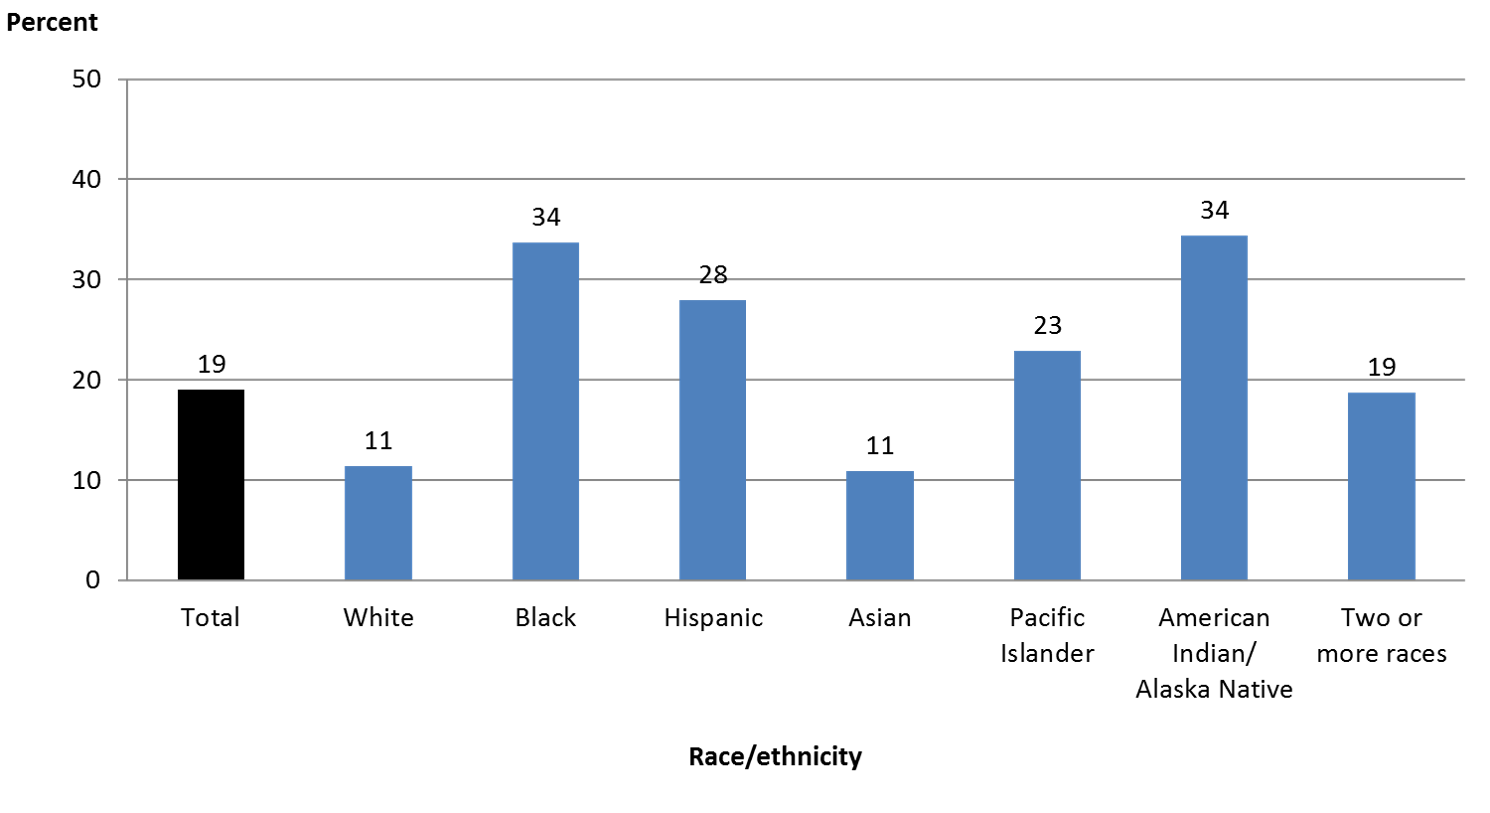
Prior research shows that living in poverty during early childhood is associated with lower-than-average academic performance that begins in kindergarten[1] and extends through high school, leading to lower-than-average rates of school completion.[2] In 2016, the percentages of children living in poverty were highest for Black and American Indian/Alaska Native children and lowest for White and Asian children.


Figure 2. Percentage of children under age 18 living in poverty, by race/ethnicity: 2016
NOTE: Data shown are based only on related children in a family; that is, all children in the household who are related to the householder by birth, marriage, or adoption (except a child who is the spouse of the householder).

SOURCE: U.S. Department of Commerce, Census Bureau, American Community Survey (ACS), 2016. See Digest of Education Statistics 2017, table 102.60.


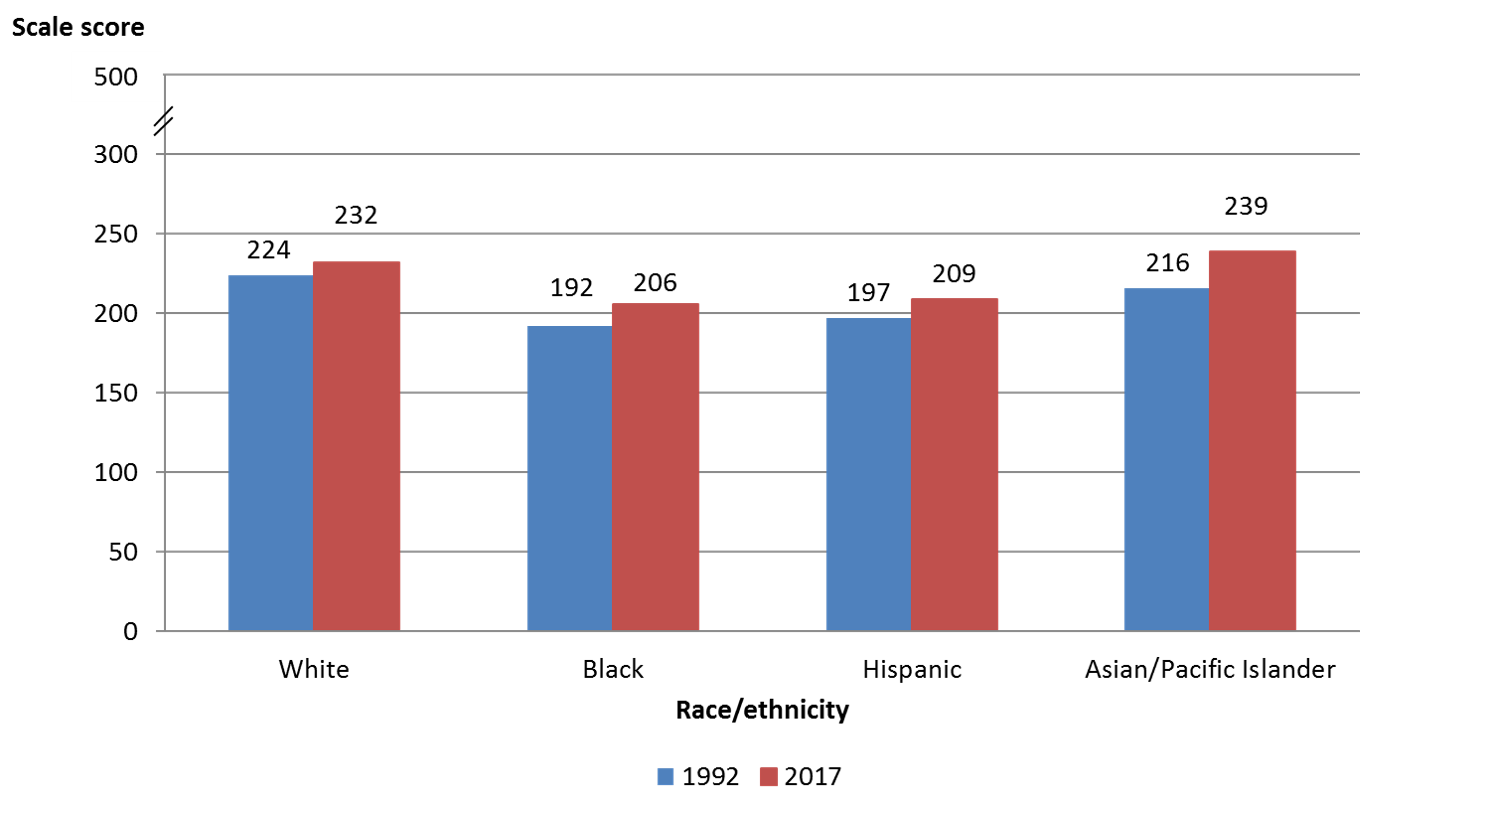
The National Assessment of Educational Progress (NAEP)—given to a representative sample of students across the United States—measures student performance over time in various subjects (including reading, math, and science) at grades 4, 8, and 12. Average grade 4 reading scores were higher in 2017 than in 1992 for the racial/ethnic groups with available data. Between 1992 and 2017, the White-Black score gap narrowed from 32 points in 1992 to 26 points in 2017. However, the White-Hispanic gap in 2017 was not measurably different from the corresponding gap in 1992.


Figure 3. Average National Assessment of Educational Progress (NAEP) reading scale scores of grade 4 students, by selected race/ethnicity: 1992 and 2017
NOTE: Includes public and private schools. Testing accommodations (e.g., extended time, small group testing) for children with disabilities and English language learners were not permitted in 1992.

SOURCE: U.S. Department of Education, National Center for Education Statistics, National Assessment of Educational Progress (NAEP), 1992 and 2017 Reading Assessments, NAEP Data Explorer. See Digest of Education Statistics 2017, table 221.10.


Looking at higher education, between 2000 and 2016, the largest changes in the racial/ethnic composition of undergraduate students were for White students and Hispanic students. The share of undergraduates who were White decreased from 70 to 56 percent, and the share who were Hispanic increased from 10 to 19 percent.


Figure 4. Percentage of total undergraduate student enrollment in degree-granting institutions, by race/ethnicity: Fall 2000 and fall 2016
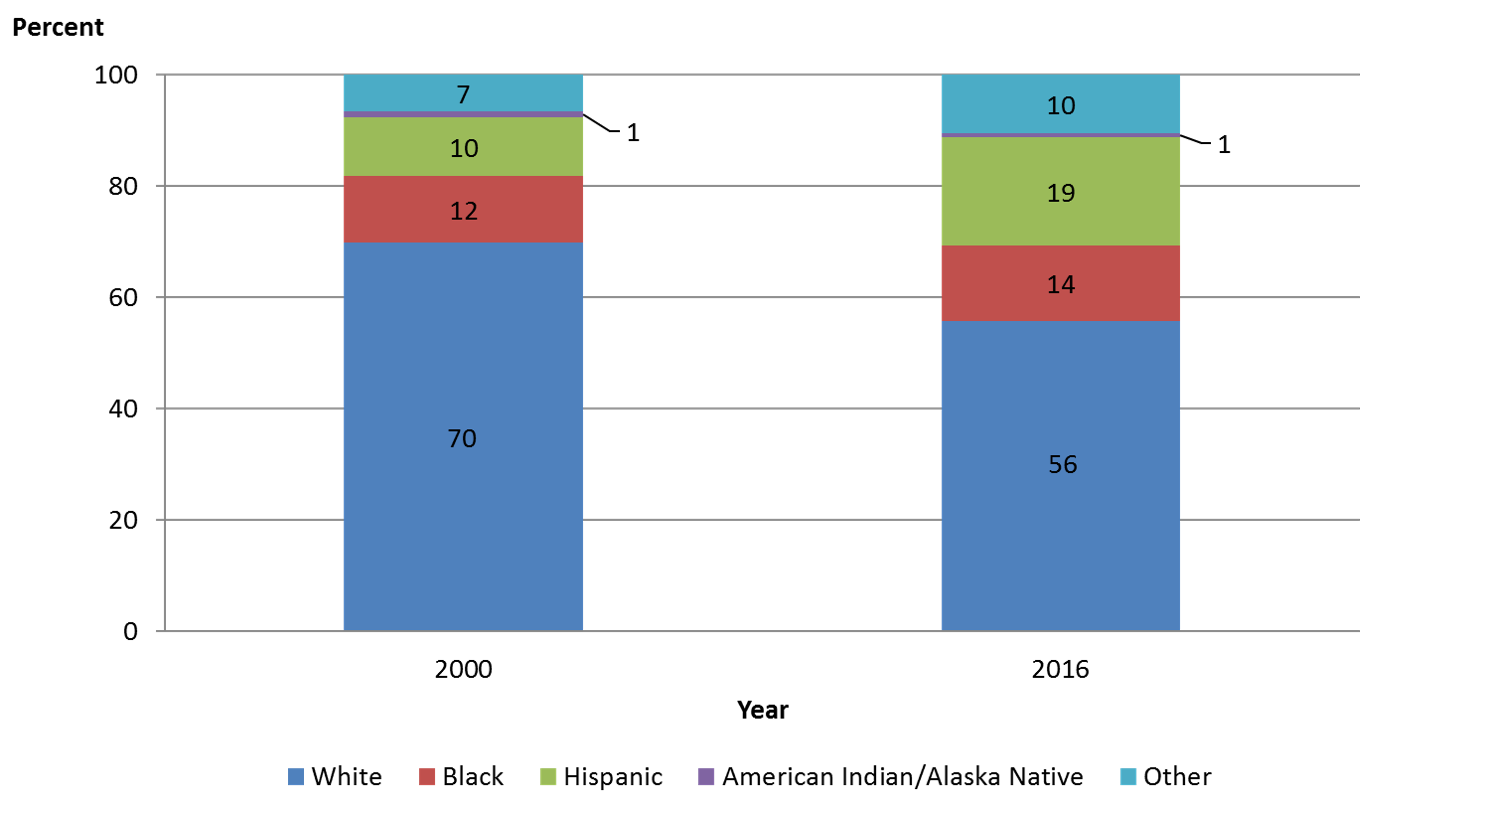
NOTE: Other includes Asian students, Pacific Islander students, and students of Two or more races.

SOURCE: U.S. Department of Education, National Center for Education Statistics, Integrated Postsecondary Education Data System (IPEDS), Spring 2001 and Spring 2017, Fall Enrollment component. See Digest of Education Statistics 2017, table 306.10.


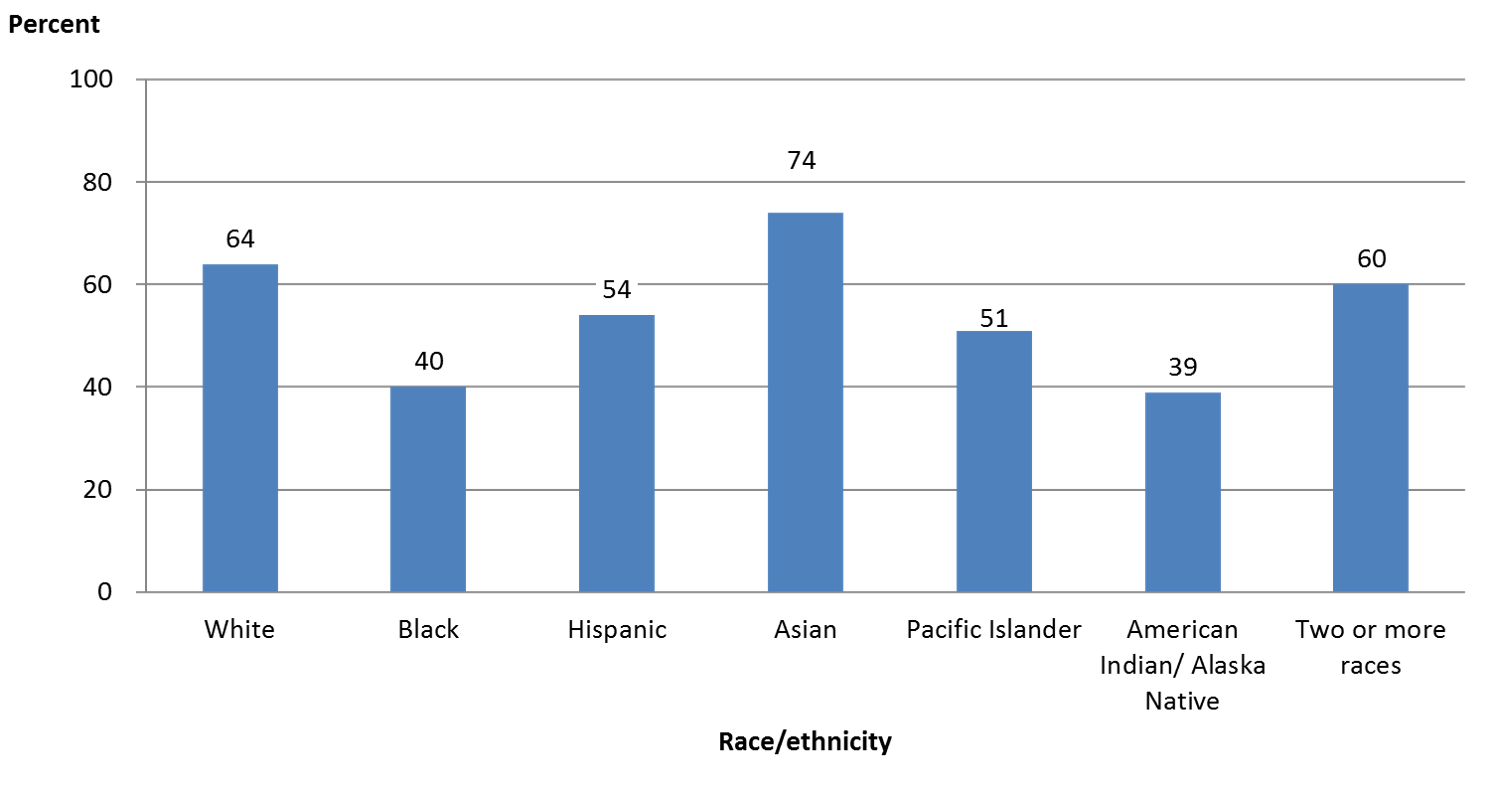
Postsecondary graduation rates vary widely by racial/ethnic group. For instance, among first-time students at 4-year institutions who enrolled in 2010, 74 percent of Asian students had graduated within 6 years. This was approximately 35 percentage points higher than the graduation rates for American Indian/Alaska Native students and Black students.   


Figure 5: Graduation rates within 6 years from first institution attended for first-time, full-time bachelor's degree-seeking students at 4-year postsecondary institutions, by race/ethnicity: Cohort entry year 2010
SOURCE: U.S. Department of Education, National Center for Education Statistics, Integrated Postsecondary Education Data System (IPEDS), Winter 2016–17, Graduation Rates component. See Digest of Education Statistics 2017, table 326.10.


The report also includes a new spotlight indicator, which highlights institutions that serve a large number of students from minority racial and ethnic groups. For instance, historically Black colleges and universities (HBCUs) are defined as “any historically Black college or university that was established prior to 1964, whose principal mission was, and is, the education of Black Americans.” In fall 2016, there were 102 HBCUs that enrolled over 292,000 students, 77 percent of whom were Black.


The spotlight also highlights other groups of minority-serving institutions—Hispanic-serving institutions, Tribally controlled colleges and universities, and Asian American and Native American Pacific Islander-serving institutions—describes how an institution is recognized as belonging to one of these groups, and discusses other institution characteristics, such as enrollment and degrees conferred.

For more information, visit the report’s website, where you can browse the indicators or download the full report


By Cris de Brey


[1] Mulligan, G.M., Hastedt, S., and McCarroll, J.C. (2012). First-Time Kindergartners in 2010–11: First Findings From the Kindergarten Rounds of the Early Childhood Longitudinal Study, Kindergarten Class of 2010–11 (ECLS-K:2011) (NCES 2012-049). U.S. Department of Education. Washington, DC: National Center for Education Statistics. Retrieved from https://nces.ed.gov/pubsearch/pubsinfo.asp?pubid=2012049.

[2] Ross, T., Kena, G., Rathbun, A., KewalRamani, A., Zhang, J., Kristapovich, P., and Manning, E. (2012). Higher Education: Gaps in Access and Persistence Study (NCES 2012-046). U.S. Department of Education. Washington, DC: National Center for Education Statistics. Retrieved from https://nces.ed.gov/pubsearch/pubsinfo.asp?pubid=2012046.

Revenues and Expenditures for Public Schools Rebound for Third Consecutive Year in School Year 2015–16

Revenues and expenditures per pupil on elementary and secondary education increased in school year 2015–16 (fiscal year [FY] 2016), continuing a recent upward trend in the amount of money spent on public preK–12 education. This is the third consecutive year that per pupil revenues and expenditures have increased, reversing three consecutive years of declines in spending between FY 10 and FY 13 after adjusting for inflation. The findings come from the recently released Revenues and Expenditures for Public Elementary and Secondary School Districts: School Year 2015–16 (Fiscal Year 2016).


The national median of total revenues across all school districts was $12,953 per pupil in FY 16, reflecting an increase of 3.2 percent from FY 15, after adjusting for inflation.[1] This increase in revenues per pupil follows an increase of 2.0 percent for FY 15 and 1.6 percent for FY 14. These increases in revenues per pupil between FY 14 and FY 16 contrast with the decreases from FY 10 to FY 13. The national median of current expenditures per pupil was $10,881 in FY 16, reflecting an increase of 2.4 percent from FY 15. Current expenditures per pupil also increased in FY 15 (1.7 percent) and FY 14 (1.0 percent). These increases in median revenues and current expenditures per pupil between FY 14 and FY 16 represent a full recovery in education spending following the decreases from FY 10 to FY 13.

The school district finance data can help us understand differences in funding levels for various types of districts. For example, median current expenditures per pupil in independent charter school districts were lower than in noncharter and mixed charter/noncharter school districts in 21 out of the 25 states that were able to report finance data for independent charter school districts. Three of the 4 states where median current expenditures were higher for independent charter school districts had policies that affected charter school spending. The new School District Finance Survey (F-33) data offer researchers extensive opportunities to investigate local patterns of revenues and expenditures and how they relate to conditions for other districts across the country.


By Stephen Q. Cornman, NCES; Malia Howell, Stephen Wheeler, and Osei Ampadu, U.S. Census Bureau; and Lei Zhou, Activate Research


[1] In order to compare from one year to the next, revenues are converted to constant dollars, which adjusts figures for inflation. Inflation adjustments use the Consumer Price Index (CPI) published by the U.S. Department of Labor, Bureau of Labor Statistics. For comparability to fiscal education data, NCES adjusts the CPI from a calendar year basis to a school fiscal year basis (July through June). See Digest of Education Statistics 2016, table 106.70, https://nces.ed.gov/programs/digest/d16/tables/dt16_106.70.asp.