By Lauren Musu-Gillette
Individuals are required to make a large number of financial decisions throughout the course of their lifetime, and financial literacy is an important skill for tasks ranging from setting a budget to saving money for retirement. A good foundation in financial literacy can help adolescents enter higher education and the workforce with a better understanding of how to make informed decisions.
The United States participated in the Program for International Student Assessment (PISA) financial literacy assessment in order to assess the financial literacy of a nationally representative sample of U.S. 15-year-olds. Students from 14 other education systems around the world also participated. Results are also available for Massachusetts and North Carolina. A recent NCES Data Point shows how U.S. students compare to their peers in other countries.
In 2015, The U.S. average score on the PISA financial literacy assessment was not measurably different from the average of the 10 participating Organization for Economic Cooperation and Development (OECD) countries. The U.S. average was lower than the average in six education systems, higher than the average in six, and not measurably different from the average in two education systems. The U.S. average score did not change measurably from 2012–the last time the assessment was conducted–to 2015.
As part of the PISA financial literacy assessment, students were tested on their knowledge and understanding of fundamental elements of the financial world, including financial concepts, products, and risks, and their ability to apply what they know to real-life situations involving financial issues and decisions. More information about the assessment, including sample questions, is available here.
Sample Financial Literacy Assessment Question
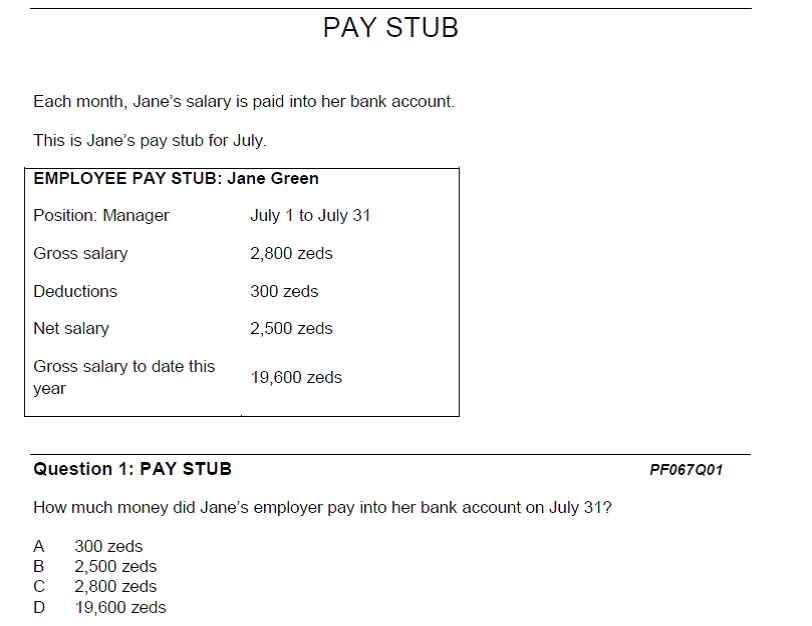
SOURCE: Organization for Economic Cooperation and Development (OECD), Program for International Student Assessment (PISA) Financial Literacy Assessment, 2012.
Ten percent of U.S. 15-year-olds scored at the top proficiency level on financial literacy in 2015. Students reaching level 5 on the PISA assessment of financial literacy demonstrate that they can apply their understanding of a wide range of financial terms and concepts to contexts that may only become relevant to their lives in the long term.[1] The percentage of students in the United States who scored at this level was lower than the OECD average and lower than the average in five education systems. It was higher than the average score in eight education systems and not measurably different from one country (Russian Federation).
Percentage of 15-year-old students performing at PISA financial literacy proficiency level below level 2 and at level 5, by education system: 2015
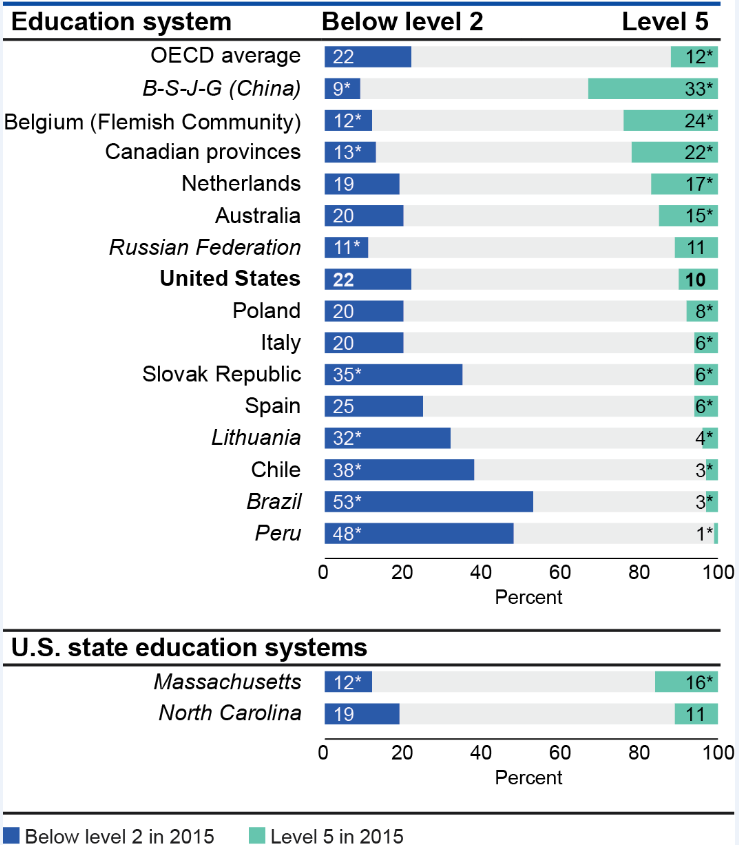
*p<.05. Percentage is significantly different than the U.S. percentage at the .05 level of statistical significance.
NOTE: Education systems are ordered by 2015 percentages of 15-year-olds at level 5. The OECD average shown here is the average of the national percentages of the 10 OECD member countries that participated in the financial literacy assessment, with each education system weighted equally. B-S-J-G (China) refers to the four PISA participating China provinces: Beijing, Shanghai, Jiangsu, and Guangdong. Canadian provinces refers to the seven provinces that participated in the financial literacy assessment: British Columbia, Manitoba, New Brunswick, Newfoundland and Labrador, Nova Scotia, Ontario, and Prince Edward Island. Italics indicate non-OECD countries and education systems. Results for Massachusetts and North Carolina are for public school students only. The score point ranges for the proficiency levels are shown in exhibit 1 and the standard errors of the estimates are shown in table FL3b available at http://nces.ed.gov/surveys/pisa/PISA2015/index.asp.
SOURCE: Organization for Economic Cooperation and Development (OECD), Program for International Student Assessment (PISA),2015.
The percentage of U.S. 15-year-old students scoring below level 2, which is considered a baseline level of proficiency by the OECD, was 22 percent.[2] The U.S. percentage of low performers in 2015 was higher than four education systems and lower than five. The U.S. percentage did not differ significantly from that of the Netherlands, Australia, Poland, Italy, Spain, and the OECD average.
There was no measurable difference in the average financial literacy assessment scores for males and females in the United States in 2015. Females scored higher than males, on average, in five countries and lower than males in one country.
Difference in average scores of 15-year-old male and female students on the PISA financial literacy scale, by education system: 2015
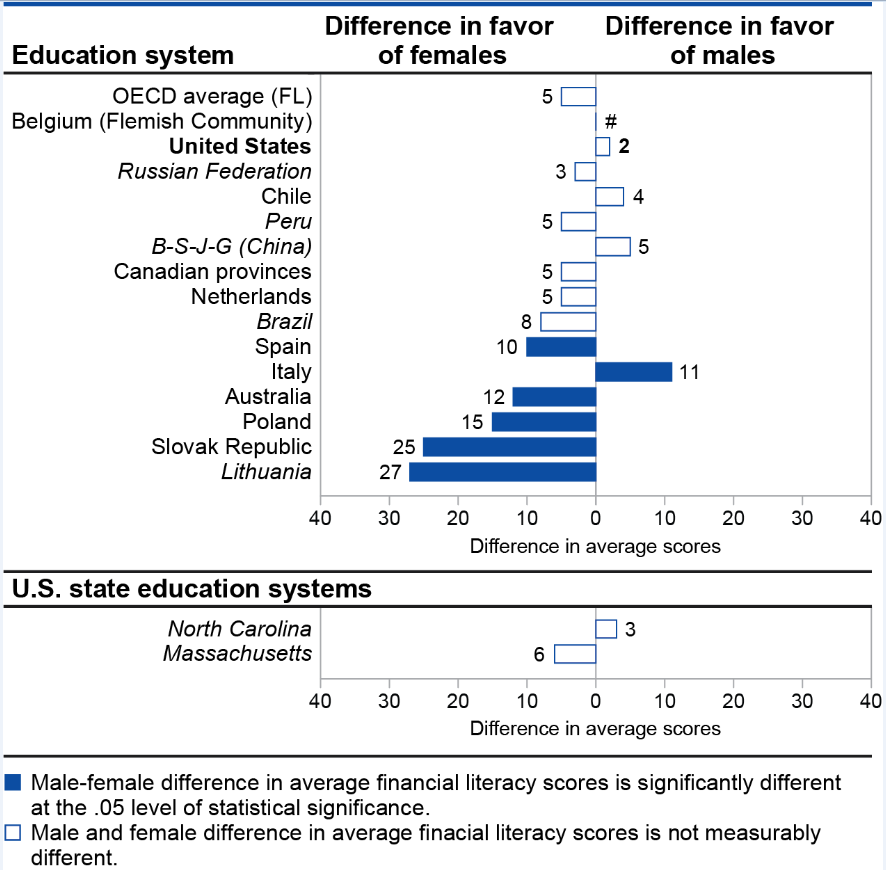
# Rounds to zero.
NOTE: Education systems are ordered by absolute male-female difference in 2015 average score. Differences were computed using unrounded numbers. Scores are reported on a scale from 0 to 1,000. The OECD average is the average of the national average score differences of the 10 OECD member countries, with each system weighted equally. Standard error is noted by s.e. Italics indicate non-OECD countries and education systems. B-S-J-G (China) refers to the four PISA participating China provinces: Beijing, Shanghai, Jiangsu, and Guangdong. Canadian provinces refers to the seven provinces that participated in the financial literacy assessment: British Columbia, Manitoba, New Brunswick, Newfoundland and Labrador, Nova Scotia, Ontario, and Prince Edward Island. Results for Massachusetts and North Carolina are for public school students only. The average scores and standard errors are shown in table FL7.
SOURCE: Organization for Economic Cooperation and Development (OECD), Program for International Student Assessment (PISA), 2015.
For more information on the results of the PISA 2015 literacy assessment, see our recently released Data Point, or explore additional data tables on our website.
[1] Students scoring at this level can analyze complex financial products and can take into account features of financial documents that are significant but unstated or not immediately evident, such as transaction costs. They can work with a high level of accuracy and solve non-routine financial problems, and they can describe the potential outcomes of financial decisions, showing an understanding of the wider financial landscape, such as income tax.
[2] Students scoring at level 2 begin to apply their knowledge of common financial products and commonly used financial terms and concepts. They can use given information to make financial decisions in contexts that are immediately relevant to them. They can recognize the value of a simple budget and can interpret prominent features of everyday financial documents. They can apply single basic numerical operations, including division, to answer financial questions. They show an understanding of the relationships between different financial elements, such as the amount of use and the costs incurred. Students scoring at level 1 can identify common financial products and terms and interpret information relating to basic financial concepts. They can recognize the difference between needs and wants and can make simple decisions on everyday spending. They can recognize the purpose of everyday financial documents such as an invoice and apply single and basic numerical operations (addition, subtraction or multiplication) in financial contexts that they are likely to have experienced personally.