NCES Blog

National Center for Education Statistics

Where can I find information about the condition of education in the United States?

By Grace Kena

The National Center for Education Statistics submits a report to Congress on the condition of education every year by June 1st. The Condition of Education provides a comprehensive look at the state and progress of education in the United States. Although The Condition of Education was first produced in 1975, the origins of the report date back to the creation of the first federal department of education in 1867. Its first major publication, the Annual Report of the Commissioner of Education, covered data for 1869-70. Today’s Condition of Education report is presented to Congress and the White House annually. In addition, the indicators are updated regularly online, with a convenient site designed for mobile devices. By visiting The Condition of Education website, you can access the latest indicators, download the full Congressional report for the current and prior years, and watch short videos about recent findings and highlights.

The Condition of Education covers early childhood through postbaccalaureate education, and addresses topics relevant to a broad spectrum of education stakeholders. The report contains text and graphics on dozens of educational indicators that describe student characteristics, participation in special programs, achievement, completion rates, as well as characteristics of teachers, schools, and colleges. Economic indicators show the success that students have in finding employment after their education, and present information on their earnings. In addition to core indicators of perennial interest and supplemental indicators on other special topics, the Condition features spotlight indicators with an in depth focus on emerging issues and new data. Taken together, these indicators provide valuable information about the progress of our education system in addressing such key policy concerns as improving graduation rates, closing gaps in student achievement, and promoting educational equity.

For more information and access to the indicators, see The Condition of Education 2016. You can also learn more about The Condition of Education in the video below, or see other videos on specific topics of interest on the NCES YouTube Channel.

This blog was originally posted on June 1, 2015 and was updated on May 26, 2016

What Are the Characteristics of Students Who Have Ever Been Suspended or Expelled From School?

By Lauren Musu-Gillette

Suspensions and expulsions from school are often associated with negative academic outcomes, such as lower levels of achievement and higher dropout rates.[i] Using data from the High School Longitudinal Study of 2009 (HSLS:2009), NCES recently published a new spotlight feature in Indicators of School Crime and Safety that shows that a greater percentage of students who are suspended or expelled have low engagement in school and are less academically successful.  

While there is a large body of research on this topic, this is the first time that the nationally representative HSLS study has been used to examine outcomes for and characteristics of suspended and expelled youth. The comparisons presented here cannot be used to establish a cause-and-effect relationship, but the longitudinal nature of the dataset could provide researchers an analytical path to understanding how these relationships have unfolded over time.

Research shows that students’ attitudes toward school are associated with their academic outcomes, and that schools with a supportive climate have lower rates of delinquency, including suspensions and expulsions.[ii] As part of the HSLS:2009 data collection, students reported on their school engagement[iii] and sense of school belonging[iv] in the fall of their ninth-grade year (2009). A greater percentage of students who were suspended or expelled between 2009 and 2012 were reported low school engagement entering high school. A similar pattern was seen with regard to a sense of belonging in school.


 Percentage of fall 2009 ninth-graders who were ever suspended or expelled through spring 2012, by school engagement and sense of school belonging: 2012
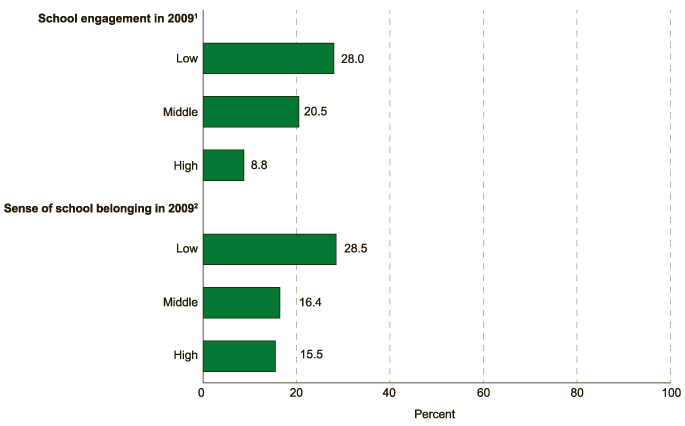
1A school engagement scale was constructed based on students' responses to questions about how frequently they went to class without homework done, without pencil or paper, without books, or late.

2A school belonging scale was constructed based on the extent to which students agreed or disagreed that they felt safe at school, that they felt proud of being part of the school, that there were always teachers or other adults at school they could talk to if they had a problem, that school was often a waste of time, and that getting good grades was important to them.

Source: U.S. Department of Education, National Center for Education Statistics, High School Longitudinal Study of 2009 (HSLS:2009).


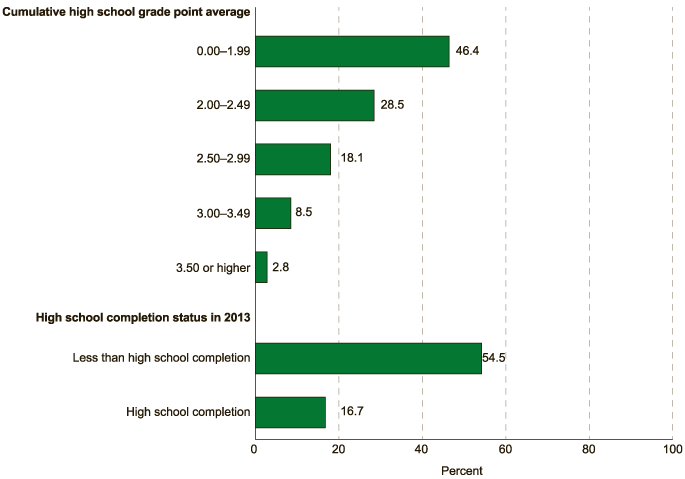
The percentages of students who had ever been suspended or expelled were higher for those students with lower grade point averages (GPAs). Nearly half of students with a cumulative high school GPA below 2.0 had ever been suspended or expelled and just 11 percent had a GPA of 3.0 or higher. Additionally, as of 2013, a higher percentage of students who had not completed high school than of students who had completed high school had ever been suspended or expelled (54 vs. 17 percent).


Percentage of fall 2009 ninth-graders who were ever suspended or expelled through spring 2012, by cumulative high school grade point average and high school completion status: 2013
Source: U.S. Department of Education, National Center for Education Statistics, High School Longitudinal Study of 2009 (HSLS:2009).


Differences in the demographic characteristics of students who had ever been suspended or expelled were similar to those found in other datasets, such as the Civil Rights Data Collection (CRDC). Characteristics of youth in the HSLS study who were ever suspended or expelled include:

  • A higher percentage of males (26 percent) than of females (13 percent) were ever suspended or expelled.
  • A higher percentage of Black students (36 percent) than of Hispanic (21 percent), White (14 percent), and Asian students (6 percent) had ever been suspended or expelled.
  • A higher percentage of students of Two or more races (26 percent) and Hispanic students had ever been suspended or expelled than White students.
  • A lower percentage of Asian students than of students of any other race/ethnicity with available data had ever been suspended or expelled.

For more information on the characteristics of students who have ever been suspended or expelled, please see the full spotlight in Indicators of School Crime and Safety 2015.


[i] Christle, C.A., Nelson, C.M., and Jolivette, K. (2004). School Characteristics Related to the Use of Suspension. Education and the Treatment of Children, 27(4): 509-526.; Skiba, R.J., Michael, R.S., Nardo, A.C., and Peterson, R.L. (2002). The Color of Discipline: Sources of Gender and Racial Disproportionality in School Punishment. Urban Review, 34(4): 317-342.

[ii] Morrison, G.M., Robertson, L., Laurie, B., and Kelly, J. (2002). Protective Factors Related to Antisocial Behavior Trajectories.Journal of Clinical Psychology, 58(3): 277-290; Christle, C.A., Jolivette, K., and Nelson, C.M. (2005). Breaking the School to Prison Pipeline: Identifying School Risk and Protective Factors for Youth Delinquency. Exceptionality, 13(2): 69-88.

[iii] School engagement measured how frequently students went to class without homework done, without pencil or paper, without books, or late.

[iv] Sense of school belonging was measured based on the extent to which students agreed or disagreed that they felt safe at school, that they felt proud of being part of the school, that there were always teachers or other adults at school they could talk to if they had a problem, that school was often a waste of time, and that getting good grades was important to them.

Number of Juvenile Offenders in Residential Placement Falls; Racial/Ethnic Gaps Persist

By Lauren Musu-Gillette and Joel McFarland

Juvenile offenders held in residential placement facilities often experience disruptions to their education as they pass in and out of traditional schooling. While most facilities provide middle- and high-school-level educational services, these services are generally not comparable to those available in their community schools.[i] Understanding the characteristics of juveniles in these facilities can help educators and policy-makers in finding the best ways to support education for these youth.  

Between 1997 and 2013, the number of youth in residential placement facilities fell by nearly 50 percent, from approximately 105,000 to just over 54,000.[ii] While the overall decline is informative, the residential placement rate (the number of juvenile offenders in residential facilities per 100,000 youth in the general population) provides a more comparable measurement across time because it accounts for population growth and demographic changes. The overall residential placement rate fell from 356 per 100,000 youth in 1997 to 173 per 100,000 in 2013. Following this trend, the residential placement rate for youth in various racial and ethnic subgroups also fell significantly as seen in the chart below.


Residential placement rate (number of juvenile offenders in residential placement facilities) per 100,000 juveniles, by race/ethnicity: Selected years, 1997 through 2013

Source: U.S. Department of Justice, Office of Juvenile Justice and Delinquency Prevention, Census of Juveniles in Residential Placement (CJRP).


Although residential placement rates declined for all racial/ethnic groups, disparities between racial/ethnic groups persist. In 2013, the residential placement rate for Black youth was 4.6 times the rate for White youth, and the rate for Hispanic youth was 1.7 times the rate for White youth. The American Indian/Alaska Native rate was 3.3 times the White rate, and the residential placement rate for Asian/Pacific Islander youth was approximately one-quarter of the rate for White youth (0.28).

The residential placement rate per 100,000 youth was also higher for Black males than for males or females of any other racial/ethnic group. Overall, Black males made up over one-third (35 percent) of all youth in residential placement in 2013. The rate of residential placement for Black males in 2013 was 804 per 100,000, which was 1.6 times the rate for American Indian/Alaska Native males, 2.7 times the rate for Hispanic males, 5 times the rate for White males, and more than 16 times the rate for Asian/Pacific Islander males.

While residential placement rates were lower for females than males from all racial/ethnic groups, there were also differences between racial/ethnic groups for females. The residential placement rate was highest for American Indian/Alaska Native females. This rate was 3.7 times the rate for Hispanic females, 4.8 times the rate for White females, and over 20 times the rate for Asian/Pacific Islander females. The rate for Black females was also more than twice the rate for Hispanic, White, and Asian/Pacific Islander females.


Residential placement rate (number of juvenile offenders in residential placement facilities) per 100,000 juveniles, by race/ethnicity and sex: 2013

Source: U.S. Department of Justice, Office of Juvenile Justice and Delinquency Prevention, Census of Juveniles in Residential Placement (CJRP).


Older youth made up a greater share of juveniles in residential placement than younger youth in 2013. A majority (69 percent) of juveniles in residential facilities were between the ages of 16 and 20; about 30 percent were between the ages of 13 and 15; and just 1 percent were age 12 or younger.

For more information on juvenile offenders in residential placement facilities, including data on the characteristics of those facilities, please see the full spotlight in Indicators of School Crime and Safety 2015.


[i] Hockenberry, S., Sickmund, M., and Sladky, A. (2013). Juvenile Residential Facility Census, 2010: Selected Findings. Washington, DC: Office of Juvenile Justice and Delinquency Prevention, U.S. Department of Justice. Retrieved November 2015 from http://www.ojjdp.gov/pubs/241134.pdf; The Council of State Governments Justice Center. (2015). Locked Out: Improving Educational and Vocational Outcomes for Incarcerated Youth. New York: Author. Retrieved November 2015 from https://csgjusticecenter.org/youth/publications/locked-out-improving-educational-and-vocational-outcomes-for-incarcerated-youth/.

[ii] Data presented here come from the Census of Juveniles in Residential Placement (CJRP). The CJRP is a biennial survey of all secure and nonsecure residential placement facilities that house juvenile offenders, defined as persons younger than 21 who are held in a residential setting as a result of some contact with the justice system (i.e., being charged with or adjudicated for an offense). The CJRP provides a 1-day count of the number of youth in residential placement, as well as data on the characteristics of youth in these facilities and information about the facilities themselves.

A Milestone for Education Statistics: The 50th edition of the Digest of Education Statistics

By Tom Snyder

For more than five decades, the Digest of Education Statistics has been addressing the data needs of a wide array of people, from policymakers who require a reliable, unbiased foundation for decision-making to researchers who seek to unravel the complex facts underlying key issues of the day; from reporters who need in-depth information for education-related news stories to organizational leaders who rely on annually updated data to steer their course. The Digest also serves the needs of everyday citizens who may be curious about such things as the number of high school graduates in the United States, the latest trends in postsecondary costs and financial assistance, or the earnings of employees with various types of degrees.

Released on April 28, Digest of Education Statistics 2014 is the 50th in a series of reports that has been issued annually since 1962, except for combined editions for the years 1977-78, 1983-84, and 1985-86. The Digest provides a compilation of statistical information covering the broad field of American education from prekindergarten through graduate school. Subject matter includes the number of schools and colleges, teachers, enrollments, and graduates, in addition to data on educational attainment, finances, federal funds for education, libraries, and international education.

The Digest continues a long tradition of recurring statistical reports issued by NCES and its predecessor agencies. From 1869-70 to 1916-17, statistical data were included in the Annual Report of the Commissioner of Education. A similar report, the Biennial Survey of Education in the United States, was issued every other year from 1917-18 to 1957-58.

By the summer of 1962, the need for an annual statistical summary report had become obvious to agency staff, and the first edition of the Digest was published. Dr. Vance Grant, who played a leading role in developing the first edition of the Digest, continued to direct the project until the 1985-86 edition. During these years, the Digest responded to the growing data needs of policymakers by adding new information on children with disabilities, preprimary education, career and technical education, educational attainment, and salary data. In 1987, I took over the responsibility of publishing the Digest, and we have continued to make changes that meet the needs of the policy community. This includes expanding the quantity of state-level tables, constructing tables to show institution-level data for large school districts and colleges, and adding more racial/ethnic data.

Beginning with the 1995 edition, a strong web presence was developed for the Digest, reflecting increased needs for digital access to education data. The full tabular content of the report is presented on the NCES website in HTML format, and a spreadsheet version of each statistical table is also available for users to download. The 2013 edition introduced a revamped web structure and table-numbering system that makes it easier for users to quickly find the latest version of a specific table, as well as to explore all the tables that are currently available on a specific topic. Rather than numbering the entire set of tables sequentially, the latest editions of the Digest use a subject-matter numbering sequence that will remain the same year after year. The most current versions of Digest tables are posted to the website on a rolling basis, before the entire edition of the report has been completed.

Over the years, the Digest has evolved as an education data resource that continues to support the information needs of our modern society. The newly released 2014 edition provides convenient online access to 594 tables covering the full range of education topics.

Celebrate National Library Month: The Future of Libraries

By Christopher Cody and Bao Le

April is National Library Month! Did you know that NCES collects data on libraries?

While libraries have traditionally provided the public with a physical space for learning and accessing resources and information, the role of the library has expanded with advances in technology. With the dawn of the digital age, libraries have been working to meet the challenges of expanding access, learning opportunities, and overall public connection.[i] Academic libraries in particular, which are libraries located within postsecondary institutions, have embraced technological improvements, as shown in data collected by the National Center for Education Statistics (NCES).

The Academic Libraries (AL) Survey has a rich history at NCES, starting in 1966 when we began conducting the surveys on a three-year cycle as part of the Integrated Postsecondary Education Data System (IPEDS). The survey moved around a bit, but is now fully housed in IPEDS and is currently administered on a yearly cycle.

IPEDS’s AL Survey offers an abundance of data to track the advancement of libraries, including data on topics such as collections/circulations, expenses, and interlibrary services. These data show a clear progression of libraries into the digital age. Here are some highlights:

  • In 1996, “80 percent of institutions with an academic library had access from within the library to an electronic catalog of the library’s holdings, 81 percent had internet access within the library.”[ii]
  • In 1996, about 40 percent had library reference service by e-mail. Just 10 years later, 72 percent of academic libraries provided library reference service by e-mail or the internet.[iii]
  • In 2006, only 6 percent of all academic library collections were e-books. By 2014-15, about 23 percent of all collections were e-books and 31 percent of the total library collections were from electronic and digital sources (e-books, e-media, and databases) as shown in Enrollment and Employees in Postsecondary Institutions, Fall 2014; and Financial Statistics and Academic Libraries, Fiscal Year 2014: First Look (Provisional Data).
  • In 2014-15, postsecondary institutions housed approximately 1.1 billion items in physical library collections (books and media) and about 521 million items in electronic library collections (digital/electronic books, databases, and digital electronic media).


Over the past 20 years, libraries have evolved to ensure information is accessible to the public through the latest mediums of technology.


So in honor of National Library Month, take advantage of the abundant historical academic and school library data available through NCES located on the Library Statistics Program page. More recent academic library data can be accessed by visiting the Use the Data portal on the IPEDS website.


[i] Clark, L., Levien, R. E., Garmer, A. K., and Figueroa, M. (2015). Re-Thinking the Roles of U.S. Libraries. In D. Bogart and A. Inouye (Eds.), Library and Book Trade Almanac: formerly The Bowker Annual 2015, 60th Edition (pg. 3-22). Medford, NJ: Information Today Inc.

[ii] Cahalan, M. W., Justh, N. M., and Williams, J. W. (1999). Academic Libraries: 1996 (NCES 2000-326). National Center for Education Statistics, Institute of Education Sciences, U.S. Department of Education. Washington, DC.

[iii] Holton, B., Hardesty, L., and O’Shea, P. (2008). Academic Libraries: 2006 (NCES 2008-337). National Center for Education Statistics, Institute of Education Sciences, U.S. Department of Education. Washington, DC.