NCES Blog

National Center for Education Statistics

NCES Celebrates IES and NCES Anniversaries With Retrospective Report on Federal Education Statistics

This year marks the 20th anniversary of the Institute of Education Sciences (IES) and 155 years since the creation of a federal agency to collect and report education statistics for the United States, a role now fulfilled by the National Center for Education Statistics (NCES). To celebrate both of these anniversaries, NCES has just released a new commemorative report—A Retrospective Look at U.S. Education Statistics—that explores the history and use of federal education statistics.


The 11 statistical profiles in phase I of this report can be found within two tabs: Elementary and Secondary Education and Postsecondary Education. Users can toggle between these two tabs and then select a particular statistical profile in the drop-down menu, such as Number of Elementary and Secondary Schools, High School Coursetaking, Enrollment in Postsecondary Institutions, and Postsecondary Student Costs and Financing.


Image of report website showing tabs for Elementary and Secondary Education and Postsecondary Education and the drop-down menu to select individual statistical profiles


Each of the statistical profiles in this report is broken down into the following sections:

  • what the statistic measures (what the data may indicate about a particular topic)
  • what to know about the statistic (the history of the data collection and how it may have changed over time)
  • what the data reveal (broad historical trends/patterns in the data, accompanied by figures)
  • more information (reference tables and related resources)

Each statistical profile can be downloaded as a PDF, and each figure within a profile can be downloaded or shared via a link or on social media.

For background and context, this report also includes a Historical Event Timeline. In this section, readers can learn about major periods of prolonged economic downturn, periods of military action, and periods when U.S. troops were drafted as a part of military action—as well as major pieces of federal legislation—and how some of these events could have disrupted the nation’s social life and schooling or impacted education across the country.

The report also includes a brief overview of NCES, which can be accessed by expanding the dark blue bar labeled NCES Overview: Past, Present, and Future. This section covers the history of NCES and its mission, the evolution of NCES reports and data collections, and current and future changes to NCES’s reporting methods.


Image of report website showing introductory text and the NCES Overview blue bar


This commemorative guide to federal education statistics is not intended to be a comprehensive report on the subject but rather a resource that provides an in-depth look at a selection of statistics. Stay tuned for the release of phase II next year, which will include additional statistical profiles. Be sure to follow NCES on TwitterFacebookLinkedIn, and YouTube and subscribe to the NCES News Flash to stay up-to-date!


By Megan Barnett, AIR

NCES Releases Indicators on Rural Education

NCES is excited to announce the release of five Education Across America indicators that focus on education in rural areas. These indicators—which summarize data patterns and provide analyses of the rural education experience—focus on the following topics:

For example, Rural Students’ Access to the Internet highlights the percentage of students in rural areas who had no internet access or only dial-up access to the Internet in 2019 (7 percent or 663,000 students). This percentage was higher than the percentages for students in towns (6 percent), cities (5 percent), and suburban areas (3 percent). In addition, compared with students in other locales, it was less common for students in rural areas to have fixed broadband internet access at home and more common for them to have only mobile broadband internet access at home. 


Figure 1. Percentage of 5- to 17-year-old students with no access to the Internet or only dial-up access to the Internet at home, by home locale: 2019

[click to enlarge image]

Horizontal bar chart showing the percentage of 5- to 17-year-old students with no access to the Internet or only dial-up access to the Internet at home in 2019, by home locale

NOTE: "No access to the Internet or only dial-up access to the Internet" includes households where no member accesses the Internet at home as well as households where members access the Internet only with a dial-up service. Data are based on sample surveys of the entire population residing within the United States. This figure includes only students living in households, because respondents living in group quarters (e.g., shelters, healthcare facilities, or correctional facilities) were not asked about internet access. Excludes children under age 15 who are not related to the householder by birth, marriage, or adoption (e.g., foster children) because their family and individual income is not known and a poverty status cannot be determined for them. Although rounded numbers are displayed, figures are based on unrounded data.

SOURCE: U.S. Department of Commerce, Census Bureau, American Community Survey (ACS), 2019, Restricted-Use Data File. See Digest of Education Statistics 2020, table 218.70.


These indicators are currently available through the Condition of Education Indicator System. To access them, select Explore by Indicator Topics and then select the Education Across America icon.


Image of the Condition of Education's Explore by Indicator Topics page highlighting the Education Across America section


Stay tuned for the release of additional indicators in early 2023. Then, in spring/summer 2023, check back to explore our highlights reports—which will explore key findings across multiple indicators grouped together by a theme—and our spotlight on distant and remote rural areas and the unique challenges they face.

Explore the Education Across America resource hub—including locale definitions, locale-focused resources, and reference tables with locale-based data—and watch this video to learn more about the hub. Be sure to follow NCES on TwitterFacebookLinkedIn, and YouTube and subscribe to the NCES News Flash to stay up-to-date on Education Across America releases and resources.


By Xiaolei Wang and Jodi Vallaster, NCES

U.S. Is Unique in Score Gap Widening in Mathematics and Science at Both Grades 4 and 8: Prepandemic Evidence from TIMSS

Tracking differences between the performance of high- and low-performing students is one way of monitoring equity in education. These differences are referred to as achievement gaps or “score gaps,” and they may widen or narrow over time.

To provide the most up-to-date international data on this topic, NCES recently released Changes Between 2011 and 2019 in Achievement Gaps Between High- and Low-Performing Students in Mathematics and Science: International Results From TIMSS. This interactive web-based Stats in Brief uses data from the Trends in International Mathematics and Science Study (TIMSS) to explore changes between 2011 and 2019 in the score gaps between students at the 90th percentile (high performing) and the 10th percentile (low performing). The study—which examines data from 47 countries at grade 4, 36 countries at grade 8, and 29 countries at both grades—provides an important picture of prepandemic trends.

This Stats in Brief also provides new analyses of the patterns in score gap changes over the last decade. The focus on patterns sheds light on which part of the achievement distribution may be driving change, which is important for developing appropriate policy responses. 


Did score gaps change in the United States and other countries between 2011 and 2019?

In the United States, score gap changes consistently widened between 2011 and 2019 (figure 1). In fact, the United States was the only country (of 29) where the score gap between high- and low-performing students widened in both mathematics and science at both grade 4 and grade 8.


Figure 1. Changes in scores gaps between high- and low-performing U.S. students between 2011 and 2019

Horizontal bar chart showing changes in scores gaps between high- and low-performing U.S. students between 2011 and 2019

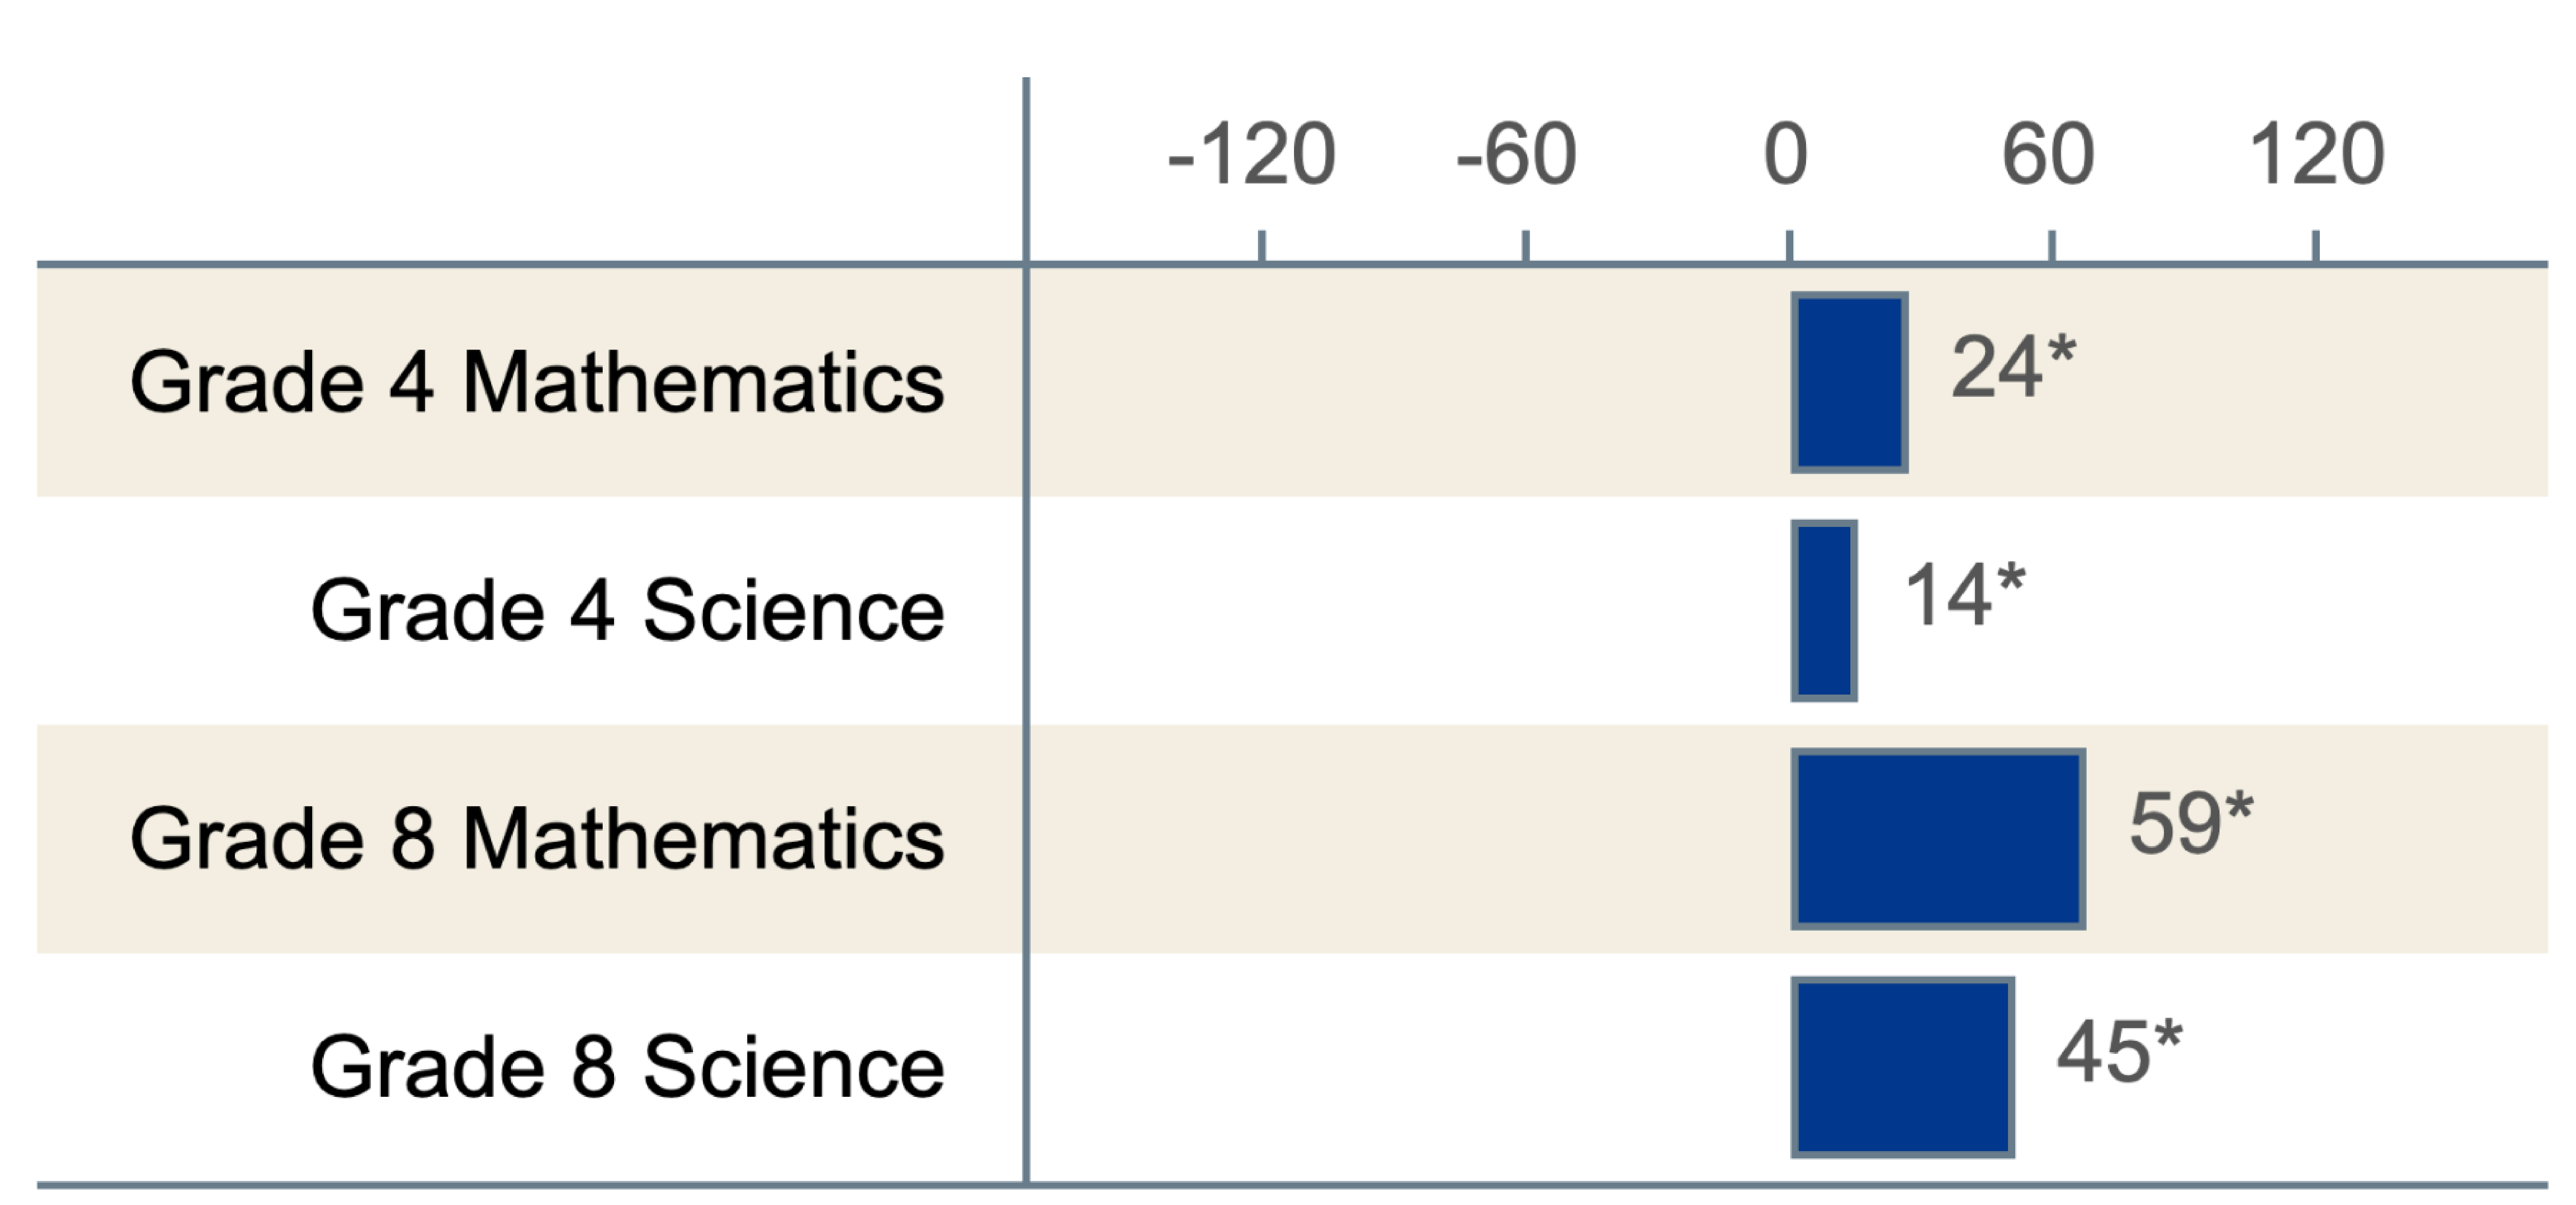
* p < .05. Change in score gap is significant at the .05 level of statistical significance.

SOURCE: Stephens, M., Erberber, E., Tsokodayi, Y., and Fonseca, F. (2022). Changes Between 2011 and 2019 in Achievement Gaps Between High- and Low-Performing Students in Mathematics and Science: International Results From TIMSS (NCES 2022-041). U.S. Department of Education. Washington, DC: National Center for Education Statistics, Institute of Education Sciences. Available at https://nces.ed.gov/pubsearch/pubsinfo.asp?pubid=2022041.


For any given grade and subject combination, no more than a quarter of participating countries had a score gap that widened, and no more than a third had a score gap that narrowed—further highlighting the uniqueness of the U.S. results.


Did score gaps change because of high-performing students, low-performing students, or both?

At grade 4, score gaps widened in the United States between 2011 and 2019 due to decreases in low-performing students’ scores, while high-performing students’ scores did not measurably change (figure 2). This was true for both mathematics and science and for most of the countries where score gaps also widened.


Figure 2. Changes in scores of high- and low-performing U.S. students between 2011 and 2019

Horizontal bar chart showing changes in scores of high- and low-performing U.S. students between 2011 and 2019 and changes in the corresponding score gaps

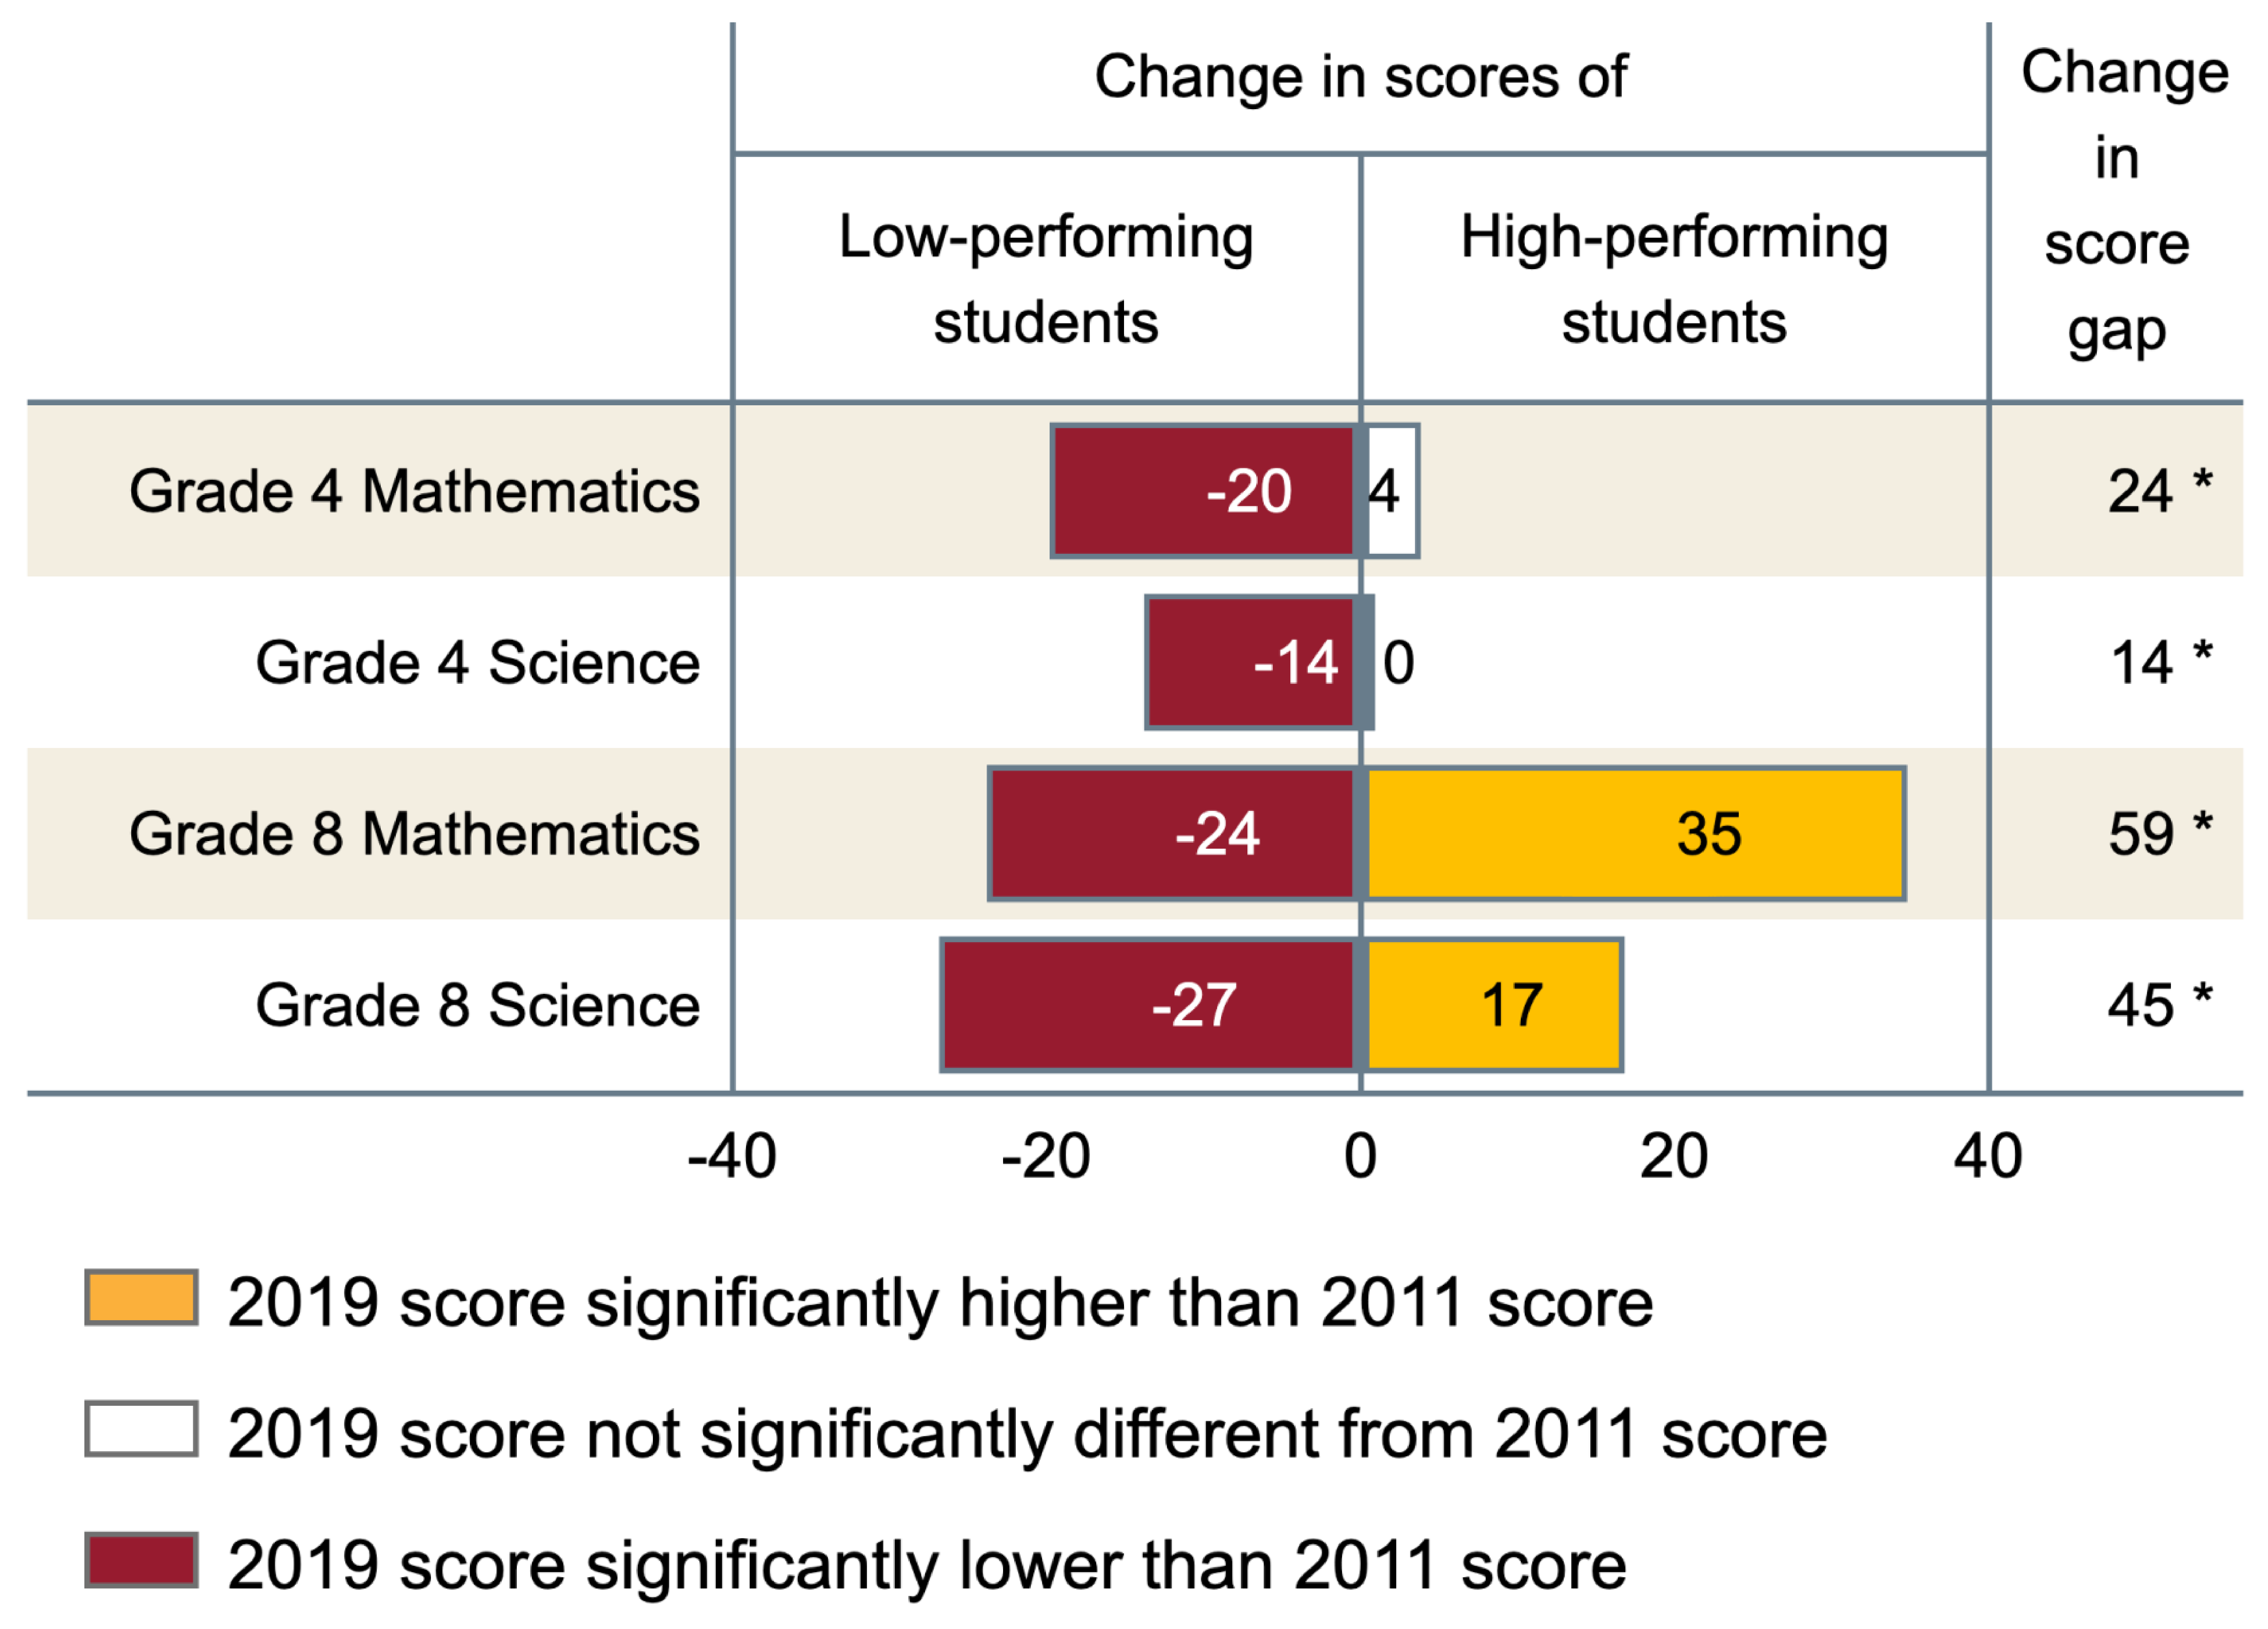
p < .05. 2019 score gap is significantly different from 2011 score gap.

SOURCE: Stephens, M., Erberber, E., Tsokodayi, Y., and Fonseca, F. (2022). Changes Between 2011 and 2019 in Achievement Gaps Between High- and Low-Performing Students in Mathematics and Science: International Results From TIMSS (NCES 2022-041). U.S. Department of Education. Washington, DC: National Center for Education Statistics, Institute of Education Sciences. Available at https://nces.ed.gov/pubsearch/pubsinfo.asp?pubid=2022041.


Low-performing U.S. students’ scores also dropped in both subjects at grade 8, but at this grade, they were accompanied by rises in high-performing students’ scores. This pattern—where the two ends of the distribution move in opposite directions—led to the United States’ relatively large changes in score gaps. Among the other countries with widening score gaps at grade 8, this pattern of divergence was not common in mathematics but was more common in science.

In contrast, in countries where the score gaps narrowed, low-performing students’ scores generally increased. In some cases, the scores of both low- and high-performing students increased, but the scores of low-performing students increased more.

Countries with narrowing score gaps typically also saw their average scores rise between 2011 and 2019, demonstrating improvements in both equity and achievement. This was almost never the case in countries where the scores of low-performing students dropped, highlighting the global importance of not letting this group of students fall behind.  


What else can we learn from this TIMSS Stats in Brief?

In addition to providing summary results (described above), this interactive Stats in Brief allows users to select a subject and grade to explore each of the study questions further (exhibit 1). Within each selection, users can choose either a more streamlined or a more expanded view of the cross-country figures and walk through the findings step-by-step while key parts of the figures are highlighted.


Exhibit 1. Preview of the Stats in Brief’s Features

Image of the TIMSS Stats in Brief web report


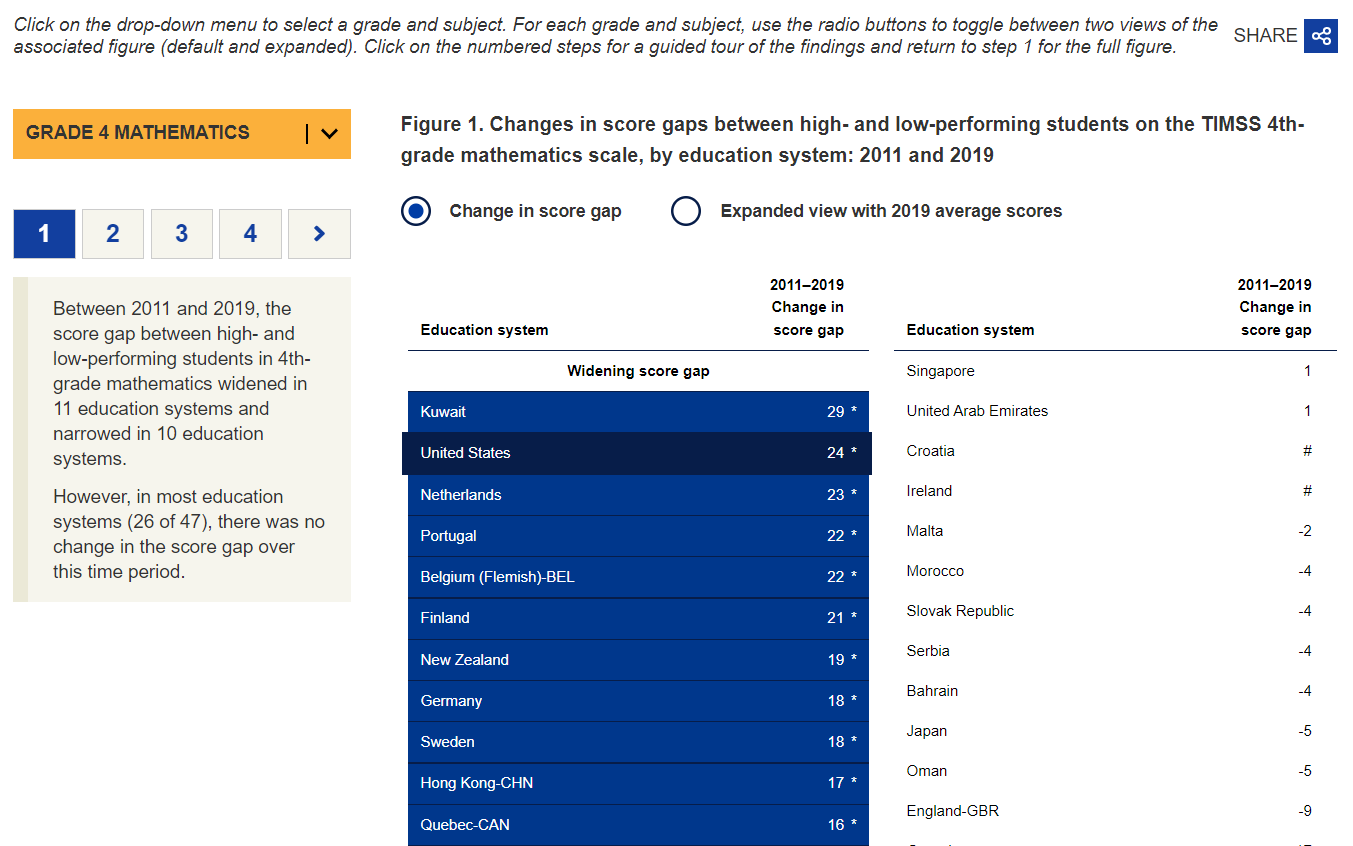
Explore NCES’ new interactive TIMSS Stats in Brief to learn more about how score gaps between high- and low-performing students have changed over time across countries.

Be sure to follow NCES on TwitterFacebookLinkedIn, and YouTube and subscribe to the NCES News Flash to stay up-to-date on TIMSS data releases and resources.


By Maria Stephens and Ebru Erberber, AIR; and Lydia Malley, NCES

Program for the International Assessment of Adult Competencies (PIAAC) 2022–23 Data Collection Begins

Last month, the National Center for Education Statistics (NCES) kicked off a major survey of adults (ages 16–74) across the nation to learn about their literacy skills, education, and work experience. Information collected through this survey—officially known as Cycle 2 of the Program for the International Assessment of Adult Competencies (PIAAC) in the United States—is used by local, state, and national organizations, government entities, and researchers to learn about adult skills at the state and local levels (explore these data in the PIAAC Skills Map, shown below).


Image of PIAAC Skills Map on state and county indicators of adult literacy and numeracy


Specifically, these data are used to support educational and training initiatives organized by local and state programs. For example, the Houston Mayor’s Office for Adult Literacy has used the PIAAC Skills Map data in developing the Adult Literacy Blueprint, a comprehensive plan for coordinated citywide change to address the systemic crisis of low literacy and numeracy in the city. In addition, the Kentucky Career and Technical College System developed a comprehensive data-driven app for workforce pipeline planning using the county-level PIAAC Skills Map data as one of the education pipeline indicators.

This is not the first time NCES is administering PIAAC. NCES collected PIAAC data three times between 2011 and 2017, when the first cycle of this international study was administered in 39 countries. Developed by the Organization for Economic Cooperation and Development (OECD), PIAAC measures fundamental cognitive and workplace skills needed for individuals to participate in society and for economies to prosper. Among these fundamental skills are literacy, numeracy, and digital problem-solving. Data from the first cycle of PIAAC (2011–17) provided insights into the relationships between adult skills and various economic, social, and health outcomes—both across the United States as a whole and for specific populations of interest (e.g., adults who are women, immigrants, older, employed, parents, or incarcerated). The OECD and NCES have published extensively using these data.

The current cycle (Cycle 2) of PIAAC will resemble the first cycle in that interviewers will visit people’s homes to ask if they are willing to answer background questionnaire and take a self-administered test of their skills. However, unlike the first cycle when respondents could respond to the survey on paper or on a laptop, this cycle will be conducted entirely on a tablet. PIAAC is completely voluntary, but each respondent is specifically selected to provide invaluable information that will help us learn about the state of adult skills in the country (participants can also receive an incentive payment for completing the survey).

PIAAC’s background questionnaire includes questions about an individual’s demographics, family, education, employment, skill use, and (new in Cycle 2 and unique to the United States) financial literacy. The PIAAC test or “direct assessment” measures literacy, numeracy, and (new in Cycle 2) adaptive problem-solving skills of adults.1

Each sampled person’s response is not only kept confidential but also “anonymized” before the data are released (so that no one can ever definitively identify an individual from personal characteristics in the datafile).

The international report and data for PIAAC Cycle 2 is scheduled to be released by the OECD in December 2024.

Be sure to follow NCES on TwitterFacebookLinkedIn, and YouTube and subscribe to the NCES News Flash to stay up-to-date on PIAAC report and data releases and resources.


By Saida Mamedova, AIR, Stephen Provasnik, NCES, and Holly Xie, NCES


[1] Data is collected from adults ages 16–74 in the United States and ages 16–65 in the other countries.

NCES Releases a New Interactive Data Visualization Tool on Revenues, Expenditures, and Attendance for Public Elementary and Secondary Education

To accompany the recently released Revenues and Expenditures for Public Elementary and Secondary Education FY 2020, NCES has created an interactive data visualization tool to highlight the per pupil revenues and expenditures (adjusted for inflation) and average daily attendance (ADA) trends from the fiscal year (FY) 2020 National Public Education Financial Survey.

This tool allows users to see national or state-specific per pupil amounts and year-to-year percentage changes for both total revenue and current expenditures by using a slider to toggle between the two variables. Total revenues are shown by source, and total current expenditures are shown by function and subfunction. Clicking on a state in the map will display data for the selected state in the bar charts.

The tool also allows users to see the ADA for each state. It is sortable by state, ADA amount, and percentage change. It may also be filtered to easily compare selected states. Hovering over the ADA of a state will display another bar graph with the last 3 years of ADA data.

Revenues and Expenditures

Between FY 2019 and FY 2020, inflation-adjusted total revenues per pupil increased by 1.8 percent (to $15,711). Of these total revenues for education in FY 2020, the majority were provided by state and local governments ($7,461 and $7,056, respectively).

The percentage change in revenues per pupil from FY 2019 to FY 2020 ranged from +15.4 percent in New Mexico to -2.4 percent in Kentucky. Total revenues per pupil increased in 38 states and the District of Columbia and decreased in 12 states between FY 2019 and FY 2020.


[click to enlarge image]Image of revenues tab of the Finance Visualization Tool showing revenues per pupil for public elementary and secondary education in FY 2019 and FY 2020


In FY 2020, current expenditures per pupil for the United States were $13,489, up 0.5 percent from FY 2019, after adjusting for inflation. Current expenditures per pupil ranged from $8,287 in Utah to $25,273 in New York. After New York, current expenditures per pupil were highest in the District of Columbia ($23,754), Vermont ($22,124), New Jersey ($21,385), and Connecticut ($20,889). After Utah, current expenditures per pupil were lowest in Idaho ($8,337), Arizona ($8,694), Oklahoma ($9,395), and Nevada ($9,548).

The states with the largest increases in current expenditures per pupil from FY 2019 to FY 2020, after adjusting for inflation, were New Mexico (+9.3 percent), Illinois (+5.7 percent), Kansas (+4.0 percent), Texas (+3.7 percent), and Indiana (+3.7 percent). The states with the largest decreases were Delaware1 (-12.8 percent), Connecticut (-2.7 percent), Arizona (-2.4 percent), Alaska (-2.0 percent), and Arkansas (-1.9 percent).

Average Daily Attendance (ADA)

During FY 2020, many school districts across the country closed their school buildings for in-person learning and began providing virtual instruction in an effort to prevent the spread of COVID-19. In order to collect the most consistent and measurable data possible, the U.S. Department of Education provided flexibility for states to report average daily attendance data for the 2019–20 school year.

Between FY 2019 and FY 2020, ADA decreased in 14 states, with the largest decrease at 2.4 percent in New Mexico. ADA increased in the remaining 36 states and the District of Columbia, with the largest increase at 4.1 percent in South Dakota. In 43 states, the ADA in FY 2020 was within 2 percent of the previous year’s ADA.


[click to enlarge image]

Image of Average Daily Attendance tab of the Finance Visualization Tool showing average daily attendance for public elementary and secondary education by state in FY 2020


To explore these and other data on public elementary and secondary revenues, expenditures, and ADA, check out our new data visualization tool.

Be sure to follow NCES on TwitterFacebookLinkedIn, and YouTube and subscribe to the NCES News Flash to stay up-to-date on the latest from the National Public Education Financial Survey.


By Stephen Q. Cornman, NCES, and Malia Howell and Jeremy Phillips, U.S. Census Bureau


[1] In Delaware, the decline in current expenditures per pupil is due primarily to a decrease in the amount reported for employee benefits paid by the state on behalf of local education agencies (LEAs). The state reviewed this decline and provided corrected data that will be published in the final file.