October is National Principals Month. Whether developing a long-term strategic vision or carrying out the day-to-day management of school operations, our nation’s principals and school administrators are essential leaders in our children’s education. This blog provides information about the backgrounds of our public school principals, including the education that they received. Data are drawn from the 2017–18 National Teacher and Principal Survey (NTPS).
The NTPS collects information about school conditions and the demographics of K–12 public and private school teachers and principals directly from the school staff themselves. Data are available both nationally and by state (via the NTPS State Dashboard) and are used by policymakers and researchers to make funding and other policy decisions.
Demographics and Characteristics of Principals
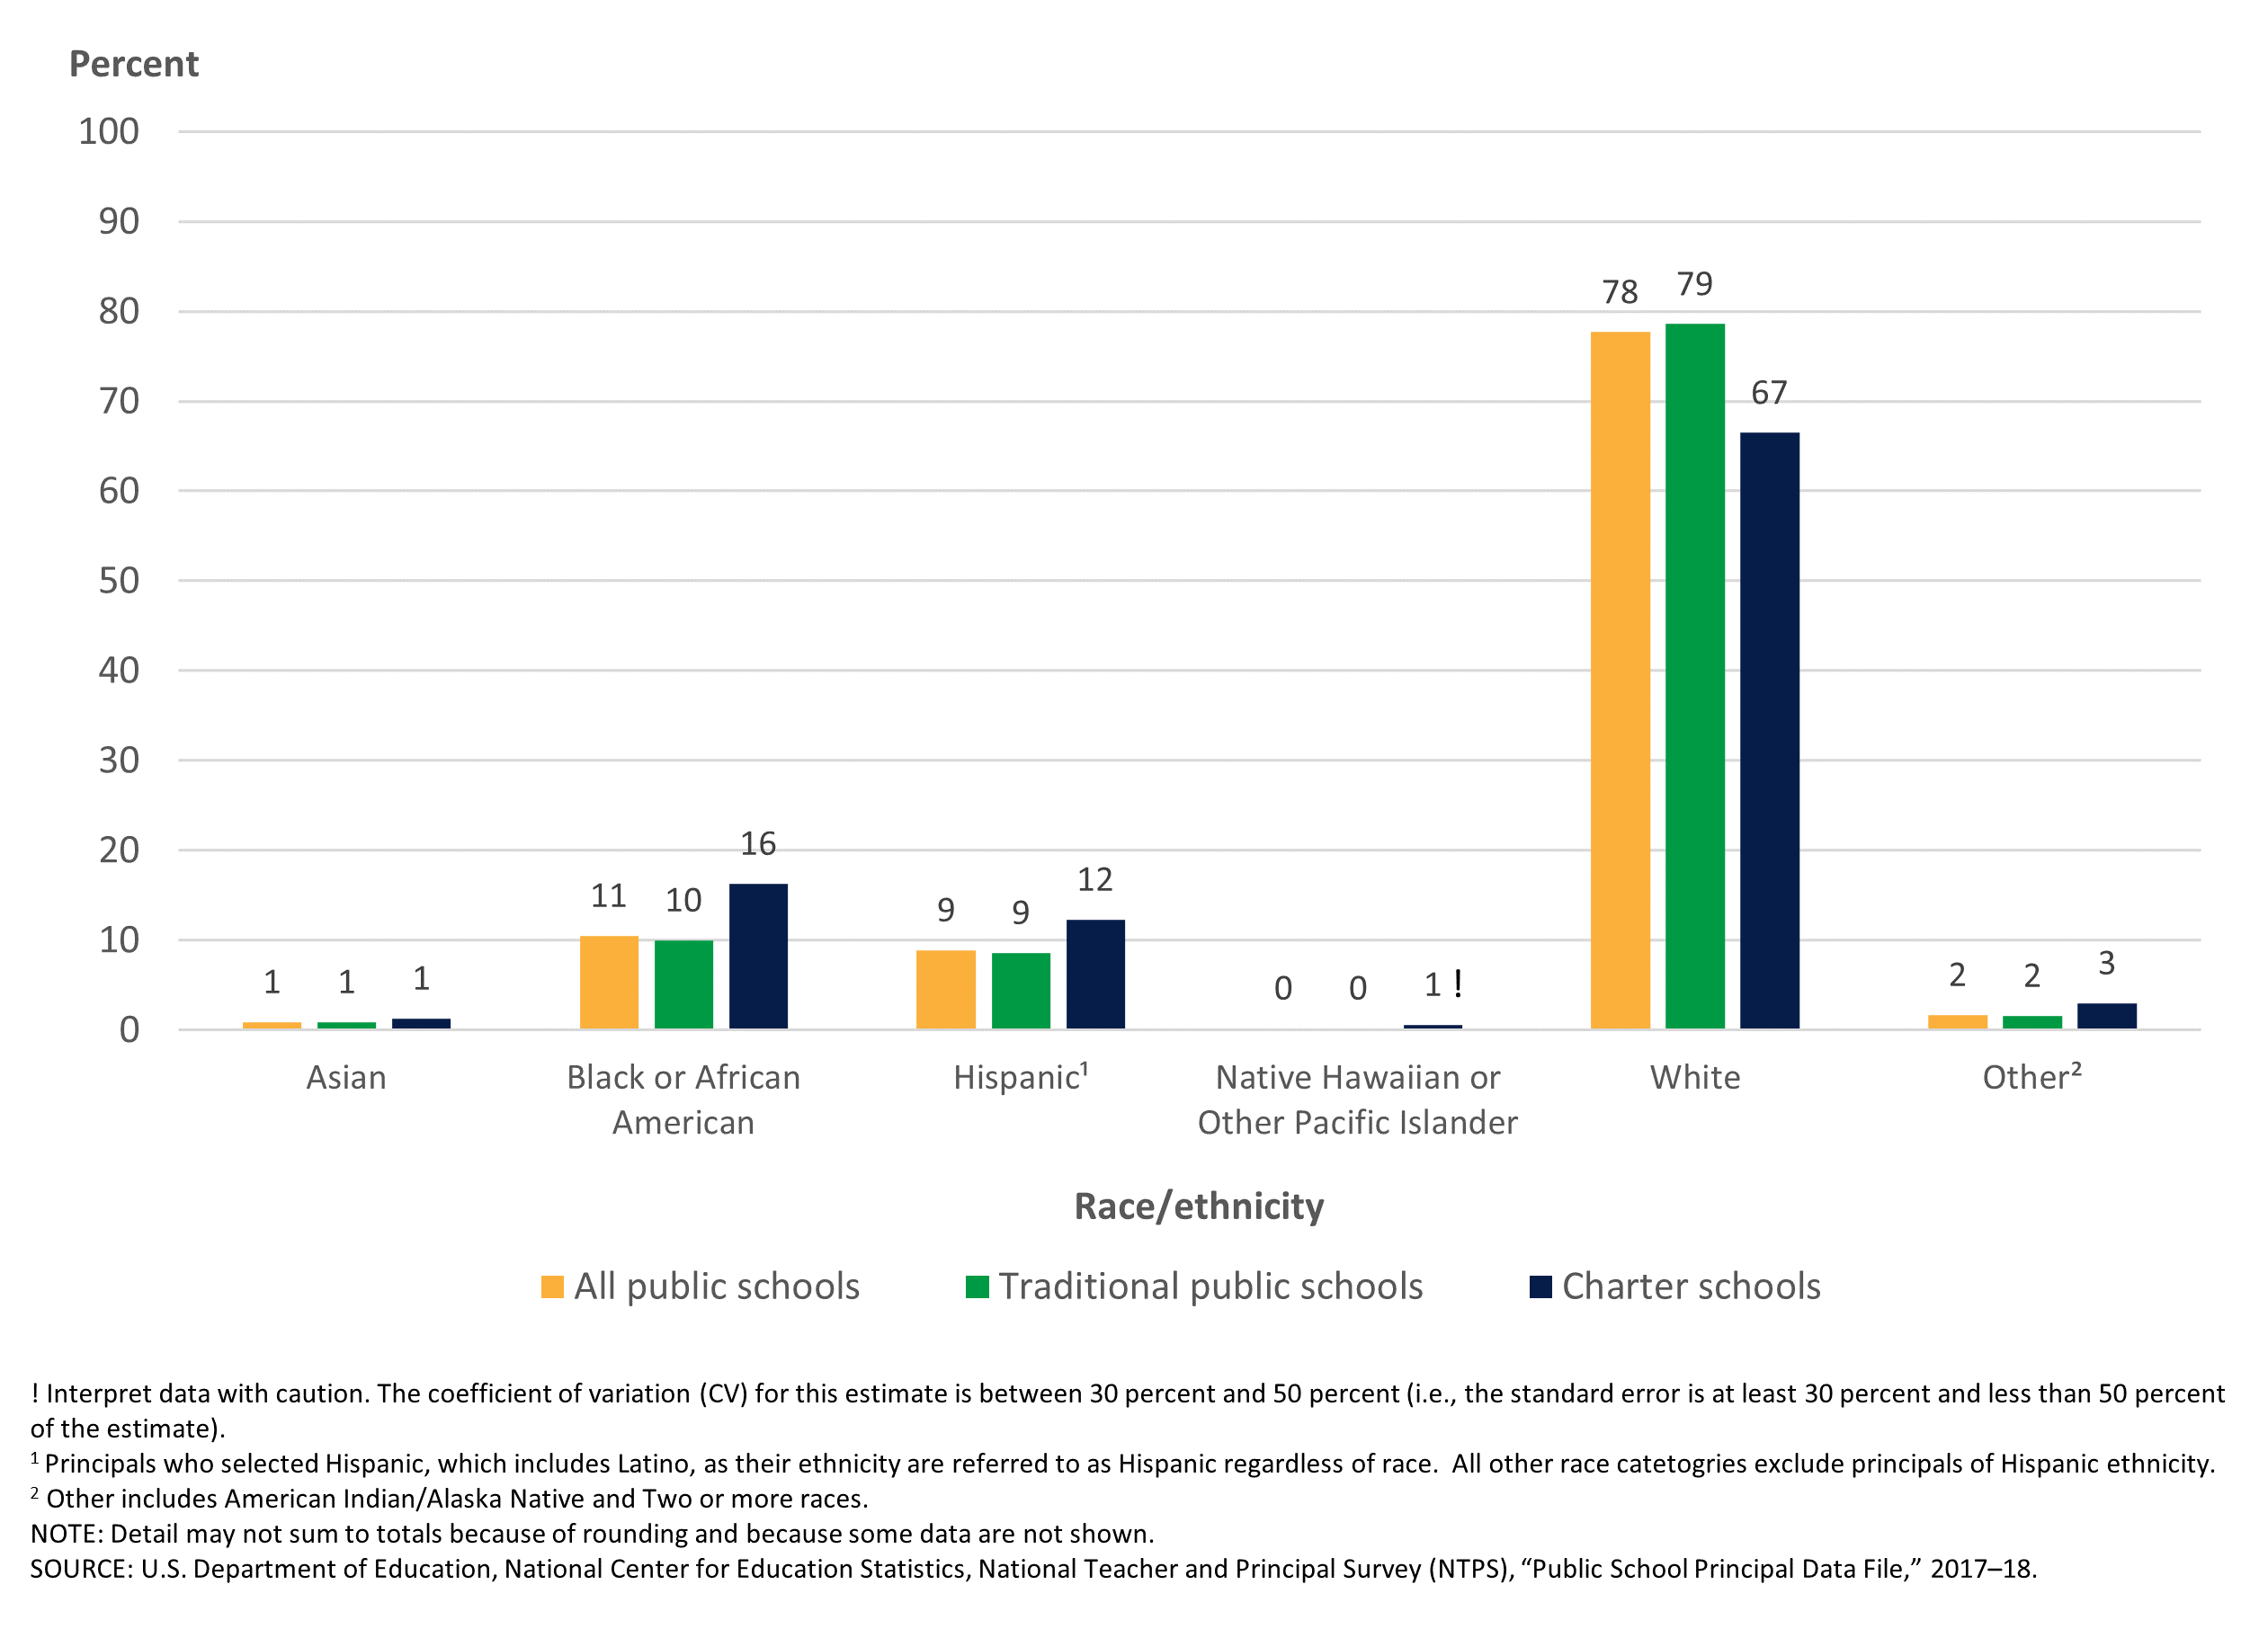
- In the 2017–18 school year, 1 percent of all public school principals were Asian, 11 percent were Black or African American, 9 percent were Hispanic, regardless of race,1 less than 1 percent were Native Hawaiian or other Pacific Islander, 78 percent were White, and 2 percent were Other2 races.
- Seventy-nine percent of all principals in traditional public schools were White, compared with 67 percent of principals in public charter schools (figure 1).
- Fifty-four percent of all public school principals were female. A higher percentage of primary school principals were female (67 percent) than were middle school (40 percent), high school (33 percent), or combined school (43 percent) principals.
Figure 1. Percentage of school principals, by race/ethnicity and school type: 2017–18
Educational Attainment and Professional Experiences of Principals
NCES would like to thank every principal and administrator whose guidance and determination advances successes for public school students across the United States each and every day.
The data in this blog would not be possible without the participation of teachers, principals, and school staff in the NTPS. We have recently concluded the 2020–21 NTPS; to learn more about teachers’ and principals’ experiences during the coronavirus pandemic, please stay tuned for an upcoming report.
If you or your school was contacted about participating in the 2021–22 Teacher Follow-up Survey (TFS) or Principal Follow-up Survey (PFS) and you have questions, please email ntps@census.gov or call 1-888-595-1338.
For more information about the National Teacher and Principal Survey (NTPS), please visit https://nces.ed.gov/surveys/ntps/. More findings and details are available in the NTPS school, teacher, and principal reports.
By Julia Merlin, NCES
[1] Principals who selected Hispanic, which includes Latino, as their ethnicity are referred to as Hispanic regardless of race. All other race categories in this blog exclude persons of Hispanic ethnicity.
[2] Other includes American Indian/Alaska Native and Two or more races.
[3] For the 2017–18 NTPS, the last school year was the 2016–17 school year.